Windows

Description

A python package for background and shading correction of optical microscopy images


BaSiCPy is a python package for background and shading correction of optical microscopy images. It is developed based on the Matlab version of BaSiC tool with major improvements in the algorithm.

Description

Colocalization Colormap –an ImageJ Plugin for the Quantification and Visualization of Colocalized Signals

This ImageJ plugin implements the Jaskolski's algorithm (Jaskolski et al. 2005). It creates a pseudo-color map of correlations between pairs of corresponding pixels in two original input images. With it one can quantitativly visualize colocalization.

Icon of the Colocalization Colormap Olugin
Description

This plugin is able to stitch an arbitrary collection or grid of images, it does not matter if it is 2d, 3d, 4d or 5d images as long as all images are of the same type. In contrast to the Pairwise Stitching of two images, this plugins will load (and potentially save) the images from/to harddisc.

grid stiching Fiji
Description

Quote:

The Pairwise Stitching first queries for two input images that you intend to stitch. They can contain rectangular ROIs which limit the search to those areas, however, the full images will be stitched together. Once you selected the input images it will show the actual dialog for the Pairwise Stitching.

has function
need a thumbnail
Description

3DeeCellTracker is a deep-learning based pipeline for tracking cells in 3D time-lapse images of deforming/moving organs.

The installation comprises a set of Jupyter notebooks and a library they depend on. The workflow steps include separate training and segmentation/tracking.

Examples of cell tracking from the reference publication are: ~100 cells in a freely moving nematode brain, ~100 cells in a beating zebrafish heart, and ~1000 cells in a 3D tumor spheroid.

Overall procedures of our method (Wen et al. eLife, 2021–Figure 1)
Description

napari-lattice is a napari plugin designed for the analysis and visualization of Lattice Lightsheet Microscopy (LLSM) and Oblique Plane Microscopy (OPM) data, particularly focusing on data acquired from Zeiss Lattice Lightsheet systems. Also available as lls-core - a command line version of the same tool which does not require napari.

napari-lattice allows users to deskew and deconlolve lattice light sheet, or any oblique plane microscopy, data. To speed processing, users can provide ROIs to be cropped and processed separately.  This significantly speeds up processing time and allows many options for parallelisation. 

Description

AnyLabeling is Effortless AI-assisted data labeling tool with AI support from Segment Anything and YOLO models!

AnyLabeling = LabelImg + Labelme + Improved UI + Auto-labeling

Installation

Standalone (executable)

The executable file links are provided in Assets section here

Install from source

git clone https://github.com/vietanhdev/anylabeling
cd anylabeling
pip install .

Install from PyPI

pip install anylabeling

With GPU support:

pip install anylabeling-gpu
Description

NODeJ is an ImageJ plugin for 3D segmentation of nuclear objects.

"The three-dimensional nuclear arrangement of chromatin impacts many cellular processes operating at the DNA level in animal and plant systems. Chromatin organization is a dynamic process that can be affected by biotic and abiotic stresses. Three-dimensional imaging technology allows to follow these dynamic changes, but only a few semi-automated processing methods currently exist for quantitative analysis of the 3D chromatin organization. We present an automated method, Nuclear Object DetectionJ (NODeJ), developed as an imageJ plugin. This program segments and analyzes high intensity domains in nuclei from 3D images. NODeJ performs a Laplacian convolution on the mask of a nucleus to enhance the contrast of intra-nuclear objects and allow their detection. We reanalyzed public datasets and determined that NODeJ is able to accurately identify heterochromatin domains from a diverse set of Arabidopsis thaliana nuclei stained with DAPI or Hoechst. NODeJ is also able to detect signals in nuclei from DNA FISH experiments, allowing for the analysis of specific targets of interest. NODeJ allows for efficient automated analysis of subnuclear structures by avoiding the semi-automated steps, resulting in reduced processing time and analytical bias. NODeJ is written in Java and provided as an ImageJ plugin with a command line option to perform more high-throughput analyses. NODeJ can be downloaded from https://gitlab.com/axpoulet/image2danalysis/-/releases with source code, documentation and further information avaliable at https://gitlab.com/axpoulet/image2danalysis . The images used in this study are publicly available at https://www.brookes.ac.uk/indepth/images/ and https://doi-org.osaka-u.idm.oclc.org/10.15454/1HSOIE ."

has function
A DAPI-stained nucleus at left, followed by a white segmentation mask, a false-color heatmap, and segmented heterochromatin blocks.
Description

An imageJ/Fiji plugin that measures and classifies neurites from a very large number of neurons.

Description

BraiAn is an open-source suite of tools designed to simplify signal quantification, analysis and visualization of large datasets typically obtained in whole-brain imaging experiments, following registration to an atlas. 

The package consists of two separate modules.

  1. BrainAnDetect: A QuPath extension for multi-channel cell segmentation across large and variable datasets. It leverages QuPath's built in algorithms for cell detection, and features additional options for refining signal quantification, including machine-learning-based object classification, region-specific cell segmentation, multiple marker co-expression analysis, and an interface for selective exclusion of damaged tissue portions.
  2. BraiAnalyse: A modular Python library for the easy navigation, visualization, and analysis of whole-brain quantification outputs.
has topic
need a thumbnail
Description

A generalist framework for multi-dimensional automatic spot detection and quantification.

SpotMAX is designed to accomplish two tasks:

  1. Detecting and quantifying globular-like structures (a.k.a. "spots")
  2. Segmenting and quantifying fluorescently labelled structures

It supports 2D, 3D, 4D, and 5D data, i.e., z-stacks, timelapse, and multiple fluorescence channels (and combinations thereof).

has function
SpotMAX Logo
Description

This workflow is the integration of YOLO (You Only Look Once) machine learning models, image pre-processing scripts and labeling tools within the Galaxy platform. Galaxy is an open, web-based platform used primarily for data analysis in computational biology, but it also has applications in image processing and other fields. 

How the Galaxy YOLO image segmentation tool works

The combination of Galaxy and YOLO allows researchers to perform object detection and image analysis without requiring extensive programming knowledge. Here's how it generally works: 

  • Web-based interface: Galaxy provides a graphical, user-friendly interface to access powerful analysis tools. Users can simply upload their image data, select the YOLO tool, and run the analysis.
  • YOLO model execution: The Galaxy tool executes a pre-trained YOLO model, often from the Ultralytics framework, on the input images. These models can perform tasks like object detection (drawing bounding boxes) or instance segmentation (creating pixel-level masks).
  • Training and prediction: Some tools allow for both model training and prediction. Users can train a custom YOLO model on their own labeled datasets to detect specific objects of interest. For example, bioimage analysis may involve detecting cells or other structures.
  • Other integrations: Other machine-learning tools can be integrated with YOLO in Galaxy. For instance, the AnyLabeling tool supports YOLO for semi-automated and active learning-based data annotation. 
Description

Description from Github page:

A GUI-based Python framework for segmentation, tracking, cell cycle annotations and quantification of microscopy data.
Provides a GUI for neural network models including Segment Anything Model (SAM), YeaZ, cellpose, StarDist, YeastMate, omnipose, delta, DeepSea.

Schematic overview of pipeline and GUI
Description

MetaXpress or in full name "MetaXpress® High-Content Image Acquisition and Analysis Software" is a commercially available closed source software for high-content analysis from Molecular Devices, LLC.. The program is a kind of visually guided workflow programming environment. There is a programming module called CME (custom module editor) which lets one setup integrated workflows for bioimage analysis with visual feedback. It is designed for high-throughput in connection with a included database which stores the experimental data. 

It has several toolboxes for semiautomated processing of various tasks:

3D Analysis (requires Custom Module Editor), Curve fitting, Transmitted light segmentation (requires Custom Module Editors), Angiogenesis tube formation, Cell cycle, Cell health, Cell scoring , Count nuclei, Granularity, Live/dead , Mitotic index, Micronuclei , Monopole detection, Multi-Wavelength cell scoring, Multi-wavelength translocation, Neurite outgrowth , Transfluor® Assay, Translocation* (includes Translocation-Enhanced*) , Transfluor HT Assay , Nuclear translocation HAT, Cell proliferation HT

After the workflow is setup it is possible to apply it automatically to a stack of stored images. The derived data from those analyses is stored in the metaxpress database and can be exported from there.

The use of each toolbox requires a separate license.

Description
# Install the ultralytics package from PyPI
pip install ultralytics

You can also install ultralytics directly from the Ultralytics GitHub repository. This can be useful if you want the latest development version. Ensure you have the Git command-line tool installed, and then run:

# Install the ultralytics package from GitHub
pip install git+https://github.com/ultralytics/ultralytics.git@main
Description

Aligning Big Brains & Atlases (ABBA) is a set of software components which allows users to register images of thin serial biological tissue sections, cut in any orientation (coronal, sagittal or horizontal) to atlases, usually brain atlases. ABBA is available as a Fiji plugin for performing registration; a QuPath extension is also available and recommended. Typically, a set of serial sections is defined as a QuPath project, that is registered within Fiji. The registration results can then imported back into QuPath for downstream processing (cell detection and classification, cell counting per region, etc.).

Available atlases include the 3D mouse Allen Brain atlas and the Waxholm Space Atlas of the Sprague Dawley Rat Brain. Depending on your installation method, you may also access all BrainGlobe atlases.

has function
need a thumbnail
Description

ImageJ macro script to streamline the original NMJ-morph methodology doi:10.1098/rsob.160240
Also requires Binary Connectivity https://blog.bham.ac.uk/intellimic/g-landini-software/ 

has function
need a thumbnail
Description

Ultralytics creates cutting-edge, state-of-the-art (SOTA) YOLO models built on years of foundational research in computer vision and AI. Constantly updated for performance and flexibility, our models are fast, accurate, and easy to use. They excel at object detection, tracking, instance segmentation, image classification, and pose estimation tasks.

SNT

Description

SNT is ImageJ’s framework for tracing, visualization, quantitative analyses and modeling of neuronal morphology. For tracing, SNT supports modern multidimensional microscopy data, semi-automated and automated routines, and options for editing traces. For data analysis, SNT features advanced visualization tools, access to all major morphology databases, and support for whole-brain circuitry data.

Schematic Overview of SNT components and SNT functionality
Description

Big-FISH is a python package for the analysis of smFISH images (2D/3D). It includes various methods to analyze microscopy images, such spot detection and segmentation of cells and nuclei.

need a thumbnail
Description

Fiji plugin to segment oocyte and zona pellucida contours from transmitted light images and extract hundreds of morphological features to describe numerically the oocyte. Segmentation is based on trained neural networks (U-Net) that were trained on both mouse and human oocytes (in prophase and meiosis I) acquired in different conditions. They are freely avaialable on the github repository and can be retrained if necessary. Oocytor also have options to extract hundreds of morphological/intensity features to characterize manually the oocyte (eg perimeter, texture...). These features can also be used in machine learning pipeline for automatic phenotyping.

Description

EPySeg is a package for segmenting 2D epithelial tissues. EPySeg also ships with a graphical user interface that allows for building, training and running deep learning models.

Training can be done with or without data augmentation (2D-xy and 3D-xyz data augmentation are supported). EPySeg relies on the segmentation_models library. EPySeg source code is available here. Cloud version available here.

has function
need a thumbnail
Description

VTK is an open-source software system for image processing, 3D graphics, volume rendering and visualization. VTK includes many advanced algorithms (e.g., surface reconstruction, implicit modeling, decimation) and rendering techniques (e.g., hardware-accelerated volume rendering, LOD control).

VTK is used by academicians for teaching and research; by government research institutions such as Los Alamos National Lab in the US or CINECA in Italy; and by many commercial firms who use VTK to build or extend products.

The origin of VTK is with the textbook "The Visualization Toolkit, an Object-Oriented Approach to 3D Graphics" originally published by Prentice Hall and now published by Kitware, Inc. (Third Edition ISBN 1-930934-07-6). VTK has grown (since its initial release in 1994) to a world-wide user base in the commercial, academic, and research communities.

Description

The BioVoxxel Toolbox is a suite which contains plugins and some macros dealing with image filtering, image segmentation and binary image processing and analysis. The following plugins are hosted here:

  • Extended Particle Analyzer
  • Binary Feature Extractor
  • Speckle Inspector
  • Watershed Irregular Features
  • EDM Binary Operations
  • Filter Check
  • Pseudo flat-field correction
  • Convoluted Background Subtraction
  • 2D Particle Distribution (Distribution_Analysis)
  • Cluster Indicator
  • SSIDC Cluster Indicator
  • Gaussian weighted Median filter
  • Adaptive Filter
  • Enhance True Color Contrast
  • Mode and Differential Limited Mean Binarization
  • Basic Recursive Filter
has topic
Description

Fast4DReg is a Fiji macro for drift correction for 2D and 3D video and is able to correct drift in all x-, y- and/or z-directions. Fast4DReg creates intensity projections along both axes and estimates their drift using cross-correlation based drift correction, and then translates the video frame by frame. Additionally, Fast4DReg can be used for alignment multi-channel 2D or 3D images which is particularly useful for instruments that suffer from a misalignment of channels.

has function
Description

A collection of Image Processing and Analysis (IPA) functions used at the Facility for Advanced Imaging and Microscopy (FAIM).

has function
need a thumbnail
Description

DeXtrusion is a machine learning based python pipeline to detect cell extrusions in epithelial tissues movies. It can also detect cell divisions and SOPs, and can easily be trained to detect other dynamic events.

DeXtrusion takes as input a movie of an epithelium and outputs the spatio-temporal location of cell extrusion events or other event as cell divisions. The movie is discretized into small overlapping rolling windows which are individually classified for event detection by a trained neural network. Results are then put together in event probability map for the whole movie or as spatio-temporal points indicating each event.

DeXtrusion probability map
Description

BIIGLE is a web-based software for image and video annotation that enables collaborative research on large datasets. It offers tools for manual and computer-assisted annotation, quality control and the collaboration on custom taxonomies to describe objects. BIIGLE is freely available and can be installed in cloud environments, a local network or on mobile platforms during research expeditions. The public instance on biigle.de is free for non-commercial use.

BIIGLE Logo
Description

TissUUmaps is a browser-based tool for fast visualization and exploration of millions of data points overlaying a tissue sample. TissUUmaps can be used as a web service or locally in your computer, and allows users to share regions of interest and local statistics.

Description

CellStich proposes a set of tools for 3D segmentation from 2D segmentation: it reassembles 2D labels obtained from cell in slices in unique 3D labels across slices. It isparticularly robust to anisotropy, and is the ideal companion to cellpose 2D models or other 2D deep learning based models. One could also think about using it for cell tracking by overlap (using time as a third dimension).

cellstitch
Description

MATLAB app to characterize nanoparticles imaged with super-resolution microscopy. nanoFeatures will read text and csv files from the NIKON and ONI microscopes and from the ThunderSTORM Fiji plugin, then cluster the localizations and filter by size and sphericity and finally output nanoparticle features like size, aspect ratio, and number of localizations per cluster (total and for each channel).

GUI first tab to browse and input files, select input type and check extra filters if needed.
Description

These are commands that create or process binary (black and white) images. Typical morphological operations/functions can be found here.

need a thumbnail
Description

ELEPHANT is a platform for 3D cell tracking, based on incremental and interactive deep learning.
It implements a client-server architecture. The server is built as a web application that serves deep learning-based algorithms. The client application is implemented by extending Mastodon, providing a user interface for annotation, proofreading and visualization.

from https://elephant-track.github.io/#/v0.5/?id=_5-proofreading
Description

ZeroCostDL4Mic: exploiting Google Colab to develop a free and open-source toolbox for Deep-Learning in microscopy

ZeroCostDL4Mic is a collection of self-explanatory Jupyter Notebooks for Google Colab that features an easy-to-use graphical user interface. They are meant to quickly get you started on learning to use deep-learning for microscopy. 

need a thumbnail
Description

btrack is a Python library for multi object tracking, used to reconstruct trajectories in crowded fields. btrack implemented a residual U-Net model coupledd with a classification CNN to allow accurate instance segmentation of the cell nuclei. To track the cells over time and through cell divisions, btrack developed a Bayesian cell tracking methodology that uses input features from the images to enable the retrieval of multi-generational lineage information from a corpus of thousands of hours of live-cell imaging data.

need a thumbnail
Description

Open source deep learning based framework for multi-animal pose tracking. It can track animal and any number of animals and has a labeling/training GUI for learning and proofreading.

has topic
has function
Description

Algorithm and software created to extract animal trajectories from videos of a collection of animals up to 100 individuals. Idtrackerai uses two convolutional networks: one for animal identification and another to detect when animals touch or cross each other.

has topic
has function
Description

The method proposed in this paper is a robust combination of multi-task learning and unsupervised domain adaptation for segmenting amoeboid cells in microscopy. This end-to-end framework provides a consolidated mechanism to harness the potential of multi-task learning to isolate and segment clustered cells from low contrast brightfield images, and it simultaneously leverages deep domain adaptation to segment fluorescent cells without explicit pixel-level re- annotation of the data.

The entry-point to the codebase is the main.py file. The user has the option to

  • Train the network on their own dataset
  • Load a pre-trained model and use that for inference on their own data
  • NoteThe provided pretrained model was trained on 256x256 images. Results on different resolutions could require fine-tuning This model is trained (supervised) on brightfield, and domain adapted to fluorescence data. The results are saved as 'inference.png'
has function
daman
Description

OrganoSeg is an open-source software that integrates segmentation, filtering, and analysis for breast-cancer spheroid and colon and colorectal-cancer organoid morphologies.

Figure 2 in OrganoSeg Scientific Reports publication
Description

OrganoID is an image analysis platform that automatically recognizes, labels, and tracks single organoids, pixel-by-pixel, in brightfield and phase-contrast microscopy experiments. The platform was trained on images of pancreatic cancer organoids and validated on separate images of pancreatic, lung, colon, and adenoid cystic carcinoma organoids.

need a thumbnail
Description

JIPipe is a visual programming language to realize code-free workflow building for ImageJ-based image analyses. GUI, graphical user interface. Currently, JIPipe unifies the functionality of over 1,000 ImageJ commands into a standardized interface, represented as nodes in the pipeline flow chart. The window-based data management implemented in ImageJ is replaced with a table-based model designed for batch processing. JIPipe is also available from within the ImageJ update service.

has function
need a thumbnail
Description

This workflow applies a Stardist pre-trained model (versatile_fluo or versatile_HE) depending on the input images ie. uses both models for a dataset including both fluorescence (grayscale or RGB where all channels are equal) and H&E stained (RGB where channels are not equal) images.

This version uses tensorflow CPU version (See Dockerfile) to ensure compatibility with a larger number of computers. A GPU version should be possible by adapting the Dockerfile with tensorflow-gpu and/or nvidia-docker images.

has topic
has function
need a thumbnail
Description

This workflow processes a group of images containing cells with discernible nuclei and segments the nuclei and outputs a binary mask that show where nuclei were detected. It performs 2D nuclei segmentation using pre-trained nuclei segmentation models of Cellpose. And it was developed as a test workflow for Neubias BIAFLOWS Benchmarking tool.

has topic
has function
need a thumbnail
Description

MiNA is a simplified workflow for analyzing mitochondrial morphology using fluorescence images or 3D stacks in Fiji. The workflow makes use of ImageJ Ops3D ViewerSkeletonize (2D/3D)Analyze Skeleton, and Ridge Detection. In short, the tool estimates mitochondrial footprint (or volume) from a binarized copy of the image as well as the lengths of mitochondrial structures using a topological skeleton. The values are reported in a table and overlays (or a 3D rendering) are generated to assess the accuracy of the analysis.

example skeleton image (from https://imagej.net/plugins/mina#processing-pipeline-and-usage)
Description

It stitches 3D tiles from terabyte-size microscopy datasets. Stitching does not require any prior information on the actual positions of the tiles, sample fiducials, or conversion of raw TIFF images, and the stitched images can be explored instantly.

MosaicExplorerJ was specifically designed to process lightsheet microscopy datasets from optically cleared samples. It can handle multiple fluorescence channels, dual-side lightsheet illumination and dual-side camera detection.

Description

 This ImageJ function automatically or interactively sets lower and upper threshold values, segmenting grayscale images into features of interest and background.

has function
need a thumbnail
Description

The authors present an ImageJ-based, semi-automated phagocytosis workflow to rapidly quantitate three distinct stages during the early engulfment of opsonized beads.

Description

FluoGAN is a fluorescence image deconvolution software combining the knowledge of acquisition physical model with gan. It takes a fluctuating sequence of blurred, undersampled and noisy images of the sample of interest  fixed sample as input from wide field or confocal and returns a super resolved image.

FluoGan
Description


Relate is a correlative software package optimised to work with EM, EDS, EBSD, & AFM data and images.  It provides the tools you need to correlate data from different microscopes, visualise multi-layered data in 2D and 3D, and conduct correlative analyses.

  • Combining data from different imaging modalities (e.g. AFM, EDS & EBSD)

  • Interactive display of multi-layer correlated data

  • Analytical tools for metadata interrogation

  • Documented workflows and processes

Correlate

  • Import data from AZtec using the H5oina file format
  • Import AFM data
  • Correlate both sets of data using intuitive image overlays and image matching tools
  • Produce combined multimodal datasets

Visualise

  • 2D display of multi-layered data
  • 3D visualisation of topography combined with AFM material properties, EM images, and EDS & EBSD map overlays
  • Customisation of colour palettes, data overlays, image rendering options, and document display
  • Export images and animations

Analyse

  • Generate profile (cross section) views of multimodal data
  • Measure and quantify data across multiple layers
  • Analyse areas via data thresholding using amount of x-ray counts, phase maps, height, or other material properties.
  • Select an extensive range of measurement parameters
  • Export analytical data to text or CSV files
Relate analysis workflow example
Description

Junction Mapper is a semi-automated software (Java Desktop application) for analysing data from images of cells in close proximity to each other in monolayers. The focus of Junction Mapper is to measure the morphology of cell boundaries, define single junctions and quantify the length, area and intensity of the staining of different proteins localised at cell-cell contacts. The output are various unique parameters that assess the contacting interface between cells and up to two junctional markers.

junction mapper
Description

SynActJ (Synaptic Activity in ImageJ) is an easy-to-use fully open-source workflow that enables automated image and data analysis of synaptic activity. The workflow consists of a Fiji plugin performing the automated image analysis of active synapses in time-lapse movies via an interactive seeded watershed segmentation that can be easily adjusted and applied to a dataset in batch mode. The extracted intensity traces of each synaptic bouton are automatically processed, analyzed, and plotted using an R Shiny workflow. 

has function
SynActJ workflow
Description

SMLM is a mature but still growing field, which still lacks efficient and user-friendly analysis and visualization software platform adapted for both users and developers. We here introduce PoCA, a powerful open-source software platform dedicated to the visualization and analysis of 2D and 3D point-cloud data. PoCA allows manipulating large datasets, and integrates a plugin architecture, a native batch analysis engine and a Python code interpreter, facilitating both the analysis of data and the integration of new methods.

Visualization, segmentation and exploration of 3D SMLM data
Description

Orthanc aims at providing a simple, yet powerful standalone DICOM server. It is designed to improve the DICOM flows in hospitals and to support research about the automated analysis of medical images. Orthanc lets its users focus on the content of the DICOM files, hiding the complexity of the DICOM format and of the DICOM protocol.

Orthanc can turn any computer running Windows, Linux or OS X into a DICOM store (in other words, a mini-PACS system). Its architecture is lightweight and standalone, meaning that no complex database administration is required, nor the installation of third-party dependencies.

What makes Orthanc unique is the fact that it provides a RESTful API. Thanks to this major feature, it is possible to drive Orthanc from any computer language. The DICOM tags of the stored medical images can be downloaded in the JSON file format. Furthermore, standard PNG images can be generated on-the-fly from the DICOM instances by Orthanc.

Orthanc also features a plugin mechanism to add new modules that extends the core capabilities of its REST API. A Web viewer, a PostgreSQL database back-end, a MySQL database back-end, and a reference implementation of DICOMweb are currently freely available as plugins.

orthanc
Description

Correlia is an open-source ImageJ/FIJI plug-in for the registration of 2D multi-modal microscopy data-sets. The software is developed at ProVIS - Centre for Correlative Microscopy and is specifically designed for the needs of chemical microscopy involving various micrographs as well as chemical maps at different resolutions and field-of-views.

Correlia
Description

The empanada-napari plugin is built to democratize deep learning image segmentation for researchers in electron microscopy (EM). It ships with MitoNet, a generalist model for the instance segmentation of mitochondria. There are also tools to quickly build and annotate training datasets, train generic panoptic segmentation models, finetune existing models, and scalably run inference on 2D or 3D data. To make segmentation model training faster and more robust, CEM pre-trained weights are used by default. These weights were trained using an unsupervised learning algorithm on over 1.5 million EM images from hundreds of unique EM datasets making them remarkably general.

Empanada-napari

MIA

Description

ModularImageAnalysis (MIA) is an ImageJ plugin which provides a modular framework for assembling image and object analysis workflows. Detected objects can be transformed, filtered, measured and related. Analysis workflows are batch-enabled by default, allowing easy processing of high-content datasets.

MIA is designed for “out-of-the-box” compatibility with spatially-calibrated 5D images, yielding measurements in both pixel and physical units.  Functionality can be extended both internally, via integration with SciJava’s scripting interface, and externally, with Java modules that extend the MIA framework. Both have full access to all objects and images in the analysis workspace.

Workflows are, by default, compatible with batch processing multiple files within a single folder. Thanks to Bio-Formats, MIA has native support for multi-series image formats such as Leica .lif and Nikon .nd2.

Workflows can be automated from initial image loading through processing, object detection, measurement extraction, visualisation, and data exporting. MIA includes near 200 modules integrated with key ImageJ plugins such as Bio-Formats, TrackMate and Weka Trainable Segmentation.

Module(s) can be turned on/off dynamically in response to factors such as availability of images and objects, user inputs and measurement-based filters. Switches can also be added to “processing view” for easy workflow control.

MIA is developed in the Wolfson Bioimaging Facility at the University of Bristol.

Description

ASTEC stands for Adaptive Segmentation and Tracking of Embryonic Cells. It proposes a full workflow for time lapse light sheet imaging analysis, including drift/motion compensation before the segmentation itself, and the capacity to correct for it.  It was used to process 3D+t movies acquired by the MuViSPIM light-sheet microscope in particular.

Astec embryon
Description

ClearMap is a toolbox for the analysis and registration of volumetric data from cleared tissues.

It was initially developed to map brain activity at cellular resolution in whole mouse brains using immediate early gene expression. It has since then been extended as a tool for the qunatification of whole mouse brain vascualtur networks at capilary resolution.

It is composed of sevral specialized modules or scripts: tubemap, cellmap, WobblyStitcher.

ClearMap has been designed to analyze O(TB) 3d datasets obtained via light sheet microscopy from iDISCO+ cleared tissue samples immunolabeled for proteins. The ClearMap tools may also be useful for data obtained with other types of microscopes, types of markers, clearing techniques, as well as other species, organs, or samples.

ClearMap SCreenshot
Description

BaSiC is a software tool for Background and Shading correction of Optical Microscopy Images. It implements an image correction method based on low-rank and sparse decomposition to solve both shading in space and background variation in time. It can correct temporal drift in time-lapse microscopy data and thus improve continuous single-cell quantification. BaSiC is available as a Fiji/ImageJ plugin.


has function
A BaSiC Tool for Background and Shading Correction of Optical Microscopy Images
Description

A collection of Java tools and HTTP services (APIs) for rendering transformed image tiles that includes:

The basic concept is to render images (tiles) based on transformation files, without having to store the big generated image from an alignment of tiles (mosaicking).

Description

Removal of heterogeneous background from image data of single-molecule localization microscopy, using extreme value-based emitter recovery (EVER).

Quote:

EVER requires no manual adjustment of parameters and has been implemented as an easy-to-use ImageJ plugin that can immediately enhance the quality of reconstructed super-resolution images. This method is validated as an efficient way for robust nanoscale imaging of samples with heterogeneous background fluorescence, such as thicker tissue and cells.

has function
Description
https://pytfm.readthedocs.io/en/latest/_images/mask_force_measures.png
Description

AnnotatorJ is a Fiji Plugin to ease annotation of images, particulrly useful for Deep Learning or to validate an alogorithm. Interestingly, it allows annotation for instance segmentation, semantic segmentation, or bounding box annotations. It includes toolssuch as active contours to ease these annotations.

has topic
has function
annotatorJ
Description

The tool exports rectangular regions, defined with the NDP.view 2 software (hammatsu) from the highest resolution version of the ndpi-images and saves them as tif-files.

Click the button and select the input folder. The input folder must contain pairs of ndpi and ndpa files. The regions will be exported to a subfolder of the input folder names zones.

has topic
has function
imagej toolset to export regions from ndpi and ndpa-files
Description

Phindr3D is a comprehensive shallow-learning framework for automated quantitative phenotyping of three-dimensional (3D) high content screening image data using unsupervised data-driven voxel-based feature learning, which enables computationally facile classification, clustering and data visualization.

Please see our GitHub page and the original publication for details.

Description

This Fiji plugin is a python script for CLEM registration using deep learning, but it could be applied in principle to other modalities. The pretrained model was learned on chromatin SEM images and fluorescent staining, but a script is also provided to train an new model, based on CSBDeep. The registration is then performed as a feature based registration, using register virtual stack plugin (which extract features and then perform RANSAc. Editing the script in python gives access to more option (such as the transformation model to be used, similarity by default. Images need to be prepared such that they contain only one channel, but channel of ineterst (to be transformed with the same transformation) can be given as input, and Transform Virtual Stack plugin can be used as well.

F1000R Figure 1 DeepCLEM
Description

The tool allows to measure the area of the invading spheroïd in a 3D cell invasion assay. It can also count and measure the area of the nuclei within the spheroïd.

need a thumbnail
Description

This tool allows to analyze morphological characteristics of complex roots. While for young roots the root system architecture can be analyzed automatically, this is often not possible for more developed roots. The tool is inspired by the Sholl analysis used in neuronal studies. The tool creates a binary mask and the Euclidean Distance Transform from the input image. It then allows to draw concentric circles around a base point and to extract measures on or within the circles. Instead of circles, which present the distance from the base point, horizontal lines can be used, which present the distance in the soil from the base-line. The following features are currently implemented:

  • The area of the root per distance/depth.
  • The number of border pixel per distance/depth, giving an idea of the surface in contact with the soil.
  • The maximum radius per distance/depth of a root, measured at the crossing points with the circles or lines.
  • The number of crossings of roots with the circles or lines.
  • The maximum distance to the left and the right from the vertical axis at crossing points with the circles or lines.
Concentric circles on the mask of a root, created by the Analyze Complex Roots Tool
Description

Local Z Projector is an ImageJ2 plugin, available in Fiji, that can perform local-Z projection of a 3D stack, possibly over time, possibly very large.

LZP performs projection of a surface of interest on a 2D plane from a 3D image. It is a simple tool that focuses on usability and is designed to be adaptable to many different use cases and image quality.

  • It can work with 3D movies over time with multiple channels.
  • It can work with images much larger than available RAM out of the box.
  • It takes advantage of computers with multiple cores, and can be used in scripts.


has function
Description

webKnossos is an open-source data sharing and annotation platform for tera-scale 2D and 3D image datasets.

The core features of webKnossos are:

  • fast 3D data streaming
  • share links to specific locations in the data
  • uniquely fast skeleton annotation (flight mode) and
  • efficient volume annotation
  • mesh rendering
  • collaboration and sharing tools

webKnossos facilitates image analysis workflows on multi-terabyte datasets, including visualization of raw and multi-modal microscopy data, distributed training data generation and proof-reading of automatic segmentation.

As a scientific resource, webknossos.org serves as a database for published image datasets including their annotations.


Viv

Description

Viv is a JavaScript library providing utilities for rendering primary imaging data. Viv supports WebGL-based multi-channel rendering of both pyramidal and non-pyramidal images. The rendering components of Viv are provided as Deck.gl layers, facilitating image composition with existing layers and updating rendering properties within a reactive paradigm.

Rendering a pyramidal, multiplexed immunofluorescence OME-TIFF image of a human kidney using additive blending to render four image channels into a single RGB image in the client.
Description
has function
Description

QuantiFish is a quantification program intended for measuring fluorescence in images of zebrafish, although use with images of other specimens is possible. This package is geared towards analysis of fluorescent infection models. The software is designed to automate processing of images of single fish, and outputs results as a .csv file. Alongside measures of total fluorescence above a threshold, this package also introduces several measures for dissemination and distribution of fluorescence throughout the specimen.

QuantiFish User Interface
Description

Histology Topography Cytometry Analysis Toolbox (histoCAT) is a package to visualize and analyse multiplexed image cytometry data interactively. It can also export data in.fcs data for further analysis using  a specialized cytometry sofwtare such as Flowjo. 

It can be run as a compiled standalone or from matlab.

Description

Using a Hamamatsu slide scanner such as the NanoZoomer, you may end up with NDPI files that can't always be directly open in standard image analysis software such as ImageJ. NDPITools is a collection of software that can convert NDPI files to standard TIFF files, possibly cutting them into smaller JPEG or TIFF pieces that will better fit into your computer's memory. It comes with a bundle of plugins for ImageJ which enable the use of the software directly inside ImageJ with point-and-click.


has topic
has function
need a thumbnail
Description

This small plugin demonstrates the use of OpenSlide in java: it  will extract an imageJ roi drawn from the thumbnail of the whole slide image, or the full image at the desired resolution from an hammatsu NDPI file. Note that z stack are not supported by openslide (neitheir ndpiS).

has topic
has function
Description

Set of Fiji plugins facilitating the systematic manual annotation of images or image-regions. From a list of user-defined keywords, these plugins generate an easy-to-use graphical interface with buttons or checkboxes for the assignment of single or multiple pre-defined categories to full images or individual regions of interest. In addition to qualitative annotations, any quantitative measurement from the standard Fiji options can also be automatically reported. Besides the interactive user interface, keyboard shortcuts are available to speed-up the annotation process for larger datasets.

The plugins can be installed by activating the Qualitative annotations update site in Fiji.

GUI
Description

Analyze the clustering behavior of nuclei in 3D images. The centers of the nuclei are detected. The nuclei are filtered by the presence of a signal in a different channel. The clustering is done with the density based algorithm DBSCAN. The nearest neighbor distances between all nuclei and those outside and inside of the clusters are calculated.

has function
Description

The library contains several helper functions to generate MoBIE project folders and add data to it.  Itis a python library to generate data in the MoBIE data storage layout. 

For further information, look to http://biii.eu/mobie-fiji-viewer

has function
need a thumbnail
Description

MoBIE (Multimodal Big Image Data Exploration) is a framework for sharing and interactive browsing of multimodal big image data. The MoBIE Fiji viewer is based on BigDataViewer and enables browsing of MoBIE datasets. 

It is also called Platybrowser, and uses the n5 format.

Mobie
Description

ND-SAFIR is a software for denoising n-dimentionnal images especially dedicated to microscopy image sequence analysis. It is able to deal with 2D, 3D, 2D+time, 3D+time images have one or more color channel. It is adapted to Gaussian and Poisson-Gaussian noise which are usually encountered in photonic imaging. Several papers describe the detail of the method used in ndsafir to recover noise free images (see references).

It is available either in Metamorph (commercial version), either as command line tool. Source are available on demand.

has function
Description

Deep learning based image restoration methods have recently been made available to restore images from under-exposed imaging conditions, increase spatio-temporal resolution (CARE) or self-supervised image denoising (Noise2Void). These powerful methods outperform conventional state-of-the-art methods and leverage down-stream analyses significantly such as segmentation and quantification.

To bring these new tools to a broader platform in the image analysis community, we developed a simple Jupyter based graphical user interface for CARE and Noise2Void, which lowers the burden for non-programmers and biologists to access these powerful methods in their daily routine.  CARE-less supports temporal, multi-channel image and volumetric data and many file formats by using the bioformats library. The user is guided through the different computation steps via inline documentation. For standard use cases, the graphical user interface exposes the most relevant parameters such as patch size and number of training iterations, while expert users still have access to advanced parameters such as U-net depth and kernel sizes. In addition, CARE-less provides visual outputs for training convergence and restoration quality. Any project settings can be stored and reused from command line for processing on compute clusters. The generated output files preserve important meta-data such as pixel sizes, axial spacing and time intervals.

need a thumbnail
Description

The ImageM application proposes an integrated user interface that facilitates the processing and the analysis of multi-dimensional images within the Matlab environment. It provides a user-friendly visualization of multi-dimensional images, a collection of image processing algorithms and methods for analysis of images, the management of spatial calibration, and facilities for the analysis of multi-variate images. Its graphical user interface is largely inspired from the open source software "ImageJ". ImageM can also be run on the open source alternative software to Matlab, Octave.

ImageM is freely distributed on GitHub: https://github.com/mattools/ImageM.

Processing of a 3D image with the ImageM sotfware
Description

This tool allows the user to define structures of interest by interactively marking a subset of pixels. Thanks to the real-time feedback, the user can place new markings strategically, depending on the current outcome.

Description

LOBSTER (Little Objects Segmentation and Tracking Environment), an environment designed to help scientists design and customize image analysis workflows to accurately characterize biological objects from a broad range of fluorescence microscopy images, including large images, i.e. terabytes of data, exceeding workstation main memory.

  • 75 workflows available 
  • no programming, with GUI
  • matlab based 
Description

This is the ImageJ/Fiji plugin for StarDist, a cell/nuclei detection method for microscopy images with star-convex shape priors ( typically for Dapi like staining of nuclei). The plugin can be used to apply already trained models to new images.

Stardist
Description

Summary

Deep learning-based segmentation of cells, both fluorescence, and bright-field images ("a generalist algorithm for cellular segmentation"). The tool can be used either online or local or via notebooks (e.g. ZeroCostDL4Mic).

How to use it

cellpose can be used online via ready-to-use Jyupyter notebooks with very good documentation. These notebooks are listed here.

Local Installation

The general local installation procedure can be found here.

... Installing to Silicon Mac (M1 processor) needs some tricks, and as of October 2021, the following sequence of commands works. numba should be conda-installed before pip-installing the cellpose.


conda create --name cellpose python=3.8
conda activate cellpose
conda install numba
git clone https://github.com/MouseLand/cellpose.git
cd cellpose
pip install -e .

has topic
has function
Description

DeepImageJ is a user-friendly plugin that enables the use of a variety of pre-trained deep learning models in ImageJ and Fiji. The plugin bridges the gap between deep learning and standard life-science applications. DeepImageJ runs image-to-image operations on a standard CPU-based computer and does not require any deep learning expertise.

Training developper constructs and upload trained model, and made them available to users.

Models are available in a repository here.

It is macro recordable. It is advised to use DeepImageJ on a computer with GPU (CPU will likely be 20x slower)

has topic
deepImageJ
Description

A MATLAB Package of Iterative Regularization Methods and Test Problems for Linear Inverse Problems (for Matlab Version 9.3 or later).

need a thumbnail
Description

The Morphonet Python API provide an easy interface to interact directly with the MorphoNet server. Very useful to upload, download your dataset and superimpose on it any quantitative and quantitative informations.

Description

MorphoNet is a novel concept of web-based morphodynamic browser to visualise and interact with complex datasets, with applications in research and teaching. 

MorphoNet offers a comprehensive palette of interactions to explore the structure, dynamics and variability of biological shapes and its connection to genetic expressions. 

By handling a broad range of natural or simulated morphological data, it fills a gap which has until now limited the quantitative understanding of morphodynamics and its genetic underpinnings by contributing to the creation of ever-growing morphological atlases.

Description

VAST (Volume Annotation and Segmentation Tool) is a utility application for manual annotation of large EM stacks.

General labeling tool, used for a large variety of 3D data sets; electron-microscopic, multi-channel light-microscopic, and Micro-CT data sets as well as videos, and annotating arbitrary structures, regions and locations, depending on the user’s needs.

Description

Vaa3d BJUT Fast Marching Spanning Tree algorithm dockerised workflow for BIAFLOWS

need a thumbnail
Description

Blood vessels tracing in 3D image from 3D Gaussian blurring (user defined radius), local thresholding (user defined radius and offset) and 3D skeletonization. Dockerized version for BIAFLOWS,

need a thumbnail
Description

Blood vessels tracing in 3D image from Tubeness filtering (user defined scale), 3D opening (radius set to 2), thresholding (user defined level) and 3D skeletonization.

need a thumbnail
Description

3D Neuron Tracing with a Dockerized version of Vaa3D MOST Raytracer.

need a thumbnail
Description

3D Neuron Tracing using Dockerized version of Vaa3D Minimum Spanning Tree (MST).

need a thumbnail
Description

Rivuletpy dockerised workflow for BIAFLOWS.

has topic
need a thumbnail
Description

Vaa3d All-Path-Pruning 2.0 (APP2) dockerised workflow for BIAFLOWS.

need a thumbnail
Description

Cell tracking using MU-Lux-CZ algorithm. Dockerized Workflow for BIAFLOWS implemented by Martin Maska (Masaryk University).

has topic
has function
need a thumbnail
Description

Nuclei tracking in 2D time-lapse with Octave tracker (adapted from Matlab LOBSTER version).

has function
need a thumbnail
Description

Object tracking. For each time-frame, an image mask is obtained from median filtering (user defined radius), thresholding (user defined level) and hole filling. Convex objects are split apart by distance map watershed from regional intensity maxima (user defined noise tolerance), eroded (user defined radius) and analyzed as 3D particles (assuming some overlap between objects from a frame to the next frame). Finally, division events are analyzed and accounted for to relabel objects.

has function
need a thumbnail
Description

pyimagej provides a set of wrapper functions for integration between ImageJ and Python.

It also provides a high-level entry point for invoking ImageJ server APIs.

has function
need a thumbnail
Description

Track non-dividing particles in 2D time-lapse image.

has topic
has function
need a thumbnail
Description

Particle tracking in 2D time-lapse based on linking closest regional intensity minima (user defined noise tolerance) detected from Laplacian of Gaussian filtered images (user defined radius). A maximum linking distance is set (user defined).

has function
need a thumbnail
Description

Execute Nuclei Segmentation in 3D images using pixel classification with ilastik.

has topic
has function
need a thumbnail
Description

The macro will segment nuclei and separate clustered nuclei in a 3D image using a 2D Gaussian blur, followed by Thresholding, 2D hole filling and a 2D watershed. As a result an index-mask image is written for each input image.

need a thumbnail
Description

U-Net segmentation as presented in Reference Publication. The model predicts three classes: background, edge and foreground. The model was trained with Kaggle Data Science Bowl (DSB) 2018 training set.

has topic
has function
need a thumbnail
Description

Nuclei Segmentation using Deep Learning for individual cell analysis (DeepCell).

has topic
has function
need a thumbnail
Description

This plugin computes for each image element (pixel/voxel) the eigenvalues of the Hessian, which can be used for example to discriminate locally between plate-like, line-like, and blob-like image structures

need a thumbnail
Description

3D spot detection using the Determinant of Hessian (DoH) and the detection of 3D minima.

need a thumbnail
Description

Spot detection in 3D images by Wavelet Adaptive Threshold in Icy.

has function
need a thumbnail
Description

PSFj is a software tool that automatically analyses the full field-of-view (FOV) performance of a given fluorescence microscope/objective lens combination with respect to its optical resolution and chromatic aberrations. PSFj provides reporting functions to document the momentary performance of a system and it allows for the export of the obtained data, e.g. for image restoration purposes. PSFj is based on ImageJ and JAVA, and runs on Windows, Mac, and Linux PCs as a stand-alone application.

has topic
need a thumbnail
Description

Starting from image stacks, the nuclear boundary as well as nuclear bodies are segmented. As output, NucleusJ automatically measures 15 parameters quantifying shape and size of nuclei as well as intra-nuclear objects and the positioning of the objects within the nuclear volume.

has function
Description

Collection of add-ons (recipes, scripts, demos,…) that will help you improve your day-to-day use of Amira-Avizo and PerGeos Software and make you gain both time and efficiency.
Use the Search field to look for specific keywords related to your domain of interest. The different filters also help you target specific resources.

Amira logo
Description

Epina ImageLab is a Microsoft Windows-based multisensor imaging tool for processing and analyzing hyperspectral images. It is a modular system consisting of a basic engine, a graphical user interface, a chemometrics toolbox and optional user-supplied modules. It supports the most important spectroscopic imaging techniques, such as UV/Vis, infrared, Raman, THz, optical emission/absorption, and mass spectrometry. On top of that Epina ImageLab enables the user to merge hyperspectral images with maps of physical properties and conventional high-resolution color photos. 

need a thumbnail
Description

QuickFit 3 is a data evaluation software for FCS Fluorescence Correlation Spectroscopy and imagingFCS (imFCS) measurements, developed in the group B040 (Prof. Jörg Langowski) at the German Cancer Research Center (DKFZ). Actually QuickFit 3 itself is a project manager and all functionality is added as plugins. A set of tested plugins for FCS, imagingFCS and some microscopy-related image processing tasks is supplied together with the software.

has function
Description

Summary

napari is a fast, interactive, multi-dimensional image viewer for Python. It’s designed for browsing, annotating, and analyzing large multi-dimensional images. It’s built on top of Qt (for the GUI), vispy (for performant GPU-based rendering), and the scientific Python stack (e.g. numpyscipy). It includes critical viewer features out-of-the-box, such as support for large multi-dimensional data, and layering and annotation. By integrating closely with the Python ecosystem, napari can be easily coupled to leading machine learning and image analysis tools (e.g. scikit-imagescikit-learnTensorFlowPyTorch), enabling more user-friendly automated analysis.

Installation

  • The installation procedure for Silicon Mac (M1 Processor, arm64 ) requires some tricks. As of Oct 2021, this procedure by Peter Sobolewski works but:
    • For installing pyqt5, use a slightly different command `brew install PyQt@5` to install PyQt5.  


Description

OligoMacro Toolset, is an ImageJ macro-toolset aimed at isolating oligodendrocytes from wide-field images, tracking isolated cells, characterizing processes morphology along time, outputting numerical data and plotting them. It takes benefit of ImageJ built-in functions to process images and extract data, and relies on the R software in order to generate graphs.

need a thumbnail
Description

Wavelet Toolbox™ provides apps and functions for the time-frequency analysis of signals and multiscale analysis of images.

need a thumbnail
Description

ASAP allows to automatically detect, classify and quantify structures acquired by super resolution microscopy. 

Description

This plugin ships automated methods for extracting trajectories of multiples objects in a sequence of 2D or 3D images. Up to version 2 it was known as the ‘Probabilistic particle tracker’ plugin.

need a thumbnail
Description

Align two images using intensity correlation, feature matching, or control point mapping

Together, Image Processing Toolbox™ and Computer Vision Toolbox™ offer four image registration solutions: interactive registration with a Registration Estimator app, intensity-based automatic image registration, control point registration, and automated feature matching. 

has topic
need a thumbnail
Description

Wolfram Mathematica (usually termed Mathematica) is a modern technical computing system spanning most areas of technical computing — including neural networksmachine learningimage processinggeometrydata sciencevisualizations, and others. The system is used in many technical, scientific, engineering, mathematical, and computing fields.

Description

LBADSA is based on the fitting of the Young-Laplace equation to the image data to measure drops.

has function
Description

DropSnake is based on B-spline snakes (active contours) to shape and measure a drop.

has function
Description

FastSME: Faster and Smoother Manifold Extraction From 3D Stack.

3D image stacks are routinely acquired to capture data that lie on undulating 3D manifolds yet processed in 2D by biologists. Algorithms to reconstruct the specimen morphology into a 2D representation from the 3D image volume are employed in such scenarios. In this paper, we present FastSME, which offers several improvements on the baseline SME algorithm which enables accurate 2D representation of data on a manifold from 3D volumes, however is computationally expensive. The improvements are achieved in terms of processing speed (3X-10X speed-up depending on image size), minimizing sensitivity to initialization, and also increases local smoothness of the recovered manifold resulting in better reconstructed 2D composite image. We compare the proposed FastSME against the baseline SME as well as other accessible state-of-the-art tools on synthetic and real microscopy data. Our evaluation on multiple metrics demonstrates the efficiency of the presented method in maintaining fidelity of manifold shape and hence specimen morphology.

has topic
has function

SME

Description

Smooth 2D Manifold Extraction (SME).

Three-dimensional fluorescence microscopy followed by image processing is routinely used to study biological objects at various scales such as cells and tissue. However, maximum intensity projection, the most broadly used rendering tool, extracts a discontinuous layer of voxels, obliviously creating important artifacts and possibly misleading interpretation. Here we propose smooth manifold extraction, an algorithm that produces a continuous focused 2D extraction from a 3D volume, hence preserving local spatial relationships. We demonstrate the usefulness of our approach by applying it to various biological applications using confocal and wide-field microscopy 3D image stacks. We provide a parameter-free ImageJ/Fiji plugin that allows 2D visualization and interpretation of 3D image stacks with maximum accuracy.

has topic
has function
SME
Description

The research goal of this paper was to provide unbiased counts of labeled astrocytes and to estimate the area they cover, further to develop tools for defining the orientation of coupling within astrocyte networks under different stimuli.

In order to count the astrocytes and estimate the area they cover the following steps were used in this software.

Pre-processing: z-project (using max intensity); split channels; subtract background; remove outliers.

Segmentation: adjust threshold and convert to a binary file; Watershed.

Cell counting: Analyze particles

Measure Astrocytic network area: select a ROI using the polygon tool; set measurements (area); ROI manager -> add the traced polygon; measure.

need a thumbnail
Description
Description

Protein array is used to analyze protein expressions by screening simultaneously several protein-molecule interactions such as protein-protein and protein-DNA interactions. In most cases, the detection of interactions leads to an image containing numerous lines of spots that will be analyzed by comparing tables of intensity values. To describe the observed different patterns of expression, users generally show histograms with the original associated images [1]. The “Protein Array Analyzer” gives a friendly way to exploit this type of analysis, thus allowing quantification, image modeling and comparative analysis of patterns.

The Protein Array Analyzer, which was programmed in ImageJ’s macro language, is an extention of the Dot Blot Analyzer, [2], [3] a graphically interfaced tool that greatly simplifying analysis of dot arrays.

Description

Multi-template matching can be used to localize multiple objects using one or a set of template images.

Contrary to previous implementations that allow to use only one template, here a set of templates can be used or the initial template(s) can be transformed by rotation/flipping.

Multiple objects detection without redundant detections is possible thanks to a Non-Maxima Supression relying on the degree of overlap between detections.

The solution is available as a Fiji plugin (Multi-Template Matching AND IJ-OpenCV update sites), as a Python package (Multi-Template-Matching on PyPI) and as a KNIME workflow (via KNIME Hub).

need a thumbnail
Description
has function
Description

Fiji plugin for detecting, tracking and quantifying filopodia

Description

CellProfiler Analyst (CPA) allows interactive exploration and analysis of data, particularly from high-throughput, image-based experiments. Included is a supervised machine learning system which can be trained to recognize complicated and subtle phenotypes, for automatic scoring of millions of cells. CPA provides tools for exploring and analyzing multidimensional data, particularly data from high-throughput, image-based experiments analyzed by its companion image analysis software, CellProfiler.

CPA
Description

The Image Data Explorer is a Shiny app that allows the interactive visualization of images and ROIs associated with data points shown in a scatter plot. It is useful for exploring the relationships between images/ROIs and associated data represented in tabular format. Additional functionalities include data annotation, dimensionality reduction and classification and feature selection.

has function
Description

A command line tool that allows to quantitatively compare two volumes of binary segmentations. Implements 22 different metrics for comparing segmentations such as Dice Coefficient, Hausdorff Distance and average Distance. 

Description
has function
Description

This python toolbox performs registration between 2-D microscopy images from the same tissue section or serial sections in several ways to achieve imaging mass spectrometry (IMS) experimental goals.

This code supports the following works and enables others to perform the workflows outlined in the following works, please cite them if you use this toolbox:

  • Advanced Registration and Analysis of MALDI Imaging Mass Spectrometry Measurements through Autofluorescence Microscopy10.1021/acs.analchem.8b02884

  • Next Generation Histology-directed Imaging Mass Spectrometry Driven by Autofluorescence Microscopy10.1021/acs.analchem.8b02885

need a thumbnail
Description

NEUBIAS-WG5 workflow for nuclei segmentation using ilastik v1.3.2 and Python post-processing.

has topic
has function
need a thumbnail
Description

This is an implementation of Mask R-CNN on Python 3, Keras, and TensorFlow. The model generates bounding boxes and segmentation masks for each instance of an object in the image. It's based on Feature Pyramid Network (FPN) and a ResNet101 backbone.

Description

NEUBIAS-WG5 workflow for nuclei segmentation using Mask-RCNN. The workflow uses Matterport Mask-RCNN. Keras implementation. The model was trained with Kaggle 2018 Data Science Bowl images.

has topic
need a thumbnail
Description

This workflow predict landmark positions on images by using DMBL landmark detection models.

has topic
has function
need a thumbnail
Description

An implementation of Belief Propagation for factor graphs, also known as the sum-product algorithm

has topic
need a thumbnail
Description

This workflow trains DMBL landmark detection models from a dataset of annotated images.

has function
need a thumbnail
Description

This workflow predict landmark positions on images by using LC landmark detection models.

has topic
has function
need a thumbnail
Description

This workflow trains LC landmark detection models from a dataset of annotated images.

has topic
has function
need a thumbnail
Description

This workflow predict landmark positions on images by using MSET landmark detection models.

has topic
has function
need a thumbnail
Description

This workflow trains MSET landmark detection models from a dataset of annotated images.

has topic
has function
need a thumbnail
Description

This is a (Cython-based) Python wrapper for Philipp Krähenbühl's Fully-Connected CRFs (version 2).

need a thumbnail
Description

PyTorch is an open-source machine learning library for Python, based on Torch, used for applications such as natural language processing.

has topic
has function
Description

This workflow segments glands from H&E stained histopathological images
from the Gland Segmentation Challenge (GlaS2015) using deep learning (UNet).
UNet implementation largely inspired from PyTorch-UNet by Milesial. 

need a thumbnail
Description

ImageJ/FIJI plugin generating contour lines with equal spacing on top of an image (using overlay).

Description

BIRL stands for "Benchmark on Image Registration methods with Landmark validation". BIRL is a cross-platform framework for comparison of image registration methods with landmark validation (registration precision is measured by user landmarks). The project contains a set of sample images with related landmark annotations and experimental evaluation of state-of-the-art image registration methods.

Some key features of the framework:

  • automatic execution of image registration of a sequence of image pairs
  • integrated evaluation of registration performances using Target Registration Error (TRE)
  • integrated visualization of performed registration
  • running several image registration experiment in parallel
  • resuming unfinished sequence of registration benchmark
  • handling around dataset and creating own experiments
  • rerun evaluation and visualisation for finished experiments
has topic
has function
Description
has topic
has function
superpixels - ROI
Description

VascuSynth is an ITK-based synthetic image generator. It synthesizes volumetric images of vascular trees and generates a .gxl file of the ground-truth tree structure. VascuSynth receives a number of .txt configuration files and is capable of generating both ground truth ('ideal') images and images with added noise. The user is capable of choosing from a set simple noise additions and artefacts.

has function
Description

This workflow processes a group of images containing cells with discernible nuclei and segments the nuclei and outputs a binary mask that show where nuclei were detected. It was developed as a test workflow for Neubias BIAFLOWS Benchmarking tool.

has function
Description

Runs fill holes operation on 3D images.

need a thumbnail
Description

This component convolves the image with maximum filter. Each voxel is set to the maximum value of its neighborhood. The neighborhood is defined by a kernel, which has a diameter of 3 voxels.

need a thumbnail
Description

This workflow processes images of cells with discernible nuclei and outputs a binary mask containing where nuclei are detected.

need a thumbnail
Description

ROI measurement plug-in for Icy.

has function
need a thumbnail
Description

This component convolves the image with minimum filter. Each voxel is set to the minimum value of its neighborhood. The neighborhood is defined by a kernel, which has a diameter of 3 voxels.

has function
need a thumbnail
Description

This workflow detects spots from a 3D image by using straightforward set of ImageJ components. It receives the Laplacian Radius and the Threshold  value s input.

has function
need a thumbnail
Description

A set of ImageJ Built-in Macro Functions used to perform operations on the ImageJ platform.

need a thumbnail
Description

This workflow detects spots in a 2D image by filtering the image by Laplacian of Gaussian (user defined radius) and detecting regional intensity minima (user defined noise tolerance).

has function
need a thumbnail
Description

Holovibes is a free software dedicated to the calculation of holograms in real-time. Input interferogram data can be grabbed from a digital camera or loaded from files recorded beforehand. Massive amounts of data can be handled robustly at high throughput, saved to disk, and visualized in real-time without any risk of frame dropping thanks to the use of several configurable input and output memory buffers.

Main features

Image acquisition from several digital cameras or from data files
Choice of hologram rendering method
Blazing-fast hologram rendering
Real-time computation of spectrograms
Hologram autofocus
Image and video post-processing
High throughput saving to disc of massive datasets
Batch recording and communication with remote instruments via GPIB

Requirements

A PC with at least 8 GB of RAM
Microsoft Windows 7/10 64-bit operating system
A NVidia graphics card (GeForce GTX 700+ series)
NVidia CUDA 9
A supported digital camera, or raw interferogram files

Use case examples

Holographic microscopy
Holographic OCT
Holographic vibrometry
Holographic angiography
Holographic plethysmography

need a thumbnail
Description

The goal of mamut2r is to imports data coming from .xml files generated with the Fiji MaMuT plugin for lineage and tracking of biological objects. {mamut2r} also allows to create lineage plots.

has function
need a thumbnail
Description

ImJoy is a plugin powered hybrid computing platform for deploying deep learning applications such as advanced image analysis tools.

ImJoy runs on mobile and desktop environment cross different operating systems, plugins can run in the browser, localhost, remote and cloud servers.

With ImJoy, delivering Deep Learning tools to the end users is simple and easy thanks to its flexible plugin system and sharable plugin URL. Developer can easily add rich and interactive web interfaces to existing Python code.

has topic
Description

Preprocessing step for high-density analysis methods in super resolution localisation microscopy: it aims at correcting artefacts due to these approaches with based on Haar Wavelet Kernel Analysis.

Description

The macro will segment nuclei and separate clustered nuclei in a 3D image using a distance transform watershed. As a result an index-mask image is written for each input image.

need a thumbnail
Description

This suite provides plugins to enhance 3D capabilities of ImageJ.

  • 3D Filters (mean, median, max, min, tophat, max local, …) and edge and symmetry filter
  • 3D Segmentation (iterative thresholding, spots segmentation, watershed, …)
    • 3D hysteresis thresholding with two thresholds (see 2D hysteresis for explanation).
    • 3D simple segmentation with thresholding to label 3D objects (similar to 3D objects counter).
    • 3D iterative thresholding (find optimal threshold for each object).
    • 3D spot segmentation with various local threshold estimations.
    • 3D Maxima Finder (with noise parameter)
    • 3D seeds-based watershed with automatic local maxima detection for seeds.
  • 3D Mathematical Morphology tools (fill holes, binary closing, distance map, …)
  • 3D RoiManager (3D display and analysis of 3D objects)
  • 3D Analysis (Geometrical measurements, Mesh measurements, Convex hull, …)
    • 3D Geometrical measurements (volume, surface, …) for each labelled object.
    • 3D Centroid, to compute centroids of labelled objects.
    • 3D Intensity measurements (mean, integrated density, …) in a opened image for each labelled object.
    • 3D Shape measurements (compactness, elongation, …) for each labelled object.
    • 3D Mesh Measurements after triangulation (see 3D Viewer for surface mesh computation).
    • 3D fitting by an ellipsoid and main direction computation (details here).
    • 3D convex hull (see http://rsbweb.nih.gov/ij/plugins/3d-convex-hull/index.html).
    • 3D Radial Distance Area Ratio (RDAR)
    • 3D Density, to compute density of dots, based on closest distance analysis (details here).
  • 3D MereoTopology (Relationship between objects)
  • 3D Tools (Drawing ellipsoids and lines, cropping, …)
    • Drawing 3D line
    • Drawing 3D ellipsoids in any direction
    • Drawing in stacks as volumes
    • Drawing in 3D viewer as surfaces
need a thumbnail
Description

Performs 3D Gaussian blurring.

need a thumbnail
Description

The macro will segment nuclei and separate clustered nuclei using a binary watershed. As a result an index-mask image is written for each input image.

need a thumbnail
Description

This workflow describes a semi-automatic image segmentation procedure for 3D reconstructions of the coronary arterial tree, after which how different morphometric features are automatically extracted, including vessel lumen diameter of the three main coronaries.

Description

CRImage a package to classify cells and calculate tumour cellularity

CRImage provides functionality to process and analyze images, in particular to classify cells in biological images. Furthermore, in the context of tumor images, it provides functionality to calculate tumour cellularity.

has function
Description

CLIJ2 is a GPU-accelerated image processing library for ImageJ/FijiIcy, Matlab and Java. It comes with hundreds of operations for filteringbinarizinglabelingmeasuring in images, projectionstransformations and mathematical operations for images. While most of these are classical image processing operations, CLIJ2 also allows performing operations on matrices potentially representing neighborhood relationships between cells and pixels.

CLIJ2 was developed to process images from fluorescence microscopy data of developing cells, tissues, organoids and organisms.

Description

Image correction software for chromatic shifts in fluorescence microscopy

null
Description

Daybook 2 is the analysis software linked to argoligth slides. It tests the performance of microscopes on various levels: illumination homogeneity, field distortion, lateral resolving power, stage drift, chromatic aberrations, intensity response... It works with various file formats but requires the use of an argolight test slide. 

Description

Assess the performance of the lasers, the objective lenses and other key components required for optimum confocal operation.

need a thumbnail
Description

The macro generates orthogonal projections from bead images along the lateral and axial dimensions which are displayed using a customized look-up-table to color code intensities. A Gaussian curve is fit to the intensity profile of a fluorescent bead image and full-with-at-half-maximum (FWHM) values are extracted, and listed next to theoretical values for comparison. 

Description

This plugin allows measuring relevant parameters which helps testing, following and comparing microscopes performances. This is achieved by extracting four indicators out of standardized images, acquired from standardized samples: the estimation of the detector sensitivity, the evaluation of the field illumination homogeneity, the system resolution, and finally the characterization of its spectral registration.

has function
has function
need a thumbnail
Description

Spimagine is a python package to interactively visualize and process time lapsed volumetric data as generated with modern light sheet microscopes (hence the Spim part). The package provides a generic 3D+t data viewer and makes use of GPU acceleration via OpenCL. If provides further an image processor interface for the GPU accelerated denoising and deconvolution methods of gputools.

It is only for display (no analysis). The only drawback: it does not handle multichannel time lapse 3D data (only one channel at a time).

has function
Spimagine
Description

TEM ExosomeAnalyzer is a program for automatic and semi-automatic detection of extracellular vesicles (EVs), such as exosomes, or similar objects in 2D images from transmission electron microscopy (TEM). The program detects the EVs, finds their boundaries, and reports information about their size and shape.

The software has been developed in terms of project MUNI/M/1050/2013 and supported by Grant Agency of Masaryk University.

The EVs are detected based on the shape and edge contrast criteria. The exact shapes of the EVs are then segmented using a watershed-based approach.

With proper parameter settings, even images with EVs both lighter and darked than the background, or containing artifacts or precipitated stain can be processed. If the fully-automatic processing fails to produce the correct results, the program can be used semi-automatically, letting the user adjust the detection seeds during the intermediate steps, or even draw the whole segmentation manually.

screen capture from exosomeAnalyzer
Description

It is an interactive front-end visualization for registration software based on Elasix (VTK/ITK)

has topic
need a thumbnail
Description

Ensemble of blocks that implement SODA method for confocal and super-resolution microscopy, in 2 and 3 dimensions

Icy SODA logo
Description

There are many methods in bio-imaging that can be parametrized. This gives more flexibility
to the user as long as tools provide easy support for tuning parameters. On the other hand, the
datasets of interest constantly grow which creates the need to process them in bulk. Again,
this requires proper tool support, if biologist is going to be able to organize such bulk
processing in an ad-hoc manner without the help of a programmer. Finally, new image
analysis algorithms are being constantly created and updated. Yet, lots of work is necessary to
extend a prototype implementation into product for the users. Therefore, there is a growing
need for software with a graphical user interface (GUI) that makes the process of image
analysis easier to perform and at the same time allows for high throughput analysis of raw
data using batch processing and novel algorithms. Main program in this area are written in
Java, but Python grow in bioinformatics and will be nice to allow easy wrap algorithm written
in this language.
Here we present PartSeg, a comprehensive software package implementing several image
processing algorithms that can be used for analysis of microscopic 3D images. Its user
interface has been crafted to speed up workflow of processing datasets in bulk and to allow
for easy modification of algorithm’s parameters. In PartSeg we also include the first public
implementation of Multi-scale Opening algorithm descibed in [1]. PartSeg allows for
segmentation in 3D based on finding connected components. The segmentation results can be
corrected manually to adjust for high noise in the data. Then, it is possible to calculate some
standard statistics like volume, mass, diameter and their user-defined combinations for the
results of the segmentation. Finally, it is possible to superimpose segmented structures using
weighted PCA method. Conclusions: PartSeg is a comprehensive and flexible software
dedicated to help biologists in processing, segmentation, visualization and the analysis of the
large microscopic 3D image data. PartSeg provides well established algorithms in an easy-touse,
intuitive, user-friendly toolbox without sacrificing their power and flexibility.


Examples include Chromosome territory analysis.

PartSeg
Description

AssayScope is an intuitive application dedicated to large scale image processing and data analysis. It is meant for histology, cell culture (2D, 3D, 2D+t) and phenotypic analysis. 

need a thumbnail
Description

The Allen Cell Structure Segmenter is a Python-based open source toolkit developed at the Allen Institute for Cell Science for 3D segmentation of intracellular structures in fluorescence microscope images.

It consists of two complementary elements:

  1. Classic image segmentation workflows for 20 distinct intracellular structure localization patterns. A visual “lookup table” is outlining the modular algorithmic steps for each segmentation workflow. This provides an intuitive guide for selection or construction of new segmentation workflows for a user’s particular segmentation task. 
  2. Human-in-the-loop iterative deep learning segmentation workflow trained on ground truth manually curated data from the images segmented with the segmentation workflow. Importantly, this module was not released yet.


The Allen Cell Structure Segmenter Overview
Description

DeconvolutionLab2 includes a friendly user interface to run the following deconvolution algortihms: Regularized Inverse Filter, Tikhonov Inverse Filter, Naive Inverse Filter, Richardson-Lucy, Richardson-Lucy Total Variation, Landweber (Linear Least Squares), Non-negative Least Squares, Bounded-Variable Least Squares, Van Cittert, Tikhonov-Miller, Iterative Constraint Tikhonov-Miller, FISTA, ISTA.

The backbone of our software architecture is a library that contains the number-crunching elements of the deconvolution task. It includes the tool for a complete validation pipeline. Inquisitive minds inclined to peruse the code will find it fosters the understanding of deconvolution.

has topic
has function
Description

quote: 

GaussFit_OnSpot is an ImageJ plugin for fitting Gaussian profiles onto selected positions in diffraction-limited images (e.g. single molecules, protein clusters, vesicles, or stars).

The plugin performs a function fit in regions of interest (ROI) around spots marked by point selections in grayscale images. Single or multiple spots can be either selected manually with the Multi-point tool or automatically with the Find Maxima function.

There is a PDF with more information, and also an example image.

has function
Description

"PTA2 is an ImageJ1.x plugins that enable automatic particle tracking"

This plugin is developed specifically for single-molecule imaging, so it's good at tracking spots with noisy background. 

has function
Description

"The Microscope Image Analysis Toolbox MiToBo is an extension for the widely used image processing application ImageJ and its new release ImageJ 2.0.
MiToBo ships with a set of operators ready to be used as plugins in ImageJ. They focus on the analysis of biomedical images acquired by various types of microscopes."

Description

Nessys: Nuclear Envelope Segmentation System


Nessys is a software written in Java for the automated identification of cell nuclei in biological images (3D + time). It is designed to perform well in complex samples, i.e when cells are particularly crowded and heterogeneous such as in embryos or in 3D cell cultures. Nessys is also fast and will work on large images which do not fit in memory.


Nessys also offers an interactive user interface for the curation and validation of segmentation results. Think of this as a 3D painter / editor. This editor can also be used to generate manually segmented images to use as ground truth for testing the accuracy of the automated segmentation method.


Finally Nessys, contains a utility for assessing the accuracy of the automated segmentation method. It works by comparing the result of the automated method to a manually generated ground truth. This utility will provide two types of output: a table with a number of metrics about the accuracy and an image representing a map of the mismatch between the result of the automated method and the ground truth.

has function
Description

FluoRender is an interactive rendering tool for confocal microscopy data visualization. It combines the rendering of multi-channel volume data and polygon mesh data, where the properties of each dataset can be adjusted independently and quickly. The tool is designed especially for neurobiologists, allowing them to better visualize confocal data from fluorescently-stained brains, but it is also useful for other biological samples.

FluoRenderer
Description

3Dscript is a plugin for Fiji/ImageJ for creating 3D and 4D animations of microscope data. In contrast to existing 3D visualization packages, animations are not keyframe-based, but are described by a natural language-based syntax.

Description

Labkit is an open-source tool to segment truly large image data using sparse training data. It has an intuitive and responsive user interface based on Big Data Viewer, allowing users to conveniently browse and annotate even terabyte sized image volumes.

Update site: Labkit

has topic
need a thumbnail
Description

SciView is an ImageJ/FIJI plugin for 3D visualization of images and meshes. It uses the Scenery and ClearVolume infrastructure. SciView integrates ImageJ2 functionality, including ImageJ Ops and ImageJ Mesh, to provide the ability to interact with image and mesh data in 3D and interface with the popular Fiji software ecosystem.

An update site is available: http://sites.imagej.net/SciView/

has function
null
Description

NanoJ-SQUIRREL (Super-resolution Quantitative Image Rating and Reporting of Error Locations) is a software package designed for assessing and mapping errors and artefacts within super-resolution images. This is achieved through quantitative comparison with a reference image of the same structure (typically a widefield, TIRF or confocal image). SQUIRREL produces quantitative maps of image quality and resolution as well as global image quality metrics.

has function
SQUIRREL
Description

InspectJ is a free ImageJ/FIJI tool to inspect digital image integrity.

InspectJ_v2 is a newer version for advanced users. It applies additional features like histogram equalization and gamma correction for improved image inspections.

need a thumbnail
Description

Apache Maven is a software project management and comprehension tool. Based on the concept of a project object model (POM), Maven can manage a project's build, reporting and documentation from a central piece of information.

need a thumbnail
Description

Paintera is a general visualization tool for 3D volumetric data and proof-reading in segmentation/reconstruction with a primary focus on neuron reconstruction from electron micrographs in connectomics. It features/supports:

  •  Views of orthogonal 2D cross-sections of the data at arbitrary angles and zoom levels
  •  Mipmaps for efficient display of arbitrarily large data at arbitrary scale levels
  •  Label data
    •  Painting
    •  Manual agglomeration
    •  3D visualization as polygon meshes
      •  Meshes for each mipmap level
      •  Mesh generation on-the-fly via marching cubes to incorporate painted labels and agglomerations in 3D visualization. Marching Cubes is parallelized over small blocks. Only relevant blocks are considered (huge speed-up for sparse label data).

Paintera is implemented in Java and makes extensive use of the UI framework JavaFX

Paintera screenshot
Description

shinyHTM is an open source, web-based tool for data exploration, image visualization and normalization of High Throughput Microscopy data. Within shinyHTM the user is guided through a linear workflow which follows the following best practices:

  • Inspect the numerical data through plotting
  • Measurements are linked to raw images
  • Perform quality control to exclude images with aberrations or where image analysis failed
  • Perform a reproducible data analysis
  • Normalize data and report statistical significance

Image visualization relies on Fiji/ImageJ, along with its wealth of analytical tools.

shinyHTM can be used to analyze image features obtained with CellProfiler, ImageJ or any other bioimage analysis software. The output of analysis is a publication-ready scoring of the data.

shinyHTM is based on the R shiny package.

shinyHTM
Description

The Topology ToolKit (TTK) is an open-source library and software collection for topological data analysis in scientific visualization.

TTK can handle scalar data defined either on regular grids or triangulations, either in 2D or in 3D. It provides a substantial collection of generic, efficient and robust implementations of key algorithms in topological data analysis. It includes:
 · For scalar data: critical points, integral lines, persistence diagrams, persistence curves, merge trees, contour trees, Morse-Smale complexes, topological simplification;
 · For bivariate scalar data: fibers, fiber surfaces, continuous scatterplots, Jacobi sets, Reeb spaces;
 · For uncertain scalar data: mandatory critical points;
 · For time-varying scalar data: critical point tracking;
 · For high-dimensional / point cloud data: dimension reduction;
 · and more!


TTK makes topological data analysis accessible to end users thanks to easy-to-use plugins for the visualization front end ParaView. Thanks to ParaView, TTK supports a variety of input data formats.
 

TTK is written in C++ but comes with a variety of bindings (VTK/C++, Python) and standalone command-line programs. It is modular and easy to extend. We have specifically developed it such that you can easily write your own data analysis tools as TTK modules.

has topic
ttk
Description

ParaView is an open-source, multi-platform data analysis and visualization application. ParaView users can quickly build visualizations to analyze their data using qualitative and quantitative techniques. The data exploration can be done interactively in 3D or programmatically using ParaView’s batch processing capabilities.

ParaView was developed to analyze extremely large datasets using distributed memory computing resources. It can be run on supercomputers to analyze datasets of petascale size as well as on laptops for smaller data, has become an integral tool in many national laboratories, universities and industry, and has won several awards related to high performance computation.

paraviewbloodcells
Description

OpenCV (Open Computer Vision) library for Icy. see more at http://opencv.org

has function
need a thumbnail
Description

Blender is the free and open source 3D creation suite. It supports the entirety of the 3D pipeline—modeling, rigging, animation, simulation, rendering, compositing and motion tracking, even video editing and game creation.

Description

NeuroMorph is a toolset designed to import, analyze, and visualize mesh models in Blender. It has been developed specifically for the morphological analysis of 3D objects derived from serial electron microscopy images of brain tissue, but much of its functionality can be applied to any 3D mesh. These mesh objects can be generated by any 3D image segmentation software, such as ilastik or Fiji

Description

The software FishInspector provides automatic feature detections in images of zebrafish embryos (body size, eye size, pigmentation). It is Matlab-based and provided as a Windows executable (no matlab installation needed).

The recent version requires images of a lateral position. It is important that the position is precise since deviation may confound with feature annotations. Images from any source can be used. However, depending on the image properties parameters may have to be adjusted. Furthermore, images obtained with normal microscope and not using an automated position system with embryos in glass capillaries require conversion using a KNIME workflow (the workflow is available as well). As a result of the analysis the software provides JSON files that contain the coordinates of the features. Coordinates are provided for eye, fish contour, notochord , otoliths, yolk sac, pericard and swimbladder. Furthermore, pigment cells in the notochord area are detected. Additional features can be manually annotated. It is the aim of the software to provide the coordinates, which may then be analysed subsequently to identify and quantify changes in the morphology of zebrafish embryos.

FishInspector Logo
Description

This is a classical workflow for spot detection or blob like structures (vesicules, melanosomes,...)

Step 1 Laplacian of Gaussian to enhance spots . Paraeters= radius, about the average spot radius

Step 2 Detect minima (using Find Maxima with light background option to get minima). Parameter : Tolerance to Noise: to be tested, hard to predict. About the height of the enhanced feautures peaks

has topic
has function
spot detection
Description

The best way to start writing an ImageJ2 plugin (ImageJ2 developers call it command and not plugin) is to download the example command from github and modify it. There is a video tutorial on the whole workflow on how to do this on youtube.

has function
Description

IDE for JVM

Every aspect of IntelliJ IDEA is specifically designed to maximize developer productivity. Together, the powerful static code analysis and ergonomic design make development not only productive but also an enjoyable experience.

It can be seen as an alternative to Eclipse for example for java based development. It exists in both a commercial and a free and open source version.

Description

Scikit-learn (sklearn) is a python library used for machine learning. sklearn contains simple and efficient tools for data mining and data analysis. Modules and functions include those for classification, regression, clustering, dimensionality reduction, model selection and data preprocessing. Many people have contributed to sklearn (list of authors)

has topic
scikit-learn logo.
Description

3-D density kernel estimation (DKE-3-D) method, utilises an ensemble of random decision trees for counting objects in 3D images. DKE-3-D avoids the problem of discrete object identification and segmentation, common to many existing 3-D counting techniques, and outperforms other methods when quantification of densely packed and heterogeneous objects is desired. 

Description

AutoPilot is the open source project that hosts the general algorithm for fast and robust assessment of local image quality, an automated computational method for image-based mapping of the three-dimensional light-sheet geometry inside a fluorescently labeled biological specimen, and a general algorithm for data-driven optimization of the system state of light-sheet microscopes capable of multi-color imaging with multiple illumination and detection arms.

has function
Description

This plugin detects a minimum cost z-surface in a 3D volume. A z surface is a topographic map indicating the altitude z as a function of the position (x,y) in the image. The cost of the surface depends on pixel intensity the surface is going through. This plugin find the z-surface with the lowest intensity in an image.

has function
Description

The interactive Watershed Fiji plugin provides an interactive way to explore local maxima and threshold values while a resulting label map is updated on the fly.

After the user has found a reliable parameter configuration, it is possible to apply the same parameters to other images in a headless mode, for example via ImageJ macro scripting.

Description

The Jupyter Notebook is the original web application for creating and sharing computational documents. It offers a simple, streamlined, document-centric experience.

Try Jupyter (https://try.jupyter.org) is a site for trying out the Jupyter Notebook, equipped with kernels for several different languages (Julia, R, C++, Scheme, Ruby) without installing anything. Click the link below to go to the page.

need a thumbnail
Description

Maxima finding algorithm implemented in Python recreated from implementation in Fiji(ImageJ)

This is a re-implementation of the java plugin written by Michael Schmid and Wayne Rasband for ImageJ. The original java code source can be found in: https://imagej.nih.gov/ij/developer/source/ij/plugin/filter/MaximumFinder.java.html 

This implementation remains faithful to the original implementation but is not 100% optimised. The java version is faster but this could be alleviated by compiling c code for parts of the code. This script is simply to provide the functionality of the ImageJ find maxima algorithm to individuals writing pure python script.

The algorithm works as follows:

The first stage in the maxima finding algorithm is to find the local maxima. This involves processing the image with a 3x3 neighbourhood maximum filter. Once filtered this image is compared back to the original, where the pixels are the same value represents the locations of the local maxima. Typically there are far too many local maxima to be meaningful so the goal is then to merge and prune this maxima using some kind of measure of quality. In the case of algorithm a single parameter is used, the noise tolerance (Prominence). If a maxima is close to another then the maxima will be merged or removed based on the below criteria.

Starting with the brightest maxima and working down the intensities:

  • Expand out (‘flood fill’) from each maxima location. Neighbouring pixels within a noise tolerance (notl) of the maxima are scanned until the region within tolerance is exhausted.
    • If the pixels are equal to the maxima, mark this as equal.
    • If a greater maxima is met, ignore the active maxima.
    • If the pixels are less than maxima, but greater than maxima minus the noise tolerance, mark as listed.
    • Mark all ‘listed’ pixels 'processed' if they are included within a valid peak region, otherwise reset them.
    • From the regions containing a peak, calculate the best pixel to be considered as maxima based on minimum distance calculation with all those maxima considered equal.
       

For a video detailing how this algorithm works please see:

https://youtu.be/f9vXOMKOlaY

Or for examples of it being used in practise, please see:

https://youtu.be/9wvPsEzRWzI


find maxima comparison.
Description

SIMPLETRACKER a simple particle tracking algorithm that can deal with gaps.

Tracking , or particle linking, consist in re-building the trajectories of one or several particles as they move along time. Their position is reported at each frame, but their identity is yet unknown: we do not know what particle in one frame corresponding to a particle in the previous frame. Tracking algorithms aim at providing a solution for this problem. 

simpletracker.m is - as the name says - a simple implementation of a tracking algorithm, that can deal with gaps. A gap happens when one particle that was detected in one frame is not detected in the subsequent one. If not dealt with, this generates a track break, or a gap, in the frame where the particle disappear, and a false new track in the frame where it re-appear. 

need a thumbnail
Description

FoCuS-point is stand-alone software for TCSPC correlation and analysis. FoCuS-point utilizes advanced time-correlated single-photon counting (TCSPC) correlation algorithms along with time-gated filtering and innovative data visualization. The software has been designed to be highly user-friendly and is tailored to handle batches of data with tools designed to process files in bulk. FoCuS-point also includes advanced diffusion curve fitting algorithms which allow the parameters of the correlation functions and thus the kinetics of diffusion to be established quickly and efficiently.

Description

Mean square displacement (MSD) analysis is a technique commonly used in colloidal studies and biophysics to determine what is the mode of displacement of particles followed over time. In particular, it can help determine whether the particle is:

  • freely diffusing;
  • transported;
  • bound and limited in its movement.

On top of this, it can also derive an estimate of the parameters of the movement, such as the diffusion coefficient.

@msdanalyzer is a MATLAB per-value class that helps performing this kind of analysis. The user provides several trajectories he measured, and the class can derive meaningful quantities for the determination of the movement modality, assuming that all particles follow the same movement model and sample the same environment.

has function
Examples of tracks to perform MSD analysis.
Description

FoCuS-scan is software for processing and analysis of large-scale scanning fluorescence correlation spectroscopy (FCS) data. FoCuS-scan can correlate data acquired on conventional turn-key confocal systems and in the form of xt image carpets.

Description

Biocat is a java based software that allows to perform image classification or segmentation using machine learning. Several algorithm for the classification are available.

has topic
need a thumbnail
Description

A deep-learning solution for stain color normalization in digital histology images

has function
need a thumbnail
Description

Stochastic optical reconstruction microscopy (STORM) and related methods achieves sub-diffraction-limit image resolution through sequential activation and localization of individual fluorophores. The analysis of image data from these methods has typically been confined to the sparse activation regime where the density of activated fluorophores is sufficiently low such that there is minimal overlap between the images of adjacent emitters. Recently several methods have been reported for analyzing higher density data, allowing partial overlap between adjacent emitters. However, these methods have so far been limited to two-dimensional imaging, in which the point spread function (PSF) of each emitter is assumed to be identical.

In this work, we present a method to analyze high-density super-resolution data in three dimensions, where the images of individual fluorophores not only overlap, but also have varying PSFs that depend on the z positions of the fluorophores.


need a thumbnail
Description

SimpleITK provides a simplified interface to ITK in a variety of languages. A user can either download pre-built binaries, if they are available for the desired platform and language, or SimpleITK can be built from the source code. Currently, Python binaries are available on Microsoft Windows, GNU Linux and Mac OS X. C# and Java binaries are available for Windows. We are also working towards supporting R packaging.

need a thumbnail
Description

ZEN and APEER – Open Ecosystem for integrated Machine-Learning Workflows

Open ecosystem for integrated machine-learning workflows to train and use machine-learning models for image processing and image analysis inside the ZEN software or on the APEER cloud-based platform

Highlights ZEN

  • Simple User Interface for Labeling and Training
  • Engineered Features Sets and Deep Feature Extraction + Random Forrest for Semantic Segmentation
  • Object Classification workflows
  • Probability Thresholds and Conditional Random Fields
  • Import your own trained models as *.czann files (see: czmodel · PyPI)
  • Import "AIModel Containes" from arivis AI for advanced Instance Segmentation
  • Integration into ZEN Measurement Framework
  • Support for Multi-dimensional Datasets and Tile Images
  • open and standardized format to store trained models
ZEN Intellesis Segmentation

ZEN Intellesis Segmentation - Training UI

ZEN Intellesis - Pretrained Networks

ZEN Intellesis Segmentation - Use Deep Neural Networks

Intellesis Object Classification

ZEN Object Classification

Highlights Aarivis AI

  • Web-based tool to label datasets to train Deep Neural Networks
  • Fully automated hyper-parameter tuning
  • Export of trained models for semantic segmentation and AIModelContainer for Instance Segmentation
Annotation Tool

APEER Annotation Tool

Description

R wrapper around the OMERO Java Gateway, to enable access to OMERO via R using rJava

has function
need a thumbnail
Description

OpenImadis stands for Open Image Discovery: A platform for Image Life Cycle Management. It was previously called CID iManage (for Curie Image Database).

No image data conversions, no duplication.

- Uploads data to a secure server in the original format

- Unique id for data

Supports sharing and collaboration with access control

- Allows users to upload, view, update or download data based on their access privileges

Supports multiple ways of attaching meta-information

- Annotations, comments and file attachments

-Analysis results as query-able visual objects

Supports Archiving (data moving to another long-term storage but still searchable)

Facilitates custom visualization and analysis

- Access data from preferred analysis and visualization tools

- Access relevant bits of data to build efficient web and mobile application

Facilitate easy access to analysis and visualization applications hosted on other servers

- Run analysis on dedicated compute clusters

- Access applications hosted and published by other users

Highly Scalable

- Supports on-the-fly addition of server nodes to scale concurrent usage


openImadis
Description

This one example workflow from the Cell Profiler(CP)  Examples . CP is commonly used to count cells or other objects as well as percent-positives, by measuring the per-cell staining intensity. This pipeline shows how to do both of these tasks, and demonstrates how various modules may be used to accomplish the same result. 

In a few words, it used the IdentifyPrimaryObject module of CellProfiler to detect nuclei from a channel (e.g DAPI), then again the same module on another channel to detect another probe (e.g some particular histone)  .

Then objects (nuclei) are related to the second object (Histone), to create a parent child-relation ship: where nuclei can have histone has child. Nuclei are then filtered according to the property of having histone (positive) or not having histone (negtiveobject) related to them.  If needed, nuclei can be expanded in order to include touching object rather than object inside only.

The percentage of positive nuclei vs total number of nuclei can then be computed using the CalculateMath Module.

Positivepercentcell
Description

This workflow can be ran with data from 3D-SIM showing the centrosomes in order to compare the distribution of diameters of rings (or toroids) of different proteins from the centrioles or the peri centriolar material. It aims to reproduce the results of the Nature Cell Biology Paper Subdiffraction imaging of centrosomes reveals higher-order organizational features of pericentriolar material  from the same data set but with a different analysis method.

It is slightly different from the methods described in the paper itself, where the method was to work on a maximum intensity projection of a 3D-SIM stack, and then to fit circle to the centrioles to estimate the diameters of the toroids.

In this workflow, the images are read from the IDR , then process by thresholding (Maximum entropy auto thresholding with Image J), and processed by Analyze Particles  with different measurement sets, including the bouding box. Then the analysis of diameters and the statistical test are performed using R. All the code and data sets are available, and in the case of this paper have shown a layered organisation of the proteins.

Combined view from Figure 1 Lawo et al.
Description

Chainer is a Python-based deep learning framework aiming at flexibility. It provides automatic differentiation APIs based on the define-by-run approach (a.k.a. dynamic computational graphs) as well as object-oriented high-level APIs to build and train neural networks. It also supports CUDA/cuDNN using CuPy for high performance training and inference. For more details of Chainer, see the documents and resources listed above and join the community in Forum, Slack, and Twitter.

has topic
Description

Python is a programming language.

Python 2.7.0 was released on July 3rd, 2010.

Python 2.7 is scheduled to be the last major version in the 2.x series before it moves into an extended maintenance period. This release contains many of the features that were first released in Python 3.1.

 A bugfix release, 2.7.16, is currently available. Its use is recommended.

need a thumbnail
Description

Quantitative Criterion Acquisition Network (QCA Net) performs instance segmentation of 3D fluorescence microscopic images. QCA Net consists of Nuclear Segmentation Network (NSN) that learned nuclear segmentation task and Nuclear Detection Network (NDN) that learned nuclear identification task. QCA Net performs instance segmentation of the time-series 3D fluorescence microscopic images at each time point, and the quantitative criteria for mouse development are extracted from the acquired time-series segmentation image. The detailed information on this program is described in our manuscript posted on bioRxiv.

has function
Description

Matplotlib is a comprehensive library for creating static, animated, and interactive visualizations in Python.

need a thumbnail
Description

Manual tracking using Trackmate plugin (comes with FIji, so no installation required if you are using Fiji). 

has function
Description
Description

This note presents the design of a scalable software package named ImagePy for analysing biological images. Our contribution is concentrated on facilitating extensibility and interoperability of the software through decoupling the data model from the user interface. Especially with assistance from the Python ecosystem, this software framework makes modern computer algorithms easier to be applied in bioimage analysis.

Description

This method was originally designed to track objects (not necessarily spots) already identified in 2D 
frames and has been applied previously to particle tracking and analysis in high-speed atomic force microscopy image series.


need a thumbnail
Description

JAMA is a basic linear algebra package for Java. It provides user-level classes for constructing and manipulating real, dense matrices. It is meant to provide sufficient functionality for routine problems, packaged in a way that is natural and understandable to non-experts. It is intended to serve as the standard matrix class for Java, and will be proposed as such to the Java Grande Forum and then to Sun. A straightforward public-domain reference implementation has been developed by the MathWorks and NIST as a strawman for such a class. We are releasing this version in order to obtain public comment. There is no guarantee that future versions of JAMA will be compatible with this one.

need a thumbnail
Description


The phase contrast microscopy segmentation toolbox (PHANTAST) is a collection of open-source algorithms and tools for the processing of phase contrast microscopy (PCM) images. It was developed at University College London's department of Biochemical Engineering and CoMPLEX.

has function
Description

An ImageJ plugin for DEFCoN, the fluorescence spot counter based on fully convolutional neural networks

has topic
Description

NumPy (Numerical Python) is an open source Python library that’s used in almost every field of science and engineering. It’s the universal standard for working with numerical data in Python, and it’s at the core of the scientific Python and PyData ecosystems. The NumPy library contains multidimensional array and matrix data structures. It provides ndarray, a homogeneous n-dimensional array object, with methods to efficiently operate on it. NumPy can be used to perform a wide variety of mathematical operations on arrays.

NumPy users include everyone from beginning coders to experienced researchers doing state-of-the-art scientific and industrial research and development. The NumPy API is used extensively in Pandas, SciPy, Matplotlib, scikit-learn, scikit-image and most other data science and scientific Python packages. 

Learn more about NumPy here!

has function
need a thumbnail
Description

SciPy is a collection of mathematical algorithms and convenience functions built on the NumPy extension of Python. It adds significant power to the interactive Python session by providing the user with high-level commands and classes for manipulating and visualizing data. With SciPy, an interactive Python session becomes a data-processing and system-prototyping environment. Find more about SciPy here!

need a thumbnail
Description

CompuCell3D is a flexible scriptable modeling environment, which allows the rapid construction of sharable Virtual Tissue in-silico simulations of a wide variety of multi-scale, multi-cellular problems including angiogenesis, bacterial colonies, cancer, developmental biology, evolution, the immune system, tissue engineering, toxicology and even non-cellular soft materials. CompuCell3D models have been used to solve basic biological problems, to develop medical therapies, to assess modes of action of toxicants and to design engineered tissues. CompuCell3D intuitive and make Virtual Tissue modeling accessible to users without extensive software development or programming experience.

It uses Cellular Potts Model to model cell behavior.

Description

Elastix is a toolbox for rigid and nonrigid registration of (medical) images.

Elastix is based on the ITK library, and provides additional algorithms for image registration. 

The software can be run as a single-line command, making it easy to include in larger scripts or workflows. The user needs to edit a configuration file that contains all relevant parameters for registration: transformation model, metric used to comapre images, optimization algorithm, mutliscale pyramidal representation of images...

Nowadays elastix is accompanied by SimpleElastix, making it available in other languages like C++, Python, Java, R, Ruby, C# and Lua.

elastix logo
Description

CaPTk is a software platform for analysis of radiographic cancer images, currently focusing on brain, breast, and lung cancer. CaPTk integrates advanced, validated tools performing various aspects of medical image analysis, that have been developed in the context of active clinical research studies and collaborations toward addressing real clinical needs. With emphasis given in its use as a very lightweight and efficient viewer, and with no prerequisites for substantial computational background, CaPTk aims to facilitate the swift translation of advanced computational algorithms into routine clinical quantification, analysis, decision making, and reporting workflow. Its long-term goal is providing widely used technology that leverages the value of advanced imaging analytics in cancer prediction, diagnosis and prognosis, as well as in better understanding the biological mechanisms of cancer development.

CaPTk
Description

NiftyNet is a TensorFlow-based open-source convolutional neural networks (CNNs) platform for research in medical image analysis and image-guided therapy. NiftyNet’s modular structure is designed for sharing networks and pre-trained models. Using this modular structure you can:

  • Get started with established pre-trained networks using built-in tools;
  • Adapt existing networks to your imaging data;
  • Quickly build new solutions to your own image analysis problems.
Description

This ParaViewWeb Docker container is used by the Galaxy Project.  Paraview is an VTK based visualization server, for 3D.

ParaViewWeb in Galaxy
Description

Image analysis tools to be used within Galaxy

has function
Galaxy imaging workflow
Description

Galaxy instance with tools for Image analyses shipped in a Docker container.

need a thumbnail
Description

Orbit Image Analysis is a free open source software with the focus to quantify big images like whole slide scans.

It can connect to image servers, e.g. Omero.
Analysis can be done on your local computer or via scaleout functionality in a distrubuted computing environment like a Spark cluster.

Sophisticated image analysis algorithms incl. tissue quantification using machine learning, object segmentation and classification are build in. In addition a versatile API allows you to enhance Orbit and to run your own scripts.

Orbit
Description
HyphaTrackerWorkflow
HyphaTracker Workflow

HyphaTracker propose a workflow for time-resolved analysis of conidia germination. Each part of this workflow can also be used independnatly , as a toolbox. It has been tested on bright-field microscopic images of conidial germination. Its purpose is mainly to identify the germlings and to remove crossing hyphae, and measure the dynamics of their growth.

hyphatracker
Description

LimeSeg: A coarsed-grained lipid membrane simulation for 3D image segmentation **Download instruction:** There is no download but you can easily install this plugin via ImageJ update site. If you really need to download the jar file, access the file in the update site repository ([Link]())

has function
Description

automated open-source image acquisition and on-the-fly analysis pipeline (initially developped for analysis of mitotic defects in fission yeast)

maars workflow from publication


maars
Description

MaMuT is an end user plugin that combines the BigDataViewer and TrackMate to provide an application that allow browsing, annotating and curating annotations for large image data.

Description

This filter uses convolution with a Gaussian function for smoothing. Sigma is the radius of decay to exp(-0.5) ~ 61%, i.e. the standard deviation sigma of the Gaussian (this is the same as in Photoshop, but different from earlier versions of ImageJ, where a value 2.5 times as much had to be entered.

Like all ImageJ convolution operations, it assumes that out-of-image pixels have a value equal to the nearest edge pixel. This gives higher weight to edge pixels than pixels inside the image, and higher weight to corner pixels than non-corner pixels at the edge. Thus, when smoothing with very high blur radius, the output will be dominated by the edge pixels and especially the corner pixels (in the extreme case, with a blur radius of e.g. 1e20, the image will be raplaced by the average of the four corner pixels).

For increased speed, except for small blur radii, the lines (rows or columns of the image) are downscaled before convolution and upscaled to their original length thereafter.

has function
Description

The purpose of the workflow is ....

First you need

need a thumbnail
Description

Drishti (from Sanskrit  word for "vision" or "insight") is a multi-platform, open-source volume-exploration and presentation tool. Written for visualizing tomography data, electron-microscopy data and the like.

Drishti
Description

  FlyLimbTracker is  a method that uses active contours to semi-automatically track body and leg segments from video image sequences of unmarked, freely behaving Drosophila flies. This approach can be used to measure leg segment motions during a variety of locomotor and grooming behaviors.

For now the plugin have to be downlaoded directly from the EPFL website (see link), not from the search bar as usual in ICY.


Drosophila track legs
Description

Classification of trajectoire: need tracking results as input and will then classify the trajectories as  brownian motion, confined brownian or directed.

has function
thot
Description

Reconstruct big images from overlapping tiled images on a Spark cluster.

The code is based on the Stitching plugin for Fiji https://github.com/fiji/Stitching

SparkStitching
Description

Working version of a simple GUI frontend for CMTK image registration tools in Fiji

need a thumbnail
Description

Estimate the positions and spacing between sections (or at local points) of three dimensional image data. This method may be applied to any imaging modality that acquires 3-dimensional data as a stack of 2-dimensional sections. We provide plugins for both Fiji and TrakEM2.

has function
Description

"An open source machine learning framework for everyone "

TensorFlow™ is an open source software library for high performance numerical computation. Its flexible architecture allows easy deployment of computation across a variety of platforms (CPUs, GPUs, TPUs), and from desktops to clusters of servers to mobile and edge devices. Originally developed by researchers and engineers from the Google Brain team within Google’s AI organization, it comes with strong support for machine learning and deep learning and the flexible numerical computation core is used across many other scientific domains.

has topic
TensorFlow
Description

Super-resolve anisotropic EM data along low-res axis with deep learning.


has function
Description

The MIPAV (Medical Image Processing, Analysis, and Visualization) application enables quantitative analysis and visualization of medical images of numerous modalities such as PET, MRI, CT, or microscopy. Using MIPAV's standard user-interface and analysis tools, researchers at remote sites (via the internet) can easily share research data and analyses, thereby enhancing their ability to research, diagnose, monitor, and treat medical disorders.

Description

Multicut workflow for large connectomics data. Using luigi for pipelining and caching processing steps. Most of the computations are done out-of-core using hdf5 as backend and implementations from nifty

Description

Luigi is a Python module that helps you build complex pipelines of batch jobs. It handles dependency resolution, workflow management, visualization etc. It also comes with Hadoop support built in.

The purpose of Luigi is to address all the plumbing typically associated with long-running batch processes. You want to chain many tasks, automate them, and failures will happen. These tasks can be anything, but are typically long running things like Hadoop jobs, dumping data to/from databases, running machine learning algorithms, or anything else.

has function
Description

ANTs computes high-dimensional mappings to capture the statistics of brain structure and function.

Image Registration

Diffeomorphisms: SyN, Independent Evaluation: Klein, Murphy, Template Construction (2004)(2010), Similarity Metrics, Multivariate registration, Multiple modality analysis and statistical bias

Image Segmentation

Atropos Multivar-EM Segmentation (link), Multi-atlas methods (link) and JLF, Bias Correction (link), DiReCT cortical thickness (link), DiReCT in chimpanzees


Advanced Normalization Tools
Description

A software toolkit for computational morphometry of biomedical images, CMTK comprises a set of command line tools and a back-end general-purpose library for processing and I/O.

The command line tools primarily provide the following functionality: registration (affine and nonrigid; single and multi-channel; pairwise and groupwise), image correction (MR bias field estimation; interleaved image artifact correction; EPI unwarping), processing (filters; combination of segmentations via voting and STAPLE; shape-based averaging), statistics (t-tests; general linear model).

null
Description

In light-sheet microscopy, overall image content and resolution are improved by acquiring and fusing multiple views of the sample from different directions. State-of-the-art multi-view (MV) deconvolution simultaneously fuses and deconvolves the images in 3D, but processing takes a multiple of the acquisition time and constitutes the bottleneck in the imaging pipeline. Here, we show that MV deconvolution in 3D can finally be achieved in real-time by processing cross-sectional planes individually on the massively parallel architecture of a graphics processing unit (GPU). Our approximation is valid in the typical case where the rotation axis lies in the imaging plane.

need a thumbnail
Description

This R package implements the NBLAST neuron similarity algorithm described in a preprint available at http://dx.doi.org/10.1101/006346. In addition to basic pairwise comparison, the package implements search of databases of neurons. There is also suport for all x all comparison for a group of neurons. This can produce a distance matrix suitable for hierarchical clustering, which is also implemented in the package.

has topic
has function
Description

TeraStitcher is a free tool that enables the stitching of Teravoxel-sized tiled microscopy images even on workstations with relatively limited resources of memory (<8 GB) and processing power. It exploits the knowledge of approximate tile positions and uses ad-hoc strategies and algorithms designed for such very large datasets. The produced images can be saved into a multiresolution representation to be efficiently visualized (e.g. Vaa3D-TeraFly) and processed.

Description

An R package for the (3D) visualisation and analysis of biological image data, especially tracings of single neurons. nat is the core package of a wider suite of neuroanatomy tools introduced at http://jefferislab.github.io.

has function
Description

vmtk is a collection of libraries and tools for 3D reconstruction, geometric analysis, mesh generation and surface data analysis for image-based modeling of blood vessels.

vmtk is composed of

  • C++ classes (VTK and ITK -based algorithms)
  • Python classes (high-level functionality - each class is a script)
  • PypeS - Python pipeable scripts, a framework which enables vmtk scripts to interact with each other


Description

OpenCL (Open Computing Language) is a framework for writing programs that execute across heterogeneous platforms consisting of central processing units (CPUs), graphics processing units (GPUs), digital signal processors (DSPs), field-programmable gate arrays (FPGAs) and other processors or hardware accelerators. OpenCL specifies programming languages (based on C99 and C++11) for programming these devices and application programming interfaces (APIs) to control the platform and execute programs on the compute devices. OpenCL provides a standard interface for parallel computing using task- and data-based parallelism.

OpenCL is an open standard maintained by the non-profit technology consortium Khronos Group. Conformant implementations are available from AlteraAMDAppleARMCreativeIBMImaginationIntelNvidiaQualcommSamsungVivanteXilinx, and ZiiLABS.[7][8]

Source: https://en.wikipedia.org/wiki/OpenCL

Description

Facade API on top of JOGL (http://jogamp.org/jogl/www/) offering a simple interface for creating OpenGL contexts/windows, GLSL shader programs, and textures. Use it in your favourite JVM-based language.

has function
Description

ClearVolume is a real-time live 3D visualization library designed for high-end volumetric microscopes such as SPIM and DLSM microscopes. With ClearVolume you can see live on your screen the stacks acquired by your microscope instead of waiting for offline post-processing to give you an intuitive and comprehensive view on your data. The biologists can immediately decide whether a sample is worth imaging. ClearVolume can easily be integrated into existing Java, C/C++, Python, or LabVIEW based microscope software. It has a dedicated interface to MicroManager/OpenSpim/OpenSpin control software. ClearVolume supports multi-channels, live 3D data streaming from remote microscopes, and uses a multi-pass Fibonacci rendering algorithm that can handle large volumes. Moreover, ClearVolume is integrated into the Fiji/ImageJ2/KNIME ecosystem. You can now open your stacks with ClearVolume from within these popular frameworks for offline viewing.

has function
Description

Shiny is an R package that makes it easy to build interactive web apps straight from R.

has function
Description

ClearCL is a Multi-backend Java Object Oriented Facade API for OpenCL.

OpenCL libraries come and go in Java, some are great but then one day the lead developper goes on to greener pastures and you are left with code that needs to be rewritten to take advantage of a new up-to-date library with better support. Maybe a particular library has a bug or does not support the function you need? or it does not give you access to the underlying native pointers, making difficult to process large buffers/images or interoperate with hardware? or maybe it just does not support your exotic OS of choice. To protect your code from complete rewrites ClearCL offers a very clean and complete API to write your code against. Changing backend requires just changing one line of code.

has function
Description

MTrack is a tool, which detects, tracks, and measures the behavior of fluorescently labeled microtubules imaged by TIRF (total internal reflection fluorescence) microscopy. In such an in vitro reconstitution approach, stabilized, non-dynamic microtubule seeds serve as nucleation points for dynamically growing microtubules.

MTrack is a bi-modular tool. The first module detects and tracks the growing microtubule ends and creates trajectories. The second module uses these trajectories to fit models of dynamic behavior (polymerization and depolymerization velocities, catastrophe and rescue frequencies). It also computes statistics such as length and lifetime distributions when analyzing more than one movie (batch mode).

has topic
Track Filament shaped objects and analyze tracks using Ransac fits.
Description

Calculates and corrects for lens-distortion models including chromatic abberation from confocal stacks.

Description

SliceMap

Whole brain tissue slices are commonly used in neurobiological research for analyzing pathological features in an anatomically defined manner. However, since many pathologies are expressed in specific regions of the brain, it is necessary to have an annotation of the regions in the brain slices. Such an annotation can be done by manual delineation, as done most often, or by an automated region annotation tool.

SliceMap is a FIJI/ImageJ plugin for automated brain region annotation of fluorescent brain slices. The plugin uses a reference library of pre-annotated brain slices (the brain region templates) to annotate brain regions of unknown samples. To perform the region annotation, SliceMap registers the reference slices to the sample slice (using elastic registration plugin BUnwarpJ) and uses the resulting image transformations to morph the template regions towards the anatomical brain regions of the sample. The resulting brain regions are saved as FIJI/ImageJ ROI’s (Regions Of Interest) as a single zip-file for each sample slice.

More information can also be found in "SliceMap: an algorithm for automated brain region annotation", Michaël Barbier, Astrid Bottelbergs, Rony Nuydens, Andreas Ebneth, Winnok H De Vos, Bioinformatics, btx658, https://doi.org/10.1093/bioinformatics/btx658

Example: SliceMaps brain region segmentation
Description

Software for analysis, visualization, simulation, and acquisition  of data from spectroscopy and fluorescence microscopy.

  • Fluorescence Correlation Spectroscopy (FCS)
  • Fluorescence Lifetime Imaging (FLIM) and Phasor plots
  • Förster Resonance Energy Transfer (FRET)
  • Generalized Polarization (GP) and Spectral Phasors
  • Number and Brightness (N&B)
  • Photon Counting Histogram (PCH)
  • Raster and Spatio-temporal Image Correlation Spectroscopy (RICS and STICS)
  • Single Particle and Modulation Tracking (SPT, MT)
  • Image Mean Square Displacement (iMSD)
  • Pair correlation function (pCF)
has function
Description

scenery is a scenegraphing and rendering library. It allows you to quickly create high-quality 3D visualisations based on mesh data. scenery contains both a OpenGL 4.1 and Vulkan renderer. The rendering pipelines of both renderers are configurable using YAML files, so it's easy to switch between e.g. Forward Shading and Deferred Shading, as well as stereo rendering. Rendering pipelines can be switched on-the-fly.

Both renderers support rendering to head-mounted VR goggles like the HTC Vive or Oculus Rift via OpenVR/SteamVR.

has function
Description

The Multiview Reconstruction software package enables users to register, fuse, deconvolve and view multiview microscopy images. The software is designed for lightsheet fluorescence microscopy (LSFM), but is applicable to any form of three or higher dimensional imaging modalities like confocal timeseries or multicolor stacks. 

need a thumbnail
Description

The BigDataViewer is a re-slicing browser for terabyte-sized multi-view image sequences. BigDataViewer was developed with multi-view light-sheet microscopy data in mind and integrates well with Fiji's SPIMage processing pipeline.

Description

"The plugin analyzes fluorescence microscopy images of neurites and nuclei of dissociated cultured neurons. Given user-defined thresholds, the plugin counts neuronal nuclei, and traces and measures neurite length."[...]" NeuriteTracer is a fast simple-to-use ImageJ plugin for the analysis of outgrowth in two-dimensional fluorescence microscopy images of neuronal cultures. The plugin performed well on images from three different types of neurons with distinct morphologies."

This plugin requires parameter setting: Threshold levels and scale (see more details on the related publication)

Description

Bigwarp is a tool for manual, interactive, landmark-based deformable image alignment. It uses the BigDataViewer for visualization and navigation, and uses a Thin Plate Spline implemented in Java to build a deformation from point correspondences.

Bigwarp screenshot
Description

The BigStitcher is a software package that allows simple and efficient alignment of multi-tile and multi-angle image datasets, for example acquired by lightsheet, widefield or confocal microscopes. The software supports images of almost arbitrary size ranging from very small images up to volumes in the range of many terabytes, which are for example produced when acquiring cleared tissue samples with lightsheet microscopy.

Illustrates an example of an interactive view of a single-view multi-tile dataset with irregular tiling acquired by lightsheet microscopy. Each tile of size 1920x1920x1000 pixels is depicted in a random color.
Description

FracLac is for digital image analysis. Use it to measure difficult to describe morphological features.
FracLac is a plugin for ImageJ. It is freely available software developed and maintained by our lab at the School of Community Health, Faculty of Science, Charles Sturt University, Australia. The author of the software and project lead is also the author of this document (me, Audrey Karperien). The basic box counting algorithm was originally modified from ImageJ's box counting algorithm and H. Jelinek's NIH Image plugin, and was further elaborated based on extensive research and development. The convex hull algorithm was provided by Thomas Roy, University of Alberta, Canada. As open source software, with the continuing help of a host of users and collaborators, FracLac has evolved to a suite of fractal analysis and morphology functions.

need a thumbnail
Description

This project was designed for vectorize and analyze the  blood vessels in the mouse brain.

This plugin requires the definition of seed point detection settings by the user (Semi-automated).

has topic
need a thumbnail
Description

We have developed a novel approach, named DF-Tracing, to tackle this challenge. This method first extracts the neurite signal (foreground) from a noisy image by using anisotropic filtering and automated thresholding. Then, DF-Tracing executes a coupled distance-field (DF) algorithm on the extracted foreground neurite signal and reconstructs the neuron morphology automatically. Two distance-transform based “force” fields are used: one for “pressure”, which is the distance transform field of foreground pixels (voxels) to the background, and another for “thrust”, which is the distance transform field of the foreground pixels to an automatically determined seed point. The coupling of these two force fields can“push” a “rolling ball” quickly along the skeleton of a neuron, reconstructing the 3D cell morphology.

Simple Tracing - DT-fields
Description

While OpenCV was designed for use in full-scale applications and can be used within functionally rich UI frameworks (such as Qt*, WinForms*, or Cocoa*) or without any UI at all, sometimes there it is required to try functionality quickly and visualize the results. This is what the HighGUI module has been designed for.

It provides easy interface to:

  • Create and manipulate windows that can display images and "remember" their content (no need to handle repaint events from OS).
  • Add trackbars to the windows, handle simple mouse events as well as keyboard commands.
has function
Description

The OpenCV CUDA module is a set of classes and functions to utilize CUDA computational capabilities. It is implemented using NVIDIA* CUDA* Runtime API and supports only NVIDIA GPUs. The OpenCV CUDA module includes utility functions, low-level vision primitives, and high-level algorithms. The utility functions and low-level primitives provide a powerful infrastructure for developing fast vision algorithms taking advantage of CUDA whereas the high-level functionality includes some state-of-the-art algorithms (such as stereo correspondence, face and people detectors, and others) ready to be used by the application developers.

The CUDA module is designed as a host-level API. This means that if you have pre-compiled OpenCV CUDA binaries, you are not required to have the CUDA Toolkit installed or write any extra code to make use of the CUDA.

has function
OpenCV Logo
Description

The module provides biological visual systems models (human visual system and others). It also provides derivated objects that take advantage of those bio-inspired models.

OpenCV Logo
Description

A complete package for fluorescence lifetime analysis implemented as an R package with sample data.

Description

The wound healing tool measures the area of a wound in a time series of images of cellular tissue. The tool will measure the area of the wound, i.e. the area that does not contain tissue, in each image. The segmentation is based on the fact that the image is more homogeneous in the region of the wound as in the region of the tissue. Via the options, one of two methods to detect the empty area, can be selected. The first uses edge detection, the second a variance filter. Holes in the detected tissue are filled using morphological operations.

Measure area of the wound
Description
has topic
Measure thickness from a mask
Description

This plugin filters a 3D image stack (or 2D image) to produce a score for how "tube-like" each point in the image is. This is useful as a preprocessing step for tracing neurons or blood vessels, for example. For 3D image stacks, the plugin uses the eigenvalues of the Hessian matrix to calculate this measure of "tubeness", using a metrics mentioned in Sato et al 1997 ¹: if the larger two eigenvalues (λ₂ and λ₃) are both negative then value is √(λ₂λ₃), otherwise the value is 0. For 2D images, if the large eigenvalue is negative, we return its absolute value and otherwise return 0.

This plugin is now bundled as part of Fiji.

Description

By combining multiple image alignment and tracing into one program, Reconstruct (TM) allows images to be processed more efficiently. Tracing can be done directly on the transformed images and alignments can be asily modified. Reconstruct (TM) was developed from years of experience working with high magnification serial section images of brain tissue. (Extracted from User Manual)

"The original platform of the Reconstruct program allows a user to trace objects in serial sections by manually drawing the outline of each object on each section, which is time-consuming. We modified Reconstruct to enable semi-automatic tracing of axons using a region-growing algorithm called wildfire."

Reconstruct_standaloneapp_example_Results
Description

The Adipocytes Tools help to analyze fat cells in images from histological section. This is a rather general cell segmentation approach. It can be adapted to different situations via the parameters. This means that you have to find the right parameters for your application.

Sample Image: [0178_x5_3.tif](http://dev.mri.cnrs.fr/attachments/190/0178_x5_3.tif)

has topic
has function
Description

JFilament is an ImageJ plugin for segmentation and tracking of 2D and 3D filaments in fluorescenece microscopy images. The main algorithm used in Jfilament is "Stretching Open Active Contours" (SOAC). In order to use this method, the user must define seed points in the image where the SOAC method will begin.

JFilament also includes 2D "closed" active contours which can be used for tasks such as segmentation and tracking of cell boundaries.


JFilament_ImageJ_pulgin_Window
Description

EBImage provides general purpose functionality for image processing and analysis. In the context of (high-throughput) microscopy-based cellular assays, EBImage offers tools to segment cells and extract quantitative cellular descriptors. This allows the automation of such tasks using the R programming language and facilitates the use of other tools in the R environment for signal processing, statistical modeling, machine learning and visualization with image data.

EBImage is available through the Bioconductor software project (www.bioconductor.org). Strengths Lightweight Suitable for automated, scripted analyses All functions are documented with examples Modular links to R and Bioconductor software, notably imageHTS and cellHTS2 Community support via the Bioconductor mailing list Reproducible (image) analysis using the Sweave report-writing system

EBImage
Description

The ultimate goal of the NET framework is to make images of networks processable by computers. Therefore we want to have a pixel based image as input, as output we want a representation of the network visible in the image that retains as much information about the original network as possible. NET achives this by first segmenting the image and then vectorizing the network and then extracting information. The information we extract is

  • First and foremost the graph of the network. We find the crossings (nodes) and connections between crossings (edges) and therefore extract information about the neighborhood relations, the topology of the network.
  • We also extract the coordinates of all nodes which enables us to embed them into space. We therefore extract information about the geometry of the network.
  • Last but not least we track the radii of the edges in the extraction process. Therefore every edge has a radius which can be identified with its conductivity.

In the following we will first provide detailed instructions on how to install NET on several platforms. Then we describe the functionality and options of each of the four scripts that make up the NET framework.

has topic
need a thumbnail
Description

Measures wound-healing assay videos, 

 For each video, the velocity and the order parameter are analyzed in time and space to extract quantitative parameters characterizing the cell motility phenotype. The different conditions (videos) can then be classified according to these parameters.

AveMAP
Description

The invention comprises a software tool, NeuronMetrics, which functions as a set of modules that run in the open-source program ImageJ. NeuronMetrics features a novel method for estimating neural “branch number” (a measure of the axonal complexity) from two-dimensional images. In addition, the tool features a novel method for modeling neural structure in large “gaps” that result from image artifacts.


has topic
need a thumbnail
Description

Computes image Hessian
Based on the algorithm described in the paper below. 

Splines: A Perfect Fit for Signal and Image Processing
M. Unser
IEEE Signal Processing Magazine, vol. 16, no. 6, pp. 22-38, November 1999.
 DOI: 10.1109/79.799930
 http://ieeexplore.ieee.org/document/799930/

has function
need a thumbnail
Description

Computes image Laplacian


Based on the algorithm described in the paper below. 

Splines: A Perfect Fit for Signal and Image Processing
M. Unser
IEEE Signal Processing Magazine, vol. 16, no. 6, pp. 22-38, November 1999.
 DOI: 10.1109/79.799930
 http://ieeexplore.ieee.org/document/799930/

has function
need a thumbnail
Description

Computes image gradient


Based on the algorithm below. 

Splines: A Perfect Fit for Signal and Image Processing
M. Unser
IEEE Signal Processing Magazine, vol. 16, no. 6, pp. 22-38, November 1999.
 DOI: 10.1109/79.799930
 http://ieeexplore.ieee.org/document/799930/

has topic
has function
need a thumbnail
Description

Neural Circuit Tracer (NCTracer) is open source software for automated and manual tracing of neurites from light microscopy stacks of images. NCTracer has more than one workflow available for neuron tracing. 


"The Neural Circuit Tracer is open source software built using Java (Sun Microsystems) and Matlab (MathWorks, Inc., Natick MA). It is based on the core of ImageJ (http://rsbweb.nih.gov/ij) and the graphic user interface has been developed by using Java Swings. The software combines anumber of functionalities of ImageJ with several newly developed functions for automated and manual tracing of neurites. The Neural Circuit Tracer is designed in a way
that will allow the users to add any plug-ins developed for ImageJ. More importantly, functions written in MatLab and converted into Java with Matlab JA toolbox can also be added to the Neural Circuit Tracer." 

Example of output from Neural Circuit Tracer
Description

Microscopy Image Browser (MIB) is a high-performance Matlab-based software package for advanced image processing, segmentation and visualization of multi-dimensional (2D-4D) light and electron microscopy datasets.

MIB is a freely available, user-friendly software for effective image processing of multidimensional datasets that improves and facilitates the full utilization of acquired data and enables quantitative analysis of morphological features. Its open-source environment enables fine tuning and possibility of adding new plug-ins to customize the program for specific needs of any research project.

MIB
Description

AnaMorf is a plug-in developed for the ImageJ platform to analyse the microscopic morphology of filamentous microbes. The program returns average data on a population of mycelial elements, using the descriptors projected area, circularity, total hyphal length, number of hyphal tips, hyphal growth unit, lacunarity and fractal dimension. The plug-in accepts as input a user-specified directory of images, analysing each and outputing tabulated results.

has function
AnaMorph
Description

Kappa is a Fiji plugin for Curvature Analysis.

It allows a user to measure curvature in images in a convenient way. You can trace an initial shape with a B-Spline curve in just a few clicks and then fit that curve to image data with a minimization algorithm. It’s fast and robust.

has topic
has function
Kappa user interface
Description

iTrack4U is a Java-based software using ImageJ and jMathPlot libraries, which aims at automatically tracking cells recorded in phase-contrast microscopy. It includes all tools from image files preprocessing, tracking to data extraction and visualization. 


Please cite Cordeliéres et. al. (2013) when using this software package!

iTrack4U
Description

This plugin tags all pixel/voxels in a skeleton image and then counts all its junctions, triple and quadruple points and branches, and measures their average and maximum length.

Tags are shown in a new window displaying every tag in a different color. You can find it under [Plugins>Skeleton>Analyze Skeleton (2D/3D)]. See Skeletonize3D for an example of how to produce skeleton images.

The voxels are classified into three different categories depending on their 26 neighbors: - End-point voxels: if they have less than 2 neighbors. - Junction voxels: if they have more than 2 neighbors. - Slab voxels: if they have exactly 2 neighbors.

End-point voxels are displayed in blue, slab voxels in orange and junction voxels in purple.

Notice here that, following this notation, the number of junction voxels can be different from the number of actual junctions since some junction voxels can be neighbors of each other.


Output data type: table result, image of the skeleton


Description

MorphoGraphX is a free Linux application for the visualization and analysis of 3D biological datasets. Developed by researchers, it is primarily used for the analysis and quantification of 3D live-imaged confocal data sets.

The main research interests adressed by MorphoGraphX are:

  • Shape extraction
  • Growth analysis
  • Signal quantification
  • Protein localization
has function
MorphoGraphX user interface
Description

This plugin achieves easy creation of image figures for publications, reports, projects.

  • Easy-to-design interactive figure layout.

  • Visually assign image content to panels.

  • High-quality image scaling and rotation.

  • Easy and consistent panel labels and scale bars.

  • Each panel has it's original datasource's properties and tracks achieved image processing.

  • Save and re-open editable figures.

  • Export as standard image formats with textual description of each panel history.

Compared to Make montage, the plugin adds more flexibility to montage creation: Easy-to-design interactive figure layout. Visually assign image content to panels. High-quality image scaling and rotation. Easy and consistent panel labels and scale bars. Each panel has it's original data source's properties and tracks achieved image processing. Save and re-open editable figures. Export as standard image formats with textual description of each panel history. 

has topic
has function
FigureJ
Description

hIPNAT (hIPNAT: Image Processing for NeuroAnatomy and Tree-like structures) is a set of tools for the analysis of images of neurons and other tree-like morphologies. It is written for ImageJ, the de facto standard in scientific image processing. It is available through the ImageJ Neuroanatomy update site.

need a thumbnail
Description

CIDRE is a retrospective illumination correction method for optical microscopy. It is designed to correct collections of images by building a model of the illumination distortion directly from the image data. Larger image collections provide more robust corrections. Details of the method are described in

K. Smith, Y. Li, F. Ficcinini, G. Csucs, A. Bevilacqua, and P. Horvath
CIDRE: An Illumination Correction Method for Optical Microscopy, Nature Methods 12(5), 2015, doi:10.1038/NMETH.3323

Illumination correction method
Description

"we propose a novel automatic 3D neuron reconstruction algorithm, named Rivulet, which is based on the multi-stencils fast-marching and iterative back-tracking. The proposed Rivulet algorithm is capable of tracing discontinuous areas without being interrupted by densely distributed noises." 

This plugin can be used with default parameters or with user-defined parameters.

Example image obtained from Rivulet Wiki website (https://github.com/RivuletStudio/Rivulet-Neuron-Tracing-Toolbox/wiki

Traceplot_Rivulet
Description

All-path-pruning 2.0 (APP2) is a component of Vaa3D. APP2 prunes an initial reconstruction tree of a neuron’s morphology using a long-segment-first hierarchical procedure instead of the original termini-first-search process in APP. APP2 computes the distance transform of all image voxels directly for a gray-scale image, without the need to binarize the image before invoking the conventional distance transform. APP2 uses a fast-marching algorithm-based method to compute the initial reconstruction trees without pre-computing a large graph. This method allows to trace large images. This method can be used with default parameters or user-defined parameters.

APP2_Vaa3D_example_Result
Description

Vaa3D is a handy, fast, and versatile 3D/4D/5D Image Visualization and Analysis System for Bioimages and Surface Objects. It also provides many unique functions that you may not find in other software. It is Open Source, and supports a very simple and powerful plugin interface and thus can be extended and enhanced easily.

Vaa3D is cross-platform (Mac, Linux, and Windows). This software suite is powerful for visualizing large- or massive-scale (giga-voxels and even tera-voxels) 3D image stacks and various surface data. Vaa3D is also a container of powerful modules for 3D image analysis (cell segmentation, neuron tracing, brain registration, annotation, quantitative measurement and statistics, etc) and data management. This makes Vaa3D suitable for various bioimage informatics applications, and a nice platform to develop new 3D image analysis algorithms for high-throughput processing. In short, Vaa3D streamlines the workflow of visualization-assisted analysis.

Vaa3D can render 5D (spatial-temporal) data directly in 3D volume-rendering mode; it supports convenient and interactive local and global 3D views at different scales... it comes with a number of plugins and toolboxes. Importantly, you can now write your own plugins to take advantage of the Vaa3D platform, possibly within minutes!


Vaa3D_logo
Description

"We have developed an automatic graph algorithm, called the all-path pruning (APP), to trace the 3D structure of a neuron. To avoid potential mis-tracing of some parts of a neuron, an APP first produces an initial over-reconstruction, by tracing the optimal geodesic shortest path from the seed location to every possible destination voxel/pixel location in the image. Since the initial reconstruction contains all the possible paths and thus could contain redundant structural components (SC), we simplify the entire reconstruction without compromising its connectedness by pruning the redundant structural elements, using a new maximal- covering minimal-redundant (MCMR) subgraph algorithm. We show that MCMR has a linear computational complexity and will converge. We examined the performance of our method using challenging 3D neuronal image datasets of model organisms (e.g. fruit fly)"

This plugin can be used with default parameters or user-defined parameters.

APP_Vaa3D_example_results
Description

Summary

QuimP is software for tracking cellular shape changes and dynamic distributions of fluorescent reporters at the cell membrane. QuimP's unique selling point is the possibility to aggregate data from many cells in form of spatio-temporal maps of dynamic events, independently of cell size and shape. QuimP has been successfully applied to address a wide range of problems related to cell movement in many different cell types. 

Introduction

In transmembrane signalling the cell membrane plays a fundamental role in localising intracellular signalling components to specific sites of action, for example to reorganise the actomyosin cortex during cell polarisation and locomotion. The localisation of different components can be directly or indirectly visualised using fluorescence microscopy, for high-throughput screening commonly in 2D. A quantitative understanding demands segmentation and tracking of whole cells and fluorescence signals associated with the moving cell boundary, for example those associated with actin polymerisation at the cell front of locomoting cells. As regards segmentation, a wide range of methods can be used (threshold based, region growing, active contours or level sets) to obtain closed cell contours, which then are used to sample fluorescence adjacent to the cell edge in a straightforward manner. The most critical step however is cell edge tracking, which links points on contours at time t to corresponding points at t+1. Optical flow methods have been employed, but usually fail to meet the requirement that total fluorescence must not change. QuimP uses a method (ECMM, electrostatic contour migration method (Tyson et al., 2010) which has been shown to outperform traditional level set methods. ECMM minimises the sum of path lengths connecting all pairs of points, equivalent to minimising the energy required for cell deformation. The original segmentation based on an active contour method and outline tracking algorithms have been described in (Dormann et al., 2002; Tyson et al., 2010; Tyson et al., 2014).

Screenshot
Description

The Sprout Morphology plugin measures sprout number, length, width and cell density of endothelial cell (EC) sprouts grown in a bead sprouting assay. It optionally includes measuring the coverage of these sprouts with pericytes included in the assay, as well as the endothelial cell/pericyte ratio.

graphical abstract
Description

SOAX is an open source software tool to extract the centerlines, junctions and filament lengths of biopolymer networks in 2D and 3D images. It facilitates quantitative, reproducible and objective analysis of the image data. The underlying method of SOAX uses multiple Stretching Open Active Contours (SOACs) that are automatically initialized at image intensity ridges and then stretch along the centerlines of filaments in the network. SOACs can merge, stop at junctions, and reconfigure with others to allow smooth crossing at junctions of filaments.

SOAX provides 3D visualization for exploring image data and visually checking results against the image. Quantitative analysis functions based on extracted networks are also implemented in SOAX, including spatial distribution, orientation, and curvature of filamentous structures. SOAX also provides interactive manual editing to further improve the extraction results, which can be saved in a file for archiving or further analysis. Useful for microtubules or actin filaments.

Observation: Depending on the operating system, the installation may or may not require Boost C++, ITK and VTK libraries. Windows has a standalone executable application without the need of those. 

snapshot microtubules soax
Description

This is an example workflow of how to perform automatic registration by

- first detecting spots in both images using wavelet segmentation (with different scale according to the image scale)

- second using Ec-Clem autofinder to register both images

Click on a block to know more about a tool. Non referenced tools are non clickable.

testWorkflow testWorkflow testWorkflowimage map example
Workflow results
Description

Spot detector detects and counts spots, based on wavelet transform.

- Detects spots in noisy images 2D/3D.
- Depending on objective, spots can be nuclei, nucleus or cell
- Versatile input: sequence or batch of file.
- Detects spot in specific band/channel.
- Multi band labeling: automaticaly creates ROIs from one band and count in the same or an other band.
- Filters detection by size.
- Sort detection by ROIs
- Output data in XLS Excel files: number of detection by ROIs, and each detection location and size.
- Outputs withness image with ROIs and detection painted on it.
- Outputs binary detection image.
- Displays detections
- Displays tags

logo spot detector
Description

WormGUIDES Atlas is an interactive 4D portrayal of neural development in C. elegans. It will ultimately contain nuclear positions for every cell in the embryo, identified and tracked from the 2 cell stage until hatching. Single-cell and subcellular information, including neural outgrowth dynamics for each cell as well as cell function, gene expression, the adult neural connectome and related literature will be collated for each cell from public sources and also integrated with the atlas model. WormGUIDES Atlas integrates tools for exploratory data analyses and insight sharing. Navigation is linked between 3D and lineage tree views. In both contexts, community single cell information can be accessed with a click, creating live web queries that summarize knowledge about a cell. In many cases this information can be used to control cell color, creating customized interactive visualizations. A user's insights can be annotated directly into the embryo model with a note-taking interface that attaches each annotation to a cell or other point in space and time. These multi-dimensionally located notes can then be ordered into a (chrono)logical story sequence that explains developmental events as they unfold in the embryo. Annotations can be saved and shared with collaborators or the community.

WormGuides screenshot
Description

This ImageJ plug-in is a compilation of co-localization tools. It allows:

-Calculating a set of commonly used co-localization indicators:

Pearson's coefficient Overlap coefficient k1 & k2 coefficients Manders' coefficient Generating commonly used visualizations:

-Cytofluorogram

Having access to more recently published methods:

-Costes' automatic threshold

Li's ICA Costes' randomization Objects based methods (2 methods: distances between centres and centre-particle coincidence)

example of partial colocalisation from reference publication
Description

Bio Image Analysis tool from REF

logo ImageJ
Description

ICE (Image Composite Editor) is a fast, fully automatic software by Microsoft that can create large montages from overlapping images. Although it is tailored around the task of stitching together images from a photo camera, it also works on biological images taken from light and electron microscopes. It has limited command line options, which however could facilitate batch processing (https://social.microsoft.com/Forums/en-US/806bf0c5-af8f-4526-9b90-6d280…).

Screenshot
Description

GelBandFitter is a user-friendly software specific for analysis of protein gels and estimation of relative protein content. Using non-linear regression methods to fit mathematical functions to densitometry profiles, it is able to estimate content from protein bands that partially overlap. The software is available either as Matlab code (Optimization toolbox required) or a Windows executable. Reference: Mitov, M. I., Greaser, M. L., & Campbell, K. S. (2009). GelBandFitter – A computer program for analysis of closely spaced electrophoretic and immunoblotted bands. Electrophoresis, 30(5), 848–851. http://doi.org/10.1002/elps.200800583

has topic
has function
GelBandFitter screenshot
Description

SRRF is a high-performance analytical approach for Live-cell Super-Resolution Microscopy, provided as a fast GPU-enabled ImageJ plugin. SRRF is capable of extracting high-fidelity super-resolution information from TIRF, widefield and confocals using conventional fluorophores such as GFP. SRRF is capable of live-cell imaging over timescales ranging from minutes to hours.

Comparison TIRF - SRRF
Description

Spotsizer is a software tool that automates analysis of large volumes of photographic images of growing microbes.

screenshot of the spotsizer gui
Description

CellProfiler is free, open-source software for quantitative analysis of biological images.

CellProfiler is designed to enable biologists without training in computer vision or programming to quantitatively measure cell or whole-organism phenotypes from thousands of images automatically. The researcher creates an analysis pipeline from modules that find cells and cell compartments, measure features of those cells to form a rich, quantitative dataset that characterizes the imaged site in all of its heterogeneity. CellProfiler is structured so that the most general and successful methods and strategies are the ones that are automatically suggested, but the user can override these defaults and pull from many of the basic algorithms and techniques of image analysis to solve harder problems. CellProfiler is extensible through plugins written in Python or for ImageJ. Strengths: Cells, Neurons, C. Elegans, 2D Fluorescent images, high-throughput screening, phenotype classification, multiple stains/site, interoperability, extensibility, machine learning, segmentation Limitations: largely limited to 2D, not well suited to manually-guided analysis or content review, image size limitations

Description

PopulationProfiler – is light-weight cross-platform open-source tool for data analysis in image-based screening experiments. The main idea is to reduce per-cell measurements to per-well distributions, each represented by a histogram. These can be optionally further reduced to sub-type counts based on gating (setting bin ranges) of known control distributions and local adjustments to histogram shape. Such analysis is necessary in a wide variety of applications, e.g. DNA damage assessment using foci intensity distributions, assessment of cell type specific markers, and cell cycle analysis.

has topic
PopulationProfiler screenshot
Description

BioImageXD is a free open source software package for analyzing, processing and visualizing multi-dimensional microscopy images. It's a collaborative project, designed and developed by microscopists, cell biologists and software engineers from the Universities of Jyväskylä and Turku in Finland, Max Planck Institute CBG in Dresden, Germany and collaborators worldwide. BioImageXD was published in the July 2012 issue of Nature Methods.

Screen capture of BioImageXD
Description

ADAPT is capable of rapid, automated analysis of migration and membrane protrusions, together with associated
fluorescently labeled proteins, across multiple cells. ADAPT can detect and morphologically profile filopodia.

ADAPT (Automated Detection and Analysis of ProTrusions) is a plug-in developed for the ImageJ/Fiji platform to automatically detect and analyse cell migration and morphodynamics. The program provides whole-cell analysis of multiple cells, while also returning data on individual membrane protrusion events. The plug-in accepts as input one or two image stacks and outputs a variety of data. ADAPT may also be run in batch mode.


has function
ADAPT logo
Description

Advanced Cell Classifier is a data analyzer program to evaluate cell-based high-content screens and tissue section images developed at the Biological Research Centre, Szeged and FIMM, Helsinki (formerly at ETH Zurich). The basic aim is to provide a very accurate analysis with minimal user interaction using advanced machine learning methods.

Advanced Cell Classifier
Description

A standalone cell tracking software for single cell migration. Tracking of cells in tissue was also done in Drosophila germband.

GUI image (from http://sacan.biomed.drexel.edu/celltrack)
Description

The ImageJFX Project aims to create a new user interface for the software ImageJ in order to ease scientific image analysis. While keeping the core components of ImageJ, ImageJFX brings scientists closer to their goal by making the interface clearer for beginners and more practical for advanced users.

ImageJFX screen Capture
Description

QuantCenter is the framework for 3DHISTECH image analysis applications. with the goal of helping the pathologists to diagnose in an easier way. QuantCenter, is optimized for whole slide quantification. It has a linkable algorithm concept that tries to provide an easy-to-use and logical workflow. The user has different quantification modules that he or she could link one after other to fine-tune or to speed up the analysis.

QuantCenter logo
Description

COLORLAB is a component for processing, representing and reproducing color in a MATLAB environment. Among others, some of the functionalities it makes able to: -Represent the color content of any image in chromatic diagrams and tristimulus spaces in any system of primaries. -Compute advanced color descriptions of any image using several color appearance models (CIELab, CIEluv, ATD, Rlab, LLab, SVF and CIECAM). An userguide is provided.

has function
need a thumbnail
Description

We propose to use a kernel density estimation (KDE) based approach for classification. This non-parametric approach intrinsically provides the likelihood of membership for each class in a principled manner. The implementation was used in Ghani2016. Any papers using this code should cite Ghani2016 accordingly. The software has been tested under Matlab R2013b.


Sample Data: Annotated two-photon images of dendritic spines

Description

This is a Matlab implementation of Local Phase Quantization (LPQ) texture descriptors that is robust to image blurring due to the use of phase information. Theoretical background could be found here: http://www.ee.oulu.fi/research/mvmp/mvg/files/pdf/ICISP08.pdf

need a thumbnail
Description

ASAP is an open source platform for visualizing, annotating and automatically analyzing whole-slide histopathology images. It consists of several key-components (slide input/output, image processing, viewer) which can be used seperately. It is built on top of several well-developed open source packages like OpenSlide, Qt and OpenCV but also tries to extend them in several meaningful ways.

need a thumbnail
Description

MyTardis is free and open-source data management software. It facilitates annotation, sharing and archiving of data and metadata collected from different modalities. It focuses on integration with scientific instruments, instrument facilities and research storage and computing infrastructure; to address the challenges of data storage, data access, collaboration and data publication. It is currently being used to capture data from areas such as optical microscopy, electron microscopy, medical imaging, protein crystallography, neutron and X-ray scattering, flow cytometry, genomics and proteomics.

Key features:

  • Easy instrument integration.
  • Discipline specific: MX, Imaging, Microscopy, Genomics ...
  • Wide range of data formats & supported instruments.
  • Secure cloud data storage & access.
  • Simple data sharing.
  • Researcher controlled data publishing.
  • APIs for programmatic access to data and metadata.
has topic
has function
need a thumbnail
Description

QuPath is open source software for Quantitative Pathology. QuPath has been developed as a research tool at Queen's University Belfast.

QuPath
Description

This is a software toolbox that extends the original BSIF code allowing the utilization of a GPU in Matlab to compute the features. It contains: -Matlab function to calculate BSIF in CPU -Matlab function extension to calculate BSIF in GPU -Pre-learnt filters -Usage instructions

need a thumbnail
Description

This is a Java content-based image retrieval software components. It can be runned independantly or connected to a Cytomine server. Content-based image retrieval (CBIR), also known as query by image content (QBIC) and content-based visual information retrieval (CBVIR) is the application of computer vision techniques to the image retrieval problem, that is, the problem of searching for digital images in large databases. Content-based" means that the search algorithm analyzes the contents of the image rather than the metadata such as keywords, tags, or descriptions associated with the image. The term "content" in this context might refer to colors, shapes, textures, or any other information that can be derived from the image itself. The CBIRetrieval library is: Incremental: You can add new images all over the time. Scalable: Run as many server as you want. Client performs search on all servers. Flexible: Run as a simple app (command line) or use the JAR in your own JVM app/server (java import) Opensource/Free: Apache 2.0 CBIRetrieval is a java library for CBIR, CBIRest is a server with a REST HTTP API with CBIRetrieval embedded. If you want to connect a software/webapp with a CBIR engine, you should use CBIRest. This is a fast multi-threaded and noSQL implementation of the algorithm published in: Incremental Indexing and Distributed Image Search using Shared Randomized Vocabularies Marée, Raphaël; Denis, Philippe; Wehenkel, Louis; Geurts, Pierre,in ACM Proceedings MIR 2010 (2010, March). It was applied on histology images and radiology images.

need a thumbnail
Description

Matlab implementation (2014) of Local Binary Pattern. Used for texture image analysis with insensitivity to local average value. Good explanation here: http://www.ee.oulu.fi/research/imag/mvg/files/pdf/ICCV2009_tutorial.pdf

need a thumbnail
Description

This package contains some MatLab tools for multi-scale image processing. Briefly, the tools include: - Recursive multi-scale image decompositions (pyramids), including Laplacian pyramids, QMFs, Wavelets, and steerable pyramids. These operate on 1D or 2D signals of arbitrary dimension. Data structures are compatible with the MatLab wavelet toolbox. - Fast 2D convolution routines, with subsampling and boundary-handling. - Fast point-operations, histograms, histogram-matching. - Fast synthetic image generation: sine gratings, zone plates, fractals, etc. - Display routines for images and pyramids. These include several auto-scaling options, rounding to integer zoom factors to avoid resampling artifacts, and useful labeling (dimensions and gray-range).

need a thumbnail
Description

A workflow in Python to measure muscule fibers corresponding to the method used in Keefe, A.C. et al. Muscle stem cells contribute to myofibres in sedentary adult mice. Nat. Commun. 6:7087 doi: 10.1038/ncomms8087 (2015).


Example image:


muscleQNT/15536_2032_0.tif ...

Description

SIMcheck is an ImageJ plugin suite for assessing the quality and reliability of Structured Illumination Microscopy (SIM) data. The quality of the raw data, the quality of the reconstruction and the calibration of the microscope can be tested. 

has function
Simcheck screenschot
Description

Automatic registration in 2D or 3D based on detection or binary mask. Takes images with detections already done on it.

logo autofinder
Description

This plugin allows to compute a similarity (translation/rotation/scaling and flipping) transform from pair of points. It is updating the transformed image interactively such that the user get immediate feedback. The transformation is saved and can be applied to any other stack/image. Non rigid deformation can also be applied in 2D or 3D.

3D/3D,2D/3D or 3D /2D can be handled .

3D ROI are enabled, and can be checked with the 3D vtk view (size of ROI can be changed using the ROI stroke width).

Some prealignment by rotating in 3D the volume is possible.

Transformations can be applied directly or combined through Block Protocols (search for apply transformation).

It's also provide information about the predicted Error (based on statistical prediction), either as a full color mapping, either on each points used as landmarks, and error on the discrepancy in position between points.

There are video tutorials available in the web.


logo ec-clem
Description
imageHTS is an R/Bioconductor package dedicated to the analysis of high-throughput microscopy-based screens. The package provides a modular and extensible framework to segment cells, extract quantitative cell features, predict cell types and browse screen data through web interfaces. Designed to operate in distributed environments, imageHTS provides a standardized access to remote data and facilitates the dissemination of high-throughput microscopy-based datasets.
need a thumbnail
Description

The jicbioimage Python package makes it easy to explore microscopy data in a programmatic fashion (python).

Exploring images via coding means that the exploratory work becomes recorded and reproducible.

Furthermore, it makes it easier to convert the exploratory work into (semi) automated analysis work flows.

Features:

  • Built in functionality for working with microscopy data
  • Automatic generation of audit trails
  • Python integration Works with Python 2.7, 3.3 and 3.4
Description

TurtleSeg is an interactive 3D image segmentation tool. TurtleSeg has an automated system, Spotlight, for automatically directing the user towards the next steps. Typically, a user loads a 3D image and then manually contour a sparse number of slices, the full 3D segmentation can then be built automatically.

need a thumbnail
Description

A resident function in ImageJ, located in the menu as [Process > Binary > Voronoi].

Quote from the ImageJ reference page:

Splits the image by lines of points having equal distance to the borders of the two nearest particles. Thus, the Voronoi cell of each particle includes all points that are nearer to this particle than any other particle. When particles are single points, this process is a Voronoi tessellation (also known as Dirichlet tessellation). The output type (Overwrite, 8-bit, 16-bit or 32-bit) of this command can be set in the [Process > Binary > Options...] dialog box. In the output, the value inside the Voronoi cells is zero; the pixel values of the dividing lines between the cells are equal to the distance between the two nearest particles. This is similar to a medial axis transform of the background, but there are no lines in inner holes of particles.


Description

An object detection function in ImageJ. [Analyze > Analyze Particles...]. It could simply be used for counting number of cells, but could also do more complex stuffs. ## Jython Snippet Here is a snippet of how to use Particle Analysis in Jython script.

has topic
need a thumbnail
Description

Estimate the frequency of hepatitis C virus infected cells based on the intensity of viral antigen associated immunofluorescence. 

The core is an ImageJ Macro, so it's easy to modify for one's own needs (Link to the code). 

has topic
has function
Description

XuvTools (pronounced “ex-you-vee-tools”) is a fully automated 3D stitching software for biomedical image data, typically confocal microscopy images. XuvTools runs on Microsoft Windows XP and Vista, Linux and Apple Mac computers. It supports 32 and 64bit operating systems (with 64bit highly preferred). XuvTools is free and open source software (see Licensing), so you can start using it immediately. Go to Downloads and give it a try. The goal of XuvTools is to provide tools, that combine multiple microscopic recordings to obtain a larger field of view (“stitching”) and a higher dynamic range (“HDR” recombination), or better resolution (multi view reconstruction), and to make these tools publicly available.

need a thumbnail
Description
IceImarisConnector is a simple commodity class that eases communication between Bitplane Imaris and MATLAB or python using the Imaris XT interface.
need a thumbnail
Description

Auto-Bayes is a software package based on Bayesian statistics and requires no user dependent parameters for molecule detection and image reconstruction for Single-Molecule Localization Microscopy (SMLM), including photoactivated localization microscope (PALM), stochastic optical reconstruction microscope (STORM), and direct stochastic optical reconstruction microscopy (dSTORM), etc.

need a thumbnail
Description

This software is designed for the rapid semi-automatic detection and quantification of synaptic protein puncta from 2D immunofluorescence images generated by confocal laser scanning microscopy.

need a thumbnail
Description

- 2D Stabilization in each slice of the stacks in time. - 3D Stabilization intravital imaging of all the stacks (including the dimension Z) - create the videos and the stabilized images in a new folder 2701

has function
need a thumbnail
Description

PSF Lab is a software program that calculates the illumination point spread function of a confocal microscope under various imaging conditions. It is available in 32-bit and 64-bit for Windows and in 64-bit for Mac.

has function
Description

FOCAL (Fast Optimized Cluster Algorithm for Localizations) is a rapid density based algorithm for detecting clusters in localization microscopy datasets.

need a thumbnail
Description
The Microscopy Image Analysis Tool (MIATool) is a software application designed for the viewing and processing of N-dimensional array of images. At its core is an image viewer which allows the traversal of an N-dimensional array of images. Besides the standard display as pixels of varying intensity values, options are available to view the images as mesh or contour plots. The current version of MIATool supports four different image editing tools which can be used to process the images displayed in the viewer. The intensity adjustment tool provides different ways to modify the pixel intensity values, and the crop tool allows trimming of the images to retain only the portion that is of interest. The two remaining tools - the segmentation tool and the label tool - can be used for manual image segmentation and image labeling.
need a thumbnail
Description

WaveTracer is a plugin for Metamorph. It represents a functional method for real-time reconstruction with automatic feedback control, without compromising the localization accuracy. It relies on a wavelet segmentation algorithm, together with a mix of CPU/GPU implementation.

has function
need a thumbnail
Description

Clus-Doc is a software that quantifies both the spatial distribution of a protein as well as its colocalization status. It may be used to quantify signaling activity and protein colocalization at the level of individual proteins.

need a thumbnail
Description

This plugin allows : Calculating co-localization between objects in 3D Measuring 3D distances between nearest object, co-localized or not Getting some 3D measurements about each objects The plugin can be used with labelled images, but it also integrates tools for the segmentation of the objects. Programming language: JAVA Processes: Denoise filter Segmentation of the objects Object based co-localization and distance analysis Counting and measurements on objects

Description

Image-processing algorithms developed at the MOSAIC Group for fluorescence microscopy. Tools included:

  • 2D/3D single-particle tracking tool which can be used to track bright spots in 2D/3D movies over time.
  • Optimal filament segmentation of 2D images. 
  • Curvature filters for image filtering, denoising, and restoration. 
  • Image naturalization for image enhancement based on gradient statistics of natural-scence images. 
  • Tool for automatically send and distribute jobs on clusters and get back the results.
  • Multi-region image segmentation of 2D and 3D images without needing to know the number of regions beforehand. 
  • Squassh for globally optimal segmentation of piecewise constant regions in 2D and 3D images and for object-based co-localization analysis. 
  • Tool for inferring spatial interactions between patterns of objects in images or between coordinates read from a file.
  • Tool for robust, histogram-based background subtraction well suited to correct for inhomogeneous illumination artifacts.
  • A tool to estimate the Point-Spread Function of the microscopy out of 2D fluorescence images.
  • A tool to measure the 3D Point-Spread Function of a confocal microscope from an image stack.
  • Addition of synthetic Poisson-distributed noise to an image in order to simulate shot noise of various signal-to-noise ratios. 
  • Convolution of an image with a Bessel function in order to simulate imaging with a microscope. 
  • A utility to detect bright spots in images and estimate their center. 
  • A utility to create manual segmentations to be used as ground truth to test and benchmark automatic segmentation algorithms.
  • A tool for replacing one color in an image with another color.
has topic
Description

Super-resolution optical fluctuation imaging (SOFI) achieves 3D super-resolution by computing temporal cumulants or spatio-temporal cross-cumulants of stochastically blinking fluorophores. In contrast to localization microscopy, SOFI is compatible with weakly emitting fluorophores and a wider range of blinking conditions. Balanced SOFI analyses several cumulant orders for extracting molecular parameter maps, such as the bright and dark state lifetimes, the concentration and the brightness distributions of fluorophores within biological samples. In combination with a deconvolution of the cumulant images, the estimated parameter maps proved useful to balance the image contrast and to linearize the brightness and blinking response. Thereby, the image quality and the resolution were improved significantly.

has function
need a thumbnail
Description

The MorphoLeaf application allows you to extract the contour of multiple leaf images and identify their biologically-relevant landmarks. These landmarks are then used to quantify morphological parameters of individual leaves and to reconstruct average leaf shapes. MorphoLeaf is developed by the Modeling and Digital Imaging and the Transcription Factors and Architecture teams of the Institut Jean-Pierre Bourgin, INRA Versailles, France, and the Biophyscis and Development group at RDP, Lyon.

Description

Free-D is a three-dimensional (3D) reconstruction and modeling software. It allows to generate, process and analyze 3D point and surface models from stacks of 2D images. Free-D is an integrated software, offering in a single graphical user interface all the functionalities required for 3D modeling. It runs on Linux, Windows, and MacOS. Free-D is developed by the Modeling and Digital Imaging team of the Institut Jean-Pierre Bourgin, INRA Versailles, France.

Description

SuReSim (Super Resolution Simulation) is an open-source simulation software for Single Molecule Localization Microscopy (SMLM). The workflow of the SuReSim algorithm starts from a ground truth structure and lets the user choose to either directly simulate 3D localizations or to create simulated *.tiff-stacks that the user can analyze with any given SMLM reconstruction software. A 3D structure of any geometry, either taken from electron microscopy, designed de-novo from assumptions or known structural facts, is fluorophore-labeled in silico. A defined set of parameters is used to calculate and visualize the 3D localizations of the corresponding labels. The software package is accompanied with a library of model structures that can be imported and simulated. Users manual with tutorial provided.

SureSim screenshot
Description

arivis Vision4D is a modular software for working with multi-channel 2D, 3D and 4D images of almost unlimited size independent of available RAM. Many imaging systems, such as high speed confocal, Light Sheet/ SPIM and 2 Photon systems, can produce a huge amount of multi-channel data, which arivis Vision4D handles without constraints. Terabyte ready arivis Vision4D main functionality: Easy import of most image formats from microsopes as well as biological formats High performance interactive 3D / 4D rendering on standard PCs and laptops with 3D Graphics Support Intuitive tools for stitching and alignment to create large multi-dimensional image stacks Immediate 2D, 3D and 4D visualization, annotation and analysis regardless of image size Creation, import, and export of 4D Iso-surfaces Powerful Analysis Pipeline for 3D /4D image analysis (cell segmentation, tracking, annotation, quantitative measurement and statistics, etc) Semi-automatic/manual segmentation and tracking with interactive Track Editor Easy design and export of 3D / 4D High Resolution Movies Seamless integration of custom workflows via Matlab API and Python scripting Data sharing for collaboration A user friendly software, easy to learn and use for any life scientist

need a thumbnail
Description

Free-D (http://free-d.versailles.inra.fr/) is a 3D reconstruction and modeling software. It is multiplatform, free (but not open source) tool for academic research and teaching.

Here is how to proceed, using Free-D:

1. Segmentation:

* load (a collection of) individual 3d stacks

* (optional for serial sections) perform a 2D registration to align image slices

* segment/reconstruct 3D contours using snakes

* segment 3D spots

2. Construct average cell:

* normalize the contours to compute a average cell, by registering/warping 3D contours/surfaces

3. Quantification:

* project each individual cell to the average one

* build density maps to analyze (cartography)

A few notes for current software version (till 10/2016):

* input file format: tiff (not able to import bioformats)

* currently results are saved in customized format, but there is an exportor to convert this format into fiji readable one

* import already generated contours is on the software's TODO list

need a thumbnail
Description

ThunderSTORM is an open-source, interactive, and modular plug-in for ImageJ designed for automated processing, analysis, and visualization of data acquired by single molecule localization microscopy methods such as PALM and STORM. Our philosophy in developing ThunderSTORM has been to offer an extensive collection of processing and post-processing methods so that users can easily adapt the process of analysis to their data.

need a thumbnail
Description

This is an ImageJ plugin to analyze bacterial cells. It provides a user-friendly interface and a powerful suite of detection, analysis and data presentation tools. It works with individual phase or fluorescence images as well as stacks, hyperstacks, and folders of any of these types. Even large image sets are analyzed rapidly generating raw tabular data that can either be saved or copied as is, or have additional statistical analysis performed and graphically represented directly from within MicrobeJ, making it an all-in-one image analysis solution.

need a thumbnail
Description

This ImageJ plugin aligns the slices of a stack just like the stackreg plugin on which it is built. It allows to save the transformations and to apply them to another stack. It furthermore allows to register two stacks.

need a thumbnail
Description

It is a tool to visualize and annotate volume image data of electron microscopy. Users can annotate objects (e.g. neurons) and skeleton structures. It provides the ability to overlaying the image data with user annotations, representing the spatial structure and the connectivity of labeled objects, and displaying a three dimensional model of it. It can be extended by plugins written in python. A similar, web-based implementation is being developed at webknossos.info. Example datasets are also available.

Annotation in Knossos
Description

MorphoLibJ is a library of plugin for ImageJ with functionalities for image processing such as filtering, reconstructing, segmenting, etc... Tools are based on Mathematical morphology with more rigorous mathematical approach than in the standard tools of ImageJ in particular for surface (or perimeter) measurements which are usually based on voxel counting.  

http://imagej.net/MorphoLibJ#Measurements

Among the features:

Morphological operations :  Dilation, Erosion, Opening,  Closing , Top hat (white and black), Morphological gradient (aka Beucher Gradient), Morphological Laplacian, Morphological reconstruction, Maxima/Minima , Extended Maxima/Minima -Watershed (classic or controlled) -Image overlay -Image labelling -Geodesic diameter -Region Adjacency Graph -Granulometry curves, morphological image analysis.


several steps of morphological segmentation of plant tissue using MorphoLibJ.
Description

Calculate the Fourier ring correlation (FRC). The FRC can be used as a resolution criterion for super resolution microscopy. The Plugin can display a plot of the FRC curve, along with the LOESS smoothed version of the curve. Finally it displays the threshold method used and the intersection of the FRC with the threshold, providing the FIRE number. It can be used on two open images or on pairs of images in batch mode. 2654 2655

need a thumbnail
Description

When trying to isolate objects, one strategy might be to use regular morphological operations (opening/closing) to remove small objects that are not of interest. In case small objects are made of a large number of pixels, this operation might impair the remaining objects' contours. An alternative strategy might be to use morphological reconstruction. In short, seed is placed on the image, on objects, then conditional dilation is performed from those seeds.

Here is how to proceed, using MorphoLibJ:

  1. Open an image
  2. Use the multi-point selection tool and place seeds on objects of interest
  3. Create a new image of same size, black background
  4. Transfer the selection to the new image (Edit/Selection/Restore selection)
  5. Draw (make sure you're using white foreground) the multiple point selection
  6. Launch the Morphological reconstruction plugin: Plugins > MorphoLibJ > Morphological reconstruction
need a thumbnail
Description

neuTube is a collection of neuron reconstruction tools from fluorescence microscope images. It has an interactive system with a 3D viewer, which can be clicked in 3D and perform neuron tracing automatically and semi-automatically. It can automatically recognize branching points as junctions. Traced neurons can be exported to swc format, which could be imported by various software packages. neuTube has Win and Mac OS standalone executable builds and may also be installed by manual compilation. In addition, neuTube can be used as a plugin in Vaa3D.


Neutube_standaloneapp_window_overview
Description

to be completed

has function
need a thumbnail
Description

This plugin applies the Hough Transform for Circles to an 8-Bit image, shows the resulting Hough Space in a new window and marks the centers of the found circles.

need a thumbnail
Description

ABSnake can segment complex structures in 2D images as well as 3D or temporal images. It uses a new active contour model based on a geometrical approach for correctly following invaginated structures.

need a thumbnail
Description

LocAlization Microscopy Analyzer (LAMA) is a software tool that contains several well-established data post processing algorithms for single-molecule localization microscopy (SMLM) data. LAMA has implemented algorithms for cluster analysis, colocalization analysis, localization precision estimation and image registration. LAMA works with a graphical user interface (GUI), and accepts simple input data formats as supported by various single- molecule localization software tools.

Description

MosaicIA is a tool to analyze the spatial distribution of objects in images. It estimates from an observed particle or object distribution what hypothetical interaction between the objects is most likely to have created this distribution.

need a thumbnail
Description

Localization-based super-resolution techniques open the door to unprecedented analysis of molecular organization. This task often involves complex image processing adapted to the specific topology and quality of the image to be analyzed. SR-Tesseler is an open-source segmentation software using Voronoï tessellation constructed from the coordinates of localized molecules. It allows precise, robust and automatic quantification of protein organization at different scales, from the cellular level down to clusters of a few fluorescent markers. SR-Tesseler is insensitive to cell shape, molecular organization, background and noise, allowing comparing efficiently different biological conditions in a non-biased manner, and perform quantifications on various proteins and cell types. SR-Tesseler software comes with a very simple and intuitive graphical user interface, providing direct visual feedback of the results and is freely available under GPLv3 license.

Density map of a neuron extracted from the Voronoï diagram
Description

AIR Tools is a MATLAB software package for tomographic reconstruction (and other imaging problems) consisting of a number of algebraic iterative reconstruction methods.

has function
need a thumbnail
Description
A commercial software traditionally used in Industry and Engineering/Science to enable fast software development and deployment of a very broad range of devices control. Labview enables graphically oriented programming (no text-based coding) and offers many ready-made tools to perform basic tasks on complex data (including image data), maths operation, data handling and representation. For Image processing and analysis, Labview offers the integrated "NI Vision" tool, used in image-based quality control of production lines with a broad selection of Image-based filters/operations. In microscopy, Labview can be used efficiently to perform any kind of instrument control, and in particular "Feedback Microscopy" (also called intelligent microscopy, etc...) where the live analysis of a captured image will update the target of the microscope to make it understand where to image efficiently.
need a thumbnail
Description

ImageJ native "Skeletonize" implementation. - works only with 8-bit binary image. A faster implementation is available as a plugin Skeletonize3D written by Ignacio Arganda-Carreras. Pros of this plugin is summarized here.

need a thumbnail
Description

Quote:

The "Angiogenesis Analyzer" allows analysis of cellular networks. Typically, it can detect and analyze the pseudo vascular organization of endothelial cells cultured in gel medium

...a simple tool to quantify the ETFA (Endothelial Tube Formation Assay) experiment images by extracting characteristic information of the network.

The outputs are network feature parameters.

Sample images

http://image.bio.methods.free.fr/ij/ijmacro/Angiogenesis/HUVEC-Pseudo-Phase-Contrast.tif.zip

http://image.bio.methods.free.fr/ij/ijmacro/Angiogenesis/HUVEC-Fluo.tif.zip

Source code

https://imagej.nih.gov/ij/macros/toolsets/Angiogenesis%20Analyzer.txt

has topic
has function
Description

Evaluates the orientation of fiber orientation pattern and plots the results in the image. It calculates gradient in x and y direction. - then calculates the eigenvector of nematic tensor, which is the orientation of the pattern.

Description

## Short Summary Quote from the plugin page: >LineageTracker offers an ImageJ based framework which is easily extendible and has the capability to track cell lineages while being specifically designed to handle large cell displacements between frames. The methods are designed for fluorescent cells and have been used to analyse Schizosaccharomyces pombe, C2C12 mouse stem cells or migrating RPE cells. This tool also allows flexible cell segmentation and extendable in all aspects. The webpage is detailed with usage from ImageJ macro. Rather than being simply a component, the plugin is indeed a framework with set of components. ## Misc info A tip from the plugin author in ImageJ mailing list (08.Sep.2015): > We have an additional script to export only a selected range of frames. I can send you that if you think LineageTracker is something for you. To be on the safe side I would try it with an older version of ImageJ. We have experienced some problems, mostly related to Java. Java 8 seems to fix most of it. ## References 2630: Application example. 2631: Plugin Paper.

has function
need a thumbnail
Description

The GDSC Single Molecule Light Microscopy (SMLM) plugins is a package of tools for single molecule localisation analysis. - Fitting Plugins: get point cloud from super resolution image. - Results Plugins: organize results. - Analysis plugins - Model plugins

need a thumbnail
Description

This workflow will batch process a directory of images: - comets should be horizontally oriented, tails to the right. Additional preprocessing is required if the gel does not match with this orientation (Rotate images, Using ImageJ/Transform Image or TransformJ plugin for example). Then using the plugin:

  1. Uneven background correction
  2. Automatic detection of comet shapes with outliers detection
  3. Automatic detection of the heads of comets (brightest region or profile analysis)
  4. Statistical values of tails, heads and Olive moments.
  • Manual correction is available.
  • Does live analysis with Micro-Manager
Description

## Algorithm See .

need a thumbnail
Description

A convenient tool for detecting lines! After the detection, detected lines are overlaid to the image. The plugin also stores these lines as ROIs, which could then easily be analyzed as vector information. Instead, the list of coordinates of all detected lines are placed in "contour" table. This could be used for redrawing or converting them as arrays. ## Algorithm See 2615.

need a thumbnail
Description

A more modern approach for denoising / smoothening before segmentation, works like Gaussian blurring but preserves edges and boundaries. Listed in Fiji update sites. ## Algorithm Algorithm description is in [this page](http://www.ipol.im/pub/art/2011/bcm_nlm/) 2612. ## Example usage Localization of Membrane bound protein in Arabidopsis meristem was analyzed using the non-local-mean filter for refining its position 2613. ## impression It's effect is somewhere between Gaussian blurring and anistropic diffusion.

has function
need a thumbnail
Description

## About TANGO software is an open-source software for Analysis of Nuclear Genome Organization. It is composed of an ImageJ plugin for batch processing and analysis, and a R package for statistical analysis. Reference: 2528 ## Some key features - Image import uses bioimage formats. - Construction of workflow in GUI by choosing filters / segmentation strategy for - Prefiltering - Segmentation - Postfiltering - Isolated nuclei could individually be inspected, deleted from list and subjected for detailed analysis. - Uses MCIB3D library as backend. - Basic usage is to segment nucleus, crop them to single nucleus objects, segment substructures within objects and measure their properties. - Optionally R can be connected to do detailed analysis of results. - Uses MongoDB to manage huge data set.

need a thumbnail
Description

# Summary VolViewer is used for viewing volume images from, for example, confocal microscopy or optical projection tomography # Features * Real-time volume rendering using an optimized 3D texture slicing algorithm. * Interactive transfer functions to independently adjust opacity and intensity for up to three data channels. * Real-time per channel thresholding, brightness and contrast operators. * On-the-fly gradient computation for local illumination. * Iso-surface computation with surface smoothing. * Section viewing in any orientation / position. * Real-time volume clipping. * 3D measurements, filters & segmentation. * Key frame interpolation for movie export. * Stereo rendering using either quad buffer or anaglyph mode. * Scripting interface to other systems, e.g. Matlab, OMERO, etc. # Project Status * Not supported anymore # Source code * [Source code](https://github.com/ut666/VolViewer "GitHub repository")

VolViewer screenshot
Description

Pandore is a standardized library of image processing operators. The current version contains image processing operators that operate on grayscale, color and multispectral, 1D, 2D and 3D images.

Link: Operator Index

has function
Description

ISE-MeshTools is a software designed by Renaud Lebrun, from the university of Montpellier II. ISE-MeshTools is a system for the processing and editing of series of 3D triangular meshes. The system provides a set of tools for editing, positioning, deforming, labelling, measuring and rendering sets of 3D meshes. Features include: • Retrodeformation for un-deforming fossils/deformed specimens • Point and curve primitives for placing the exact type of landmark points you’re interested in • Easy to use 3D interface for positioning and manipulating sets of surfaces and landmark primitives • Mesh tagging, labelling and colouring (to allow for the creation of anatomy atlases) • Mesh scalar computation and colouring (based upon curvature/thickness etc...) Lebrun, R., ISE-MeshTools, a 3D interactive fossil reconstruction freeware., 12th Annual Meeting of EAVP, Torino, Italy ; 06/2014

ISE-MeshTools screenshot
Description

Manual Tracking GUI. Many shortcut keys, and after being experienced, manual tracking can efficiently done. Post-editing capability to delete segments, merge and splitting tracks is quite useful.

has function
Description

An often used Laplacian filter for enhancing signals at object boundaries and dots. It works with XY, XYZ, XYZ-T, XYZ-T-Ch1, XYZT-C1-C2 images. Distributed as a part of ImageJ plugin FeatureJ, and included in Fiji. The second URL above is the link to its Javadoc. (imagescience.feature.Laplacian). A primer for using this class in Jython script is in CMCI Jython/Fiji cookbook: FeatureJ.

need a thumbnail
Description

The FindFoci plugins allow the identification of peak intensity regions within 2D and 3D images. The algorithm is highly configurable and parameters can be optimised using reference images and then applied to multiple images using the batch mode. Details of the benefits of training an algorithm on multiple images can be found in the FindFoci paper: 2591

has function
need a thumbnail
Description

Quote: *A GUI-based program which manually detects spots and places them into previously detected meshes. Currently the program runs from MATLAB only. *

need a thumbnail
Description

Quote: *SpotFinderZ (from now on simply SpotFinder) detects round, usually diffraction-limited spots inside bacterial cells outlined with MicrobeTracker and places them into the meshes structure produced by MicrobeTracker. The program is written in MATLAB and saves the data in the MicrobeTracker format by appending additional fields.*

has function
need a thumbnail
Description

The Fourier transform of an image produces a representation in frequency space: i.e. separated according to spatial frequency (effectively scale). The 2D amplitude map of the different spatial frequencies is symmetrical, and is commonly displayed with low spatial frequencies (large features) in the centre, highest spatial frequencies (small features) at the edges. Fourier filtering involves suppressing or enhancing features in the Fourier domain before carrying out an inverse Fourier transform to obtain a filtered real-space image. ImageJ's _Process > FFT > Bandpass Filter_ implements two common Fourier-filtering functions: 1. filtering for specific sizes of feature in an image by selecting minimum and maximum feature sizes (selecting a radial band of frequencies in Fourier space); 2. filtering out repetitive horizontal or vertical stripes by cutting out a zero-frequency stripe in the orthogonal direction in frequency space. The example image above shows the effect of filtering for 2 feature size ranges: 0-8 pixels, and 8-256 pixels; where the former appears "flattened" or washed-out, and the latter very blurred. The small images displayed to the lower-right of each filtered image correspond to the mask applied to the Fourier transform. Such filtering can be useful prior to global thresholding, for noise suppression, etc.

ImageJ bandpass screenshot
Description

Implementation of some image correlation spectroscopy tools

need a thumbnail
Description

Fluorescence spectroscopy by image correlation is a technique that allows analysing and characterizing the different molecular dynamics from a sequence of fluorescence images. Many image correlation techniques have been developed for different applications but in particular to study the mechanisms of cell adhesion during migration. These techniques can be used with most imaging modalities: e.g. fluorescence widefield, confocal microscopy, TIRFM. They allow to obtain information such as the density in molecules, diffusion coefficients, the presence of several populations, or the direction and speed of a movement corresponding to active transport when spatial and temporal correlations are taken into account (STICS: Spatio-Temporal Image Correlation Spectroscopy).

This plugin is based on ICS_tools plugin by Fitz Elliott, available here.

Some bugs have been removed, ROI does not need to be squared, fitting is weighted in order to give more weight to the smaller lags (temporal or spatial)

Exemple of use on sample data [fluorescent beads](http://biii.info/node/2577 "Beads") - Select an ROI, start by ICS to get the right PSF size - Then run TICS and select diffusion, or diffusion plus flow model. Remove the first line (autocorrelation) which corresponds to the noise autocorrelation before fitting.

interface
Description

The root tools help to efficiently measure the following characteristics of plant roots: the angle of the opening of the whole root the depth to which it goes down the number of roots at multiple depths (for example 30cm, 35cm, ...) the diameters of the roots at multiple depths (for example 30cm, 35cm, ...)

Root tools
Description

A collection for tracking microtubule dynamics, written in Python.

has function
Description

HDF5 is a data format for storing extremely large and complex data collections. This Fiji/ImageJ HDF5 plugin saves and loads 2D - 5D datasets with flexible options.

In Fiji, the plugin is downloadable via update site "HDF5".

Description

The software is designed for pathologists. Image analysis protocols are built from graphical user interfaces; there is no need for programming experience or an extensive training program. Cloud and deployed solutions are available. Visiopharm can be employed to develop workflows (apps) for the user. Modular structure with multiple packages: VisiomorphDP™ TissuemorphDP™ Arrayimager™ Tissuealign™ Visiomorph™ Tissuemorph™ Microimager™ Fluoimager™

Visiopharm screenshot
Description

Count bacterial colonies on agar plates and measure the occupied surfaces. The user has to provide a selection (roi) of the area that will be analyzed. He can than run the segmentation and if necessary correct the results. In a third step he can run the counting and measurement.

has function
Description

An easy to use, image analysis software package that enables rapid exploration and interpretation of microscopy data.

PhenoBrowser
Description

In this case study, MATLAB, the Image Processing and Signal Processing toolboxes were used to determine the green intensities from a small portion of a microarray image containing 4,800 spots. A 10x10 pattern of spots was detected by averaging rows and columns to produce horizontal and vertical profiles. Periodicity was determined automatically by autocorrelation and used to form an optimal length filter for morphological background removal. A rectangular grid of bounding boxes was defined. Each spot was individually addressed and segmented by thresholding to form a mask. The mask was used to isolate each spot from surrounding background. Individual spot intensity was determined by integrating pixel intensities. Finally, integrated intensities were tabulated and saved to a data file for subsequent statistical analysis to determine which genes matter most.

Description

Rigid registration of time series in 3D. A video tutorial is available (be careful of sounds, the video automatically starts!): [Sample Drift Correction Following 4D Confocal Time-lapse Imaging](http://www.jove.com/video/51086/sample-drift-correction-following-4d-co…)

has function
Description
MountainsMap is a surface imaging and metrology software published by the company Digital Surf. Its main application is micro-topography, the science of studying surface texture and form in 3D at the microscopic scale. The software is used mainly with stylus-based or optical profilometers, optical microscopes and scanning probe microscopes. MountainsMap is mainly offered as embedded or optional OEM analysis software by most profilometer and microscope manufacturers, usually under their respective brands; it is sold for instance as: MountainsMap - X on Nikon's microscopes Leica Map on Leica's microscopes ConfoMap on Carl Zeiss' microscopes
need a thumbnail
Description

Normalize the orientation of the images of the Zebrafish embryos.

In the documentation webpage, the aim of the workflow is to normalize the orientation of the images of the Zebrafish embryos, find the point of injection of tumor cells and measure the distribution of Cy3 stained tumor foci.

ImageJ macro implementation of the Workflow described in Ghotra et al (2012). Note that currently only the angle and orientation normalization is implemented in this version.

Sample images are linked in the documentation webpage. 

has function
Description

This Matlab code demonstrates an edge-based active contour model as an application of the Distance Regularized Level Set Evolution (DRLSE) formulation.

initialisation
Description
Description

Using a text file containing 3D point coordinates as reference pairs, 3D image stack is transformed.

Description

Variational algorithms to remove stationary noise. Application to microscopy imaging. This plugin allows to denoise images degraded with stationary noise. Stationary noise can be seen as a generalization of the standard white noise. Typical applications of this plugin are:

- Standard white noise denoising using a total variation and fidelity term minimization. Even though total variation denoising is not the state of the art (regarding SNR improvement), it may be very valuable for further tasks such as image seg- mentation).

- Destriping (the problem that motivated us to develop these ideas). 

- Deconvolution (even though most users won't be able to use this feature).

- Cartoon + texture decomposition which might be useful to compress images, analyse textures or simplify segmentation like tasks.

has topic
has function
Description

An automated MATLAB tool for segmentation of surface stained cells

has function
need a thumbnail
Description

A clear tutorial on how to write a MATLAB script to segment clustered cells.

The full script is downloadable near the bottom of the article. 

Description

A workflow template to analyze subcellular structures in fluorescence 2D/3D microscopy images based on a Fiji plugin **Squassh** is described in Rizek et al (2014).

The workflow employs detecting, segmenting, and quantifying subcellular structures. For segmentation, it accounts for the microscope optics and for uneven image background. Further analyses include both colocalization and shape analyses. However, it does not work directly for time-lapse data. A brief summary note can be found here.

Description

Matlab toolbox to analyze single molecule mRNA FISH data. Allows counting the number of mature and nascent transcripts in 3D images. See 2513. Following toolboxes are required: - Optimization toolbox - Statistics toolbox - Image processing toolbox - (Optional) Parallel processing toolbox


Input data type: 3D image

Output data type: CSV

has function
Description

The linked webpage presents a collection of ImageJ macros for Intelligent Imaging (Feedback to microscope system for the secondary scan). 

An ImageJ macro able to control some microscopes (Micro-manager or Leica CAM controlled) to acquire high resolution images of only some structures (e.g. isolated cells) or events (e.g. mitosis) within a sample. The scan is sequenced as a primary (low resolution monitoring) scan and a secondary (high resolution, multi-dimensional) scan.

has function
Description

A Jython script using the plugin : Register Virtual Stack Slices It takes a sequence of image slices stored in a folder, and delivers a list of registered image slices (with enlarged canvas). One of the images in the sequence can be selected by the user as reference and it will remain intact. The plugin can perform 6 types of image registration techniques: - Translation - Rigid (translation + rotation) - Similarity (translation + rotation + isotropic scaling) - Affine - Elastic (via bUnwarpJ with cubic B-splines) - Moving least squares All models are aided by automatically extracted SIFT features.

has function
need a thumbnail
Description

The rapidSTORM project is an open source evaluation tool that provides fast and highly configurable data processing for single-molecule localization microscopy such as dSTORM. It provides both two-dimensional and three-dimensional, multi-color data analysis as well as a wide range of filtering and image generation capabilities. The general operation of rapidSTORM is described in Wolter et al (2012).

has function
Description

This macro is a plugin macro to the "Intelligent Imaging" workflow. It detects the Cytoo patterns (specific fluorsecence channel) and computes the occupancy (number of cells) of each pattern by analyzing the images of the DAPI channel. The analysis function can be easily extended to, for instance, only select the cells that are well spread on the patterns (by analyzing a third channel with a properly chosen marker of the cytoplasm).

need a thumbnail
Description

The Measure Rosette Area Tool allows to measure the area of the rosettes of arabidopsis plants.

See: http://dev.mri.cnrs.fr/projects/imagej-macros/wiki/Measure_Rosette_Area…

Example data: http://biii.eu/node/1146, http://biii.eu/node/1145

has function
Description

An example macro introduced in the documentation page of the ImageJ plugin Trainable Weka Segmentation (in Fiji, it's bundled). A segmentation protocol based on machine learning. Full macro is available in the "Download" Link. 

This plugin can be trained to learn from the user input and perform later the same task in unknown (test) data. Weka: it makes use of all the powerful tools and classifiers from the latest version of Weka. Segmentation: it provides a labeled result based on the training of a chosen classifier. Trainable Weka Segmentation Complete macro example is at the end of the page.

has topic
has function
Description

[as of 20180524, the website is temporary not functioning do to web defacement - please check again later] This tutorial will exemplify basic rapidSTORM usage by showing how to convert an Andor SIF acquisition to a super-resoluted image with rapidSTORM.

Description

A deconvolution component applicable to confocal and STED microscopy. The MATLAB function fo this package implements the SGP method for n-dimensional object deblurring with the option of boundary effects removal. Although this is a preliminary version, results seem to be good from their paper (Zanella et al 2013).

has function
Description

CellDetector can detect cells (or other objects) in microscopy images such as histopathology, fluorescence, phase contrast, bright field, etc. It uses a machine learning-based method where a cell model is learned from simple dot annotations on a few images for training and predict on test sets. The installation requires some efforts but the instruction is well explained. Training parameters should be tuned for different datasets, but the default settings could be a good starting point.

has function
Description

This plugin will return on a full 256-grey level image (limitation in this version) or on a ROI several texture features such as described in Haralick publication. Can be run in batch mode.

need a thumbnail
Description

This Javascript works in ImageJ to measure 3D intensity profile along cylindrical space with variable radius.

Description

These two similar KNIME workflow solutions take 3D data stacks to segment the spots first, using local thresholding with subsequent morphological operations in order to remove noise. Colocalization is then defined by overlapping or center point distance between segmented objects. Further filtering such as overlapping ratio or distance range is done through KNIME table processing.

Two different types are available. 

  1. colocalization based on overlapping
  2. colocalization based on distance between object centers

Sample images: Smapp_Ori files

Chapter 4 in the documentation. 

Description

u-Track is a client-side OMERO MATLAB application implementing the sophisticated multiple-particle tracking algorithm of Jaqaman et al. . It works on data previously imported into an OMERO server, and produces results in the form of MATLAB data structures as well as providing functionality to visualise these results.

has function
Description

This simple KNIME workflow solution tracks 2D objects/cells in time series. After a few intensity based preprocessing steps, objects/cells are segmented first, then it uses Fiji TrackMate LAP method for the tracking task.

Documentation starts from p23 of the linked PDF. 

Example Image: mitocheck_small.tif (2.9M)

has function
Description

These two KNIME workflow solutions are similar: first one detects nuclei and spots inside the nuclei without taking care of surrounding regions, i.e. mitochondria. The second one provides the full solution including spots in mitochondria.

see section 2.4 for KNIME workflow. Section 2.3 is also available, using Fiji. 

Sample image: hela-cells.tif (674k x 3)

has function
Description

For each ROI, provides the ratio of pixels over a given threshold over the total number of pixels in the ROI.

has topic
Description

Very simple application that lets you load your time-lapse intensity data to generate the normalized FRAP recovery curve and perform exponential curve fitting.

Quote: The user can handle simultaneously large data sets of raw data, visualize fluorescence recovery curves, exclude low quality data, perform data normalization, extract quantitative parameters, perform batch analysis and save the resulting data and figures for further use. Our tool is implemented as a single-screen Graphical User Interface (GUI) and is highly interactive, as it permits parameterization and visual data quality assessment at various points during the analysis.

Description

This protocol perform a median filter on the active sequence using the ImageJ rank filter plugin. Then, it converts the result back into Icy for display.

An example showing passing data between ICY and ImageJ using ImagePlus object. 

Description

This tool adds to ImageJ functions to build and organize montages. It comes with the ImageJ installer but can also be downloaded from the ImageJ wiki. A video tutorial is available.

has topic
has function
need a thumbnail
Description

CellX is an open-source software package of workflow template for cell segmentation, intensity quantification, and cell tracking on a variety of microscopy images with distinguishable cell boundary.

Installation and step-by-step usage details are described in Mayer et al (2013). 

After users provide a few annotations of cell sizes and cell boundary profiles, it tries to match boundary profile pattern on cells thus provide segmentation and further tracking. It works the best on cells without extreme shapes and with a rather homogeneous boundary pattern. It may not work well on images with cells of sizes only a few pixels. Its output comprises control images for visual validation, text files for post-processing statistics, and MATLAB objects for advanced subsequent analysis.

Description
Description

The Fiji distribution of ImageJ comes with several manual tracking tools, two of which are particularly useful:

* _Plugins->Tracking->Manual Tracking_

* _Plugins->Tracking->Manual tracking with TrackMate_ (TrackMate is an advanced automatic tracking tool, with the option for manual editing of tracks)

The _Manual Tracking_ plugin is quick to use, intuitive and produces easy-to-understand output. TrackMate has the advantage that automatic detection and linkage can be combined with manual input.

Update sites

MtrackJ (see the component page here) can be installed via Fiji update sites. It has many shortcut keys enabled so for manually tracking many data, it will become quite efficient as you get used to the short-cut key operation.

Pre-processing

Pre-processing steps before manual tracking might include:

* denoising and/or deconvolution

* flicker and photobleaching correction, e.g. using Fiji's _Image->Adjust->Bleach Correction_

* flat-field correction, and/or bandpass (ImageJ's _Process->FFT->Bandpass filter_) according to the size of the features of interest

has function
Description

Image processing library for Python >The scikit-image SciKit (toolkit for SciPy) extends scipy.ndimage to provide a versatile set of image processing routines. It is written in the Python language. This SciKit is developed by the SciPy community. All contributions are most welcome!

has function
Scikit logo
Description

This protocol takes a folder containing images as input and extract each channel in a separate sub folder.

need a thumbnail
Description

This method allows to compute a threshold that preserves the moments of an image. In ImageJ/Fiji, you can access it in Image->Ajust->Threshold and choose Moments in the list. In Aphelion, the tool is in Segmentation->Threshold->AphImgMomentThreshold The original paper is 2449

need a thumbnail
Description

Tracks a cell in a 2D video using active contours, and produces a list of ROI where intensity is measured and reported into a workbook. The cell must be first delineated with a ROI in the first image of the video.

need a thumbnail
Description

SlideToolkit is a collection of command-line tools to assist with the automated histology analysis of whole-slide images. The publication linked in the "reference" details the actual workflow. 

This includes tools to organize the data, perform tiling and subsequent batch processing of the generated tiles in a cell profiler pipeline. All the tools are designed to run on a single PC or on a HPC system. The scripts in the toolkit are on github under MIT licence.

has topic
Description
Description

Download the protocol,use and modify in Icy. It permits to detect spot with wavelet spot detector block. Input : loop on a folder Outputs: excel, binary, and detection screenshot

has function
need a thumbnail
Description

>OpenSlide is a C library that provides a simple interface to read whole-slide images (also known as virtual slides). Python and Java bindings are also available. The Python binding includes a Deep Zoom generator and a simple web-based viewer. The Java binding includes a simple image viewer.  

has topic
has function
Description

This workflow classifies, or segments, the pixels of an image given user annotations. It is especially suited if the objects of interests are visually (brightness, color, texture) distinct from their surrounding. Users can iteratively select pixel features and provide pixel annotations through a live visualization of selected feature values and current prediction responses. Upon users' satisfaction, the workflow then predicts the remaining unprocessed image(s) regions or new images (as batch processing). Users can export (as images of various formats): selected features, annotations, predicted classification probability, simple segmentation, etc. This workflow is often served as one of the first step options for other workflows offered by ilastik, such as object classification, automatic tracking.

Description
Well maintained and documented project that includes a core tracking incl. GUI as well as Matlab toolboxes to (1) correct tracking results and (2) analyze fly behavior. >Ctrax is an open-source, freely available, machine vision program for estimating the positions and orientations of many walking flies, maintaining their individual identities over long periods of time. It was designed to allow high-throughput, quantitative analysis of behavior in freely moving flies. Our primary goal in this project is to provide quantitative behavior analysis tools to the neuroethology community, thus we've endeavored to make the system adaptable to other labs' setups. We have assessed the quality of the tracking results for our setup, and found that it can maintain fly identities indefinitely with minimal supervision, and on average for 1.5 fly-hours automatically.
need a thumbnail
Description

Requires Matlab Runtime Environment or Matlab. Source code (m-files) are downloaded. Software availability: AVeMap was developed under MATLAB (MathWorks). It is available as an executable, multiplatform program, together with source codes and documentation here, and the source code is also available as Supplementary Software. For practical reasons, this executable version, which does not require MATLAB, runs on a single processor. For users who want to customize the software and/or need the power of parallel computing, an installation of MATLAB with its 'parallel' and 'image processing' toolboxes is needed. Note that, even with the executable version, the velocity fields are stored for further analysis. The add-on AVeMap+ uses these AVeMap-computed velocity fields to generate heat map tables. It is available with the same link.

need a thumbnail
Description

The Leaf Infection Tools allow to measure the area of leaves, of two stainings in different channels and of the overlap region of the two stainings. 

See: http://dev.mri.cnrs.fr/projects/imagej-macros/wiki/Leaf_Infection_Tools

Test image: http://biii.eu/node/1143

a leaf with infection pattern
Description

Analyzing Ca2+ sparks

ImageJ plugin to detect and measure Ca2+ sparks in linescan images, described in Picht et. al. (2007). The algorithm is based on that described by Cheng et al. (1999). Care should be taken to ensure that detections belong to 'true' events, as without any additional background subtraction steps the algorithm is not appropriate for images in which the baseline fluorescence varies substantially.

Description

This workflow classifies objects based on object-level features (e.g. intensity based, morphology based, etc) and user annotations. It needs segmentation images besides the raw image data. Segmentation images can be obtained from ilastik pixel classification, or binary segmentation images from other tools. Within the object classification, one can prefilter objects through thresholds (on pixel probability image) or object sizes (on segmentation image). Outputs are predicted classification label images. Selected features can also be exported. Advanced users also have possibilities to add customized (object) features for classification in a simple plugin fashion through python scripts.

Description

This workflow is used to track multiple (appear/disappear, dividing and merging) objects in presumably big 2D+t or 3D+t datasets. It is best suitable for roundish objects or spots. Tracking is done through segmentation, which can be obtained from ilastik pixel classification, or imported from other tools. Users should provide a few object level labels, and the software predicts results on the rest of the image or new images with similar image characteristics. As a result, all objects get assigned random IDs at the first frame of the image sequence and all descendants in the same track (also children objects such as daughter cells) inherit this ID.

need a thumbnail
Description

The Artemia Tools help to calculate the normalized redness of Artemia in color images.

See: http://dev.mri.cnrs.fr/projects/imagej-macros/wiki/Artemia_Tools

Test images: http://biii.eu/node/1139

Artemia color analysis toolset
Description

This tool allows for extraction of image series from Olympus Slide Scanners. These VSI files usually contain several images that are too big to load into memory (>50k x 50k pixels). It was written and tested on Fiji and is available from a Fiji Update Site: http://fiji.sc/List_of_update_sites

has function
VSI screenshot
Description

In this human cytoplasm-nucleus translocation assay, learn how to load a previously calculated illumination correction function for two separate channels, measure protein content in the nucleus and cytoplasm, and calculate the ratio as a measure of translocation. This is a clumpy cell type, so studying the settings in primary object identification may be helpful for users interested in the more advanced options that module offers. More about these images can be found at the BBBC.

need a thumbnail
Description

This protocol first extracts the cell nuclei from a given fluorescence channel (full labeling), and grows a contour from each nucleus to extract the cell edge in another fluorescence channel (membrane-labeling).

Description

The Macro processes a composite picture in ImageJ/Fiji and outputs a color-balanced merged RGB image.

To calculate the white balance, a rectangle at coordinates (x=100, y=100) and of size (w=100 pixels, h=100 pixels) is used. These values can be changed to make sure that a background region is taken for the calculation in the line: makeRectangle(100,100,100,100). The user could be prompted to draw the region by removing the signs // in the line: // waitForUser("Please draw a region in the background");

need a thumbnail
Description

If your images are corrupted by a strong dominant Gaussian noise you can try this simple filter. It is based on thresholding in the DCT domain and is usually vastly superior to typical Gaussian filtering in term of detail preservation / noise reduction trade-off. The filter unfortunately introduces some block like artifacts that can be mitigated by averaging out overlaping shifted windows (as implemented in the Matlab version) and performing maximum intensity projection after the filtering: As such the filter is way more adapted to process 3D stacks that you plan to maximum intensity project than to process single z slice images.

has function
Description

This macro allows to interact with a large, single channel, z-stack (possibly exceeding the main memory of the computer) and to extract a volume of interest by marking several reference points.

has function
The extracted Volume of Interest  (3D rendering)
Description

Task

Quantify the length of microtubules (MT) and the MT average density per cell.

Workflow descriptions

Simple two step workflow, allowing visual & manual correction of microtubule between the 2 steps. Batch measurement of microtubule lengths for multiple images is achieved by segmenting the MTs and then their skeletonizations. The number of pixels in the microtubule is proportional to their length, so the length can be estimated.

Script

Workflow is written as an ImageJ macro (Fiji) with following steps:

1. The enhancement of tubular structure by computing eigenvalues of the hessian matrix on a Gaussian filtered version of the image ( sigma 1 pixel), as implemented in the tubeness plugin.

2. The tubules were then thresholded , and structures containing less than 3 pixels were discarded.

3. If needed, a visual check and correction of segmented microtubule is then performed.

4. After correction, segmented MTs were then reduced to a 1-pixel thick line using the skeletonize plugin of Fiji. The length of the skeletonized microtubules was then directly proportional to their length.

5. Data were grouped by condition and converted back to micrometers units under Matlab for the statistical tests.

Pitfalls

Commented but not that general without editing some fields in the macros.

Sample Data

Sample data and workflow (see above URL) can be accessed by - login: biii - password Biii!

Misc

3D version also available here. Use of components Skeletonize and Tubeness Filter

need a thumbnail
Description

This macro can stitch a (Z,T,C) data set with virtually no limit on the number of Z slices and time frames. The input to the macro is a folder with the raw tiff images (one image per file) as typically exported by motorized microscopes. These files must all be stores in the same folder and the file naming should ideally comply to OME-TIFF. The macro is however quite flexible: Only --X, --Y and --Z fields with user defined number of digits are compulsory. --T, --C and --L fields with user defined number of digits are necessary for multiple time frames / channels data sets. A compatible data set is provided as a .zip archive. Before processing it unzip it to a given location. The stitching is performed in a reference Z slice (and in a specific reference time frame and channel). The same displacements are applied to all the Z slices, time frames and channels. Before starting the batch processing a montage with the original images of the selected Z slice / time frame / channel is displayed together with the stitched image in this stack. If you are not satisfied with the result you can select another reference. The stitching is then performed time frame by time frame and slice by slice and the stitched images are exported to a single user defined output folder. The macro can also process a data set with multiple channels, the stitching is then computed once on a reference channel and then applied to the other channels.

has topic
has function
Description

This macro builds a stitched image from a muti-position 3D + time hyperstack. The XY positions of the montage should be coded as channels in the input hyperstack. Channel ordering can be configured in the dialog box to adapt to Column/Row and Meander/Comb configurations: The images should appear in this order when browsing the hyperstack with the channel slider. Fine stitching is supported (requires sufficient overlap between the views). The XY displacements of each field of view for stitching are computed for a single reference (Z,T) slice (user configurable) and applied to all slices (Z and T).

Description

Marker-controlled Watershed is an ImageJ/Fiji plugin to segment grayscale images of any type (8, 16 and 32-bit) in 2D and 3D based on the marker-controlled watershed algorithm (Meyer and Beucher, 1990). This algorithm considers the input image as a topographic surface (where higher pixel values mean higher altitude) and simulates its flooding from specific seed points or markers. A common choice for the markers are the local minima of the gradient of the image, but the method works on any specific marker, either selected manually by the user or determined automatically by another algorithm. Marker-controlled Watershed needs at least two images to run: The Input image: a 2D or 3D grayscale image to flood, usually the gradient of an image. The Marker image: an image of the same dimensions as the input containing the seed points or markers as connected regions of voxels, each of them with a different label. They correspond usually to the local minima of the input image, but they can be set arbitrarily. And it can optionally admit a third image: The Mask image: a binary image of the same dimensions as input and marker which can be used to restrict the areas of application of the algorithm. Set to "None" to run the method on the whole input image. Rest of parameters: Calculate dams: select to enable the calculation of watershed lines. Use diagonal connectivity: select to allow the flooding in diagonal directions.

need a thumbnail
Description

Analyzing ER, PR, and Ki-67 immunohistochemistry

ImmunoRatio is an ImageJ plugin to quantify haematoxylin and DAB-stained tissue sections by measuring the percentage of positively stained nuclear area (labeling index), described in [bib]2452[/bib].

Notes for use:

  • It is important to read the URL instructions and original paper to understand what is being measured. In particular, the primary measurement made is percentage of the total nuclear area, not the percentage of detected nuclei (the latter being the more common method of assessing e.g. Ki67). This may be further modified by the Result correction equation.
  • Ultimately ImmunoRatio relies on thresholding (color deconvolved [bib]2451[/bib]) images to define 'nucleus' vs 'non-nucleus' regions according to staining intensity. Therefore dark artefacts, such as tissue folds, are likely to cause errors.
  • The pixel size is not read automatically from the image, but rather the source image scale should be entered into the dialog box - and the image rescaled accordingly prior to analysis. This scale value is the inverse of the value normally found for pixel width and pixel height under Image -> Properties... (i.e. pixel width & height are given in microns per pixel; the dialog box asks for pixels per micron).

Web application: ImmunoRatio

Example Image: Sample ImmunoRatio results

References

  1. [2452] Tuominen VJRuotoistenmäki SViitanen AJumppanen MIsola J.  2010.  ImmunoRatio: a publicly available web application for quantitative image analysis of estrogen receptor (ER), progesterone receptor (PR), and Ki-67.. Breast Cancer Res. 12(4):R56.
  2. [2451] Ruifrok ACJohnston DA.  2001.  Quantification of histochemical staining by color deconvolution.. Anal Quant Cytol Histol. 23(4):291-9.
has topic
has function
Description

This macro can be used to un-wide a tubular structure and flatten its surface (like peeling of and flattening the skin of a banana). The macro can only process a single channel 3D stack but it is easy to process multiple channels by exporting and importing ROI manager selections. Technically the macro computes the radial average intensity projection inside a ring centred on the radial symmetry axis of the object. The final image is a radial mapping of the intensity (radial angle along X, axial length along Y).

The example image is available in the documentation link. 

has function
Description

This macro implements a filter that is meant to attenuate close to parallel intensity stripes in an image, such as often happening in light sheet microscopy. The results are usually decent even when the stripes show a large angular spread due to light sheet refraction at the sample surface. The filter can process a 3D stack but the processing is performed slice by slice.

Example image is available in the documentation link. 

Description

Morphological Segmentation is an ImageJ/Fiji plugin that combines morphological operations, such as extended minima and morphological gradient, with watershed flooding algorithms to segment grayscale images of any type (8, 16 and 32-bit) in 2D and 3D. Morphological Segmentation runs on any open grayscale image, single 2D image or (3D) stack. If no image is open when calling the plugin, an Open dialog will pop up. The user can pan, zoom in and out, or scroll between slices (if the input image is a stack) in the main canvas as if it were any other ImageJ window. On the left side of the canvas there are three panels of parameters, one for the input image, one with the watershed parameters and one for the output options. All buttons, checkboxes and input panels contain a short explanation of their functionality that is displayed when the cursor lingers over them. Image pre-processing: some pre-processing is included in the plugin to facilitate the segmentation task. However, other pre-preprocessing may be required depending on the input image. It is up to the user to decide what filtering may be most appropriate upstream.

need a thumbnail
Description

This macro batch processes all the 2D images (tif and jpg files) located in a user defined folder by calling Fiji Weka trainable segmentation to classify each pixel, and reports the areas of each class in a human readable results table. The classifier to be applied to each image should be previously trained on a representative image by an expert and exported to file (Save classifier) into the image folder to be processed.

has function
Description

[no download link, this description itself explains the steps to quantify staining in tissue sections] The Color Deconvolution plugin for ImageJ can be used to digitally separate up to three stains from brightfield images, after which standard ImageJ commands can be used. The algorithm is described in Ruifork and Johnston (2001). **However**, it is **very** important to take into consideration the caveats on the linked URL. In particular, note that: - Stain colors depend on numerous factors, such as the precise stains and scanner; therefore, the 'default' stain vectors (used to define the colors) are unlikely to be optimal and may be very inaccurate. See the URL instructions for how to create new stain vectors. - Pixel values should be interpreted with extreme caution; in particular, note the warning regarding 'brown' staining that *attempting to quantify DAB intensity using this plugin is not a good idea*. Note, the pixel values provided by this plugin are 8-bit and **not** equivalent to 'optical densities' frequently presented in the literature. Color deconvolution is particularly helpful in separating stains so that stained regions can be detected (e.g. by setting a threshold), and then the number or areas of stained structures may be quantified. Two potential approaches would be: 1. If one measurement should be made for the entire image: - *Image > Adjust > Threshold...* - *Edit > Selection > Create Selection* - *Analyze > Measure* 2. If distinct structures should be measured: - *Image > Adjust > Threshold...* - *Analyze > Analyze Particles...*

has topic
has function
Description

This macro segments blood vessels in a 3D stack. It is suited for well-contrasted images (low background) and works better if the width of the vessels of interest is reasonably uniform.


Sample image: 1

sample image: 2

has function
Description

Autofocus hyperstack macro:

Select the in focus frame from each slice of a hyperstack and create a new stack of just the in focus frames. Based on algorithm F-11 "Normalized Variance".

Original macro by Andy Weller.

need a thumbnail
Description

Generation of Kymographs using 2D+t images. In the generated kymographs, objects can be tracked and the results are visualized.

has function
Description

This macro performs measurements of average and standard deviation intensity inside wells of a protein microarray (the number of wells is limited to 250, the image should be cropped for larger arrays). The macro requires the "ImageJ plugins toolkit". To ensure compatibility with Fiji you should download the version 1.6.1The installation instructions can be found here, it only consists in un-compressing the .jar file from the previous archive to Fiji plugins folder.


sample image: link

has function
Description

A commercial image analysis software. It's interface allows to easily perform measurements and image analysis. Your actions can be recorded and a macro (in a basic script language) can then be created. Almost no knowledge in programming is needed. You can also use python. A SDK is also available to develop stand alone applications in c++. Additional modules allow to use specific operations (3D operators... Examples of available categories of operators : filtering, edge detection, mathematical morphology, segmentation, Frequency operations, mathematical/logical operations, measurements...

need a thumbnail
Description

Quote:

This pipeline shows how to identify smaller objects (foci) within larger objects (nuclei) and how to use the Relate module to establish a relationship between the two as well as perform per-object aggregate measurements (such as number of foci per nucleus). Sample images are included in the download package.

Description

Quote:

Measuring the colocalization between fluorescently labeled molecules is a widely used approach to measure the degree of spatial coincidence and potential interactions among subcellular species (e.g., proteins). This example shows how the object identification and RelateObjects modules are used to measure the degree of overlap between two fluorescent channels. Sample image is included in the download package.

Description

Microtubule end tracking in live cell fluorescent images of Drosophila oocyte involves overcoming the following challenges, which can be tackled by a series of preprocessing steps and tracking described in Parton et al (2011)

  • illumination flicker & photobleaching: suppress by normalising intensities, e.g. using Image->Adjust->Bleach Correction in Fiji/ImageJ
  • uneven illumination: Fourier bandpass filtering (e.g. Process->FFT->Bandpass Filter) preserves features within a selected size range
  • high background / poor contrast: foreground filter, e.g. Temporal Median filter
  • tracking: e.g. TrackMate in Fiji/ImageJ (segmentation using DoG detector)
has function
Description

Simple workflow description for ImageJ, step-by-step description for delineating focal adhesions, count and characterize their positions.  

Measurement of dynamics is not involved.

Description

This macro and plugins suite for ImageJ (and Fiji) serves to measure the velocity of moving structures and visualize them, from image time series (2D over time).

The module can be installed in ImageJ as a Macro Menu and each function/component can be called separately. The full workflow consists in calling some, or all, the functions sequentially in order to get from the image preparation (e.g. filtering and visualization of tracks) to the production of the kymographs (time vs. distance plot) and their analysis (retrieving the velocities).

Here is the full workflow sequence:

  • Load image sequence
  • Crop and time-filter the image sequence ("Walking average" plugin)
  • Generate tracks by z-projection ("Stack difference" plugin)
  • Select tracks and restore them in the original stack.
  • execute plugin "multiple kymograph"
  • Analyse: select edges of moving tracks graphically and quantify movement in a table.

input: 8-bit, 16-bit stacks, 2D in time. Calibrated is better for meaningful velocity measurements.

ouput: the kymograph image, the velocity measurements tables.

Requires ImageJ version: 1.33.n minimum.

Example of applications:

  • velocity of moving objects/ structures with sharp edges, incl. the velocity of microtubules (and their plus ends),
  • the velocity of vesicles or particles along a 2D path
  • the velocity of migration of the edge of a cell or a multicellular group
  • retraction velocity of contractile bundles (e.g. actin fibers) or multicellular tissues after mechanical disruption (e.g. laser surgery)
Description

An ActionBar is a simple annotated text document that has snippets of Imagej macros or Beanshell arranged into buttons. This tool is very useful when creating custom work flows integrating multiple components. Each component can be linked to a button for a more streamlined and accessible workflow.

has function
ActionBar screenshot
Description
Python-bioformats is a Python wrapper for Bio-Formats, a standalone Java library for reading and writing life sciences image file formats. Bio-Formats is capable of parsing both pixels and metadata for a large number of formats, as well as writing to several formats. Python-bioformats uses the python-javabridge to start a Java virtual machine from Python and interact with it. Python-bioformats was developed for and is used by the cell image analysis software CellProfiler (cellprofiler.org). PyPI record: https://pypi.python.org/pypi/python-bioformats Documentation: http://pythonhosted.org/python-bioformats/ GitHub repository: https://github.com/CellProfiler/python-bioformats Report bugs here: https://github.com/CellProfiler/python-bioformats/issues python-bioformats is licensed under the GPL license to be compatible with the copy of Bio-Formats that is distributed with the package, but is compatible with a BSD license if loci_tools.jar is replaced with SCIFIO jars. See the accompanying file LICENSE for details.
need a thumbnail
Description
The javabridge Python package makes it easy to start a Java virtual machine (JVM) from Python and interact with it. Python code can interact with the JVM using a low-level API or a more convenient high-level API. PyPI record: https://pypi.python.org/pypi/javabridge Documentation: http://pythonhosted.org/javabridge/ GitHub repository: https://github.com/CellProfiler/python-javabridge Report bugs here: https://github.com/CellProfiler/python-javabridge/issues python-javabridge is licensed under the BSD license. See the accompanying file LICENSE for details.
need a thumbnail
Description

## Features >The IJBlob library indentifying connected components in binary images. The algorithm used for connected component labeling is: >Chang, F. (2004). A linear-time component-labeling algorithm using contour tracing technique. Computer Vision and Image Understanding, 93(2), 206–220. doi:10.1016/j.cviu.2003.09.002 ##Reference Wagner, T and Lipinski, H 2013. IJBlob: An ImageJ Library for Connected Component Analysis and Shape Analysis. Journal of Open Research Software 1(1):e6, DOI:

need a thumbnail
Description

A workflow combining ImageJ macro and manually using Trainable Weka Segmentation plugin for counting clumped cells.

Description

An ImageJ macro for calculating empty surfaces on histological slices (ex: tubules in a kidney).

has topic
Description

Particle detection is based on "Analyze Particles" in ImageJ. It probably could also be used in spot detection, not limited to centromere. >This macro is described in Bodor et al. (2012). The macro recognizes centromere or kinetochore foci in Delta Vision or TIFF images and determines their centroid position. Fluorescent intensities are then measured for each centromere by placing a small box around the centroid position of the centromere. The peak intensity value within the box is corrected for local background by subtraction of the minimum pixel value. This process results in an accurate measurement of large numbers of centromere or kinetochore-specific signals. Following papers uses CRaQ (picked up, maybe more): - Fachinetti et al. (2017), Developmental Cell 40, 104–113, - Guo et al. (2017) Nature Communications volume 8, Article number: 15775 (2017) doi:10.1038/ncomms15775 - Lgosdon et. al. (2015) J Cell Biol Mar 2015, 208 (5) 521-531; DOI: 10.1083/jcb.201412011 - Bodor et al. (2014), eLife. 2014; 3: e02137

has function
Description

A menu item in ImageJ that allows you to inspect a 3D stack with orthogonal views (XY, XZ, YZ planes). Slicing plane could be interactively moved by dragging crosses. Pedro Almada wrote a plugin to save the current orthogonal views as montage. ## ImageJ Macro Usages [Save orthogonal views | OrthoSaver](http://uic.igc.gulbenkian.pt/macros/OrthoSaver.ijm) >ImageJ's orthogonal viewer for 3D stacks doesn't let you easily save the current orthogonal view. This macro, once installed, lets users create a montage with the currently open orthogonal views and selection guides. To use it, open an image z-stack and open the orthogonal viewer. With the mouse, choose which are the sections of interest to you and without moving the mouse, press F2. You'll get a montage of the currently selected orthogonal view.

has function
need a thumbnail
Description

ITK-SNAP is a software application used to segment structures in 3D medical images. It can also be used as a 3D annotation tool for deep learning. It is based on ITK, VTK libraries.

Description

Metamorph provides all tools needed to perform analysis of acquired images with user-friendly application modules for biology-specific analysis such as cell signaling, cell counting, and protein expression.

Matamorph user interface
Description

The Huygens Software Suite consists of different image processing packages with functionalities that include deconvolution, interactive analysis, and volume visualization of 2D-3D multi-channel and time series images from fluorescence microscopes such as widefield, confocal, multi-photon, spinning disk, Array Detector, STED, and Light Sheet

Description

**Collaborative Annotation Toolkit for Massive Amounts of Image Data** CATMAID is a Collaborative Annotation Toolkit for Massive Amounts of Image Data. It is designed to navigate, share and collaboratively annotate massive image data sets of biological specimens. The interface is inspired by GoogleMaps, with which it shares basic navigation concepts, enhanced to allow the exploration of 3D biological image data acquired by optical or physical sectioning microscopy techniques. The interface enables seamless sharing of regions of interest through bookmarks and synchronized navigation through multiple registered data sets. With massive biological image data sets it is unrealistic to create a sustainable centralized repository. A unique feature of CATMAID is its partially decentralized architecture where the presented image data can reside on any Internet accessible server and yet can be easily cross-referenced in the central database. In this way no image data are duplicated and the data producers retain full control over their images. CATMAID is intended to serve as data sharing platform for biologists using high-resolution imaging techniques to probe large specimens. Any high-throughput, high-content imaging project such as gene expression pattern screens would benefit from the interface for data sharing and annotation.

CATMAID
Description

Amira is 3D visualization and analysis software for life sciences.
 

" Amira software is a powerful, multifaceted 3D platform for visualizing, manipulating, and understanding life sciences data from computed tomography, microscopy, MRI, and many other imaging modalities. 
With incredible speed and flexibility, Amira software enables advanced 3D imaging workflows for specialists in research areas ranging from molecular and cellular biology to neuroscience and bioengineering. "

has topic
Amira's interface
Description
OpenCV is released under a BSD license and hence it’s free for both academic and commercial use. It has C++, C, Python and Java interfaces and supports Windows, Linux, Mac OS, iOS and Android. OpenCV was designed for computational efficiency and with a strong focus on real-time applications. Written in optimized C/C++, the library can take advantage of multi-core processing. Adopted all around the world, OpenCV has more than 47 thousand people of user community and estimated number of downloads exceeding 6 million. Usage ranges from interactive art, to mines inspection, stitching maps on the web or through advanced robotics.
need a thumbnail
Description
OpenMOLE (Open MOdeL Experiment) is a workflow engine designed to leverage the computing power of distributed execution environments for naturally parallel processes. A process is told naturally parallel if the same computation runs many times for a set of different inputs, such as model experiment or data processing… It is free software distributed under the AGPLv3 free software license.
need a thumbnail
Description

An ImageJ plugin for selecting a plane in focus among multiple slices image stack. The algorithm uses normalized variance. A short tutorial is available in the plugin web page (above).

need a thumbnail
Description

Neuron studio is a software package to reconstruct neurons from 3D confocal images. Reconstruction can be done manually, semi-manually or fully automatic. The images as well as the detected objects are rendered in 3D. A spine detection and classification function is also included. Results can be exported as a text file with coords of the spines. It seems that active development has stopped in 2009. NeuronStudio is being developed at the Computational Neurobiology and Imaging Center (CNIC), a research laboratory at the Neuroscience Department of the Mount Sinai School of Medicine in New York.

NeuronStudio can be used with default parameters or user-defined parameters (Fully or semi-automated).

NeuronStudio_standaloneapp_window_overview
Description

The tool measures the total length of the microtubules in a 3D image.

See: http://dev.mri.cnrs.fr/projects/imagej-macros/wiki/Microtubules_Tool_(3…

You can find a test image here.

3D microtubules
Description

The Arabidopsis Seedlings Tool allows to analyze the germination and seedling growth of Arabidopsis (Arabidopsis thaliana) in liquid culture. It measures the surface of green pixels per well in images containing multiple wells. It can be run in batch mode on a series of images. It writes a spreadsheet file with the measured area per well and saves a control image showing the green surface that has been detected per well. 

See http://dev.mri.cnrs.fr/projects/imagej-macros/wiki/Arabidopsis_Seedlings_Tool

Test images can be found here.

has function
ImageJ toolbar of the arabidopsis seedlings tool
Description

**Python(x,y)** is a free scientific and engineering development software for numerical computations, data analysis and data visualization based on Python programming language, Qt graphical user interfaces and Spyder interactive scientific development environment. Many python libraries related to numerical calculation are packaged, so you do not need to search and install them individually. Included libraries are listed **[here](https://code.google.com/p/pythonxy/wiki/StandardPlugins).**

has function
need a thumbnail
Description

IMOD is a set of image processing, modeling and display programs used for tomographic reconstruction and for 3D reconstruction of EM serial sections and optical sections. The package contains tools for assembling and aligning data within multiple types and sizes of image stacks, viewing 3-D data from any orientation, and modeling and display of the image files.

Included are two programs with graphical interface: 3dmod, for displaying and segmenting 2D images and 3D volumes; etomo, for reconstructing tomographic volumes from tilt series of images.

Processing can be distributed on multiple cores and executed in batch mode.

iMod
Description

MATLAB is famous, so this page is only for being the landing page for components and workflows.

Matlab logo
Description

Acquiarium is for carrying out the common pipeline of many spatial cell studies using fluorescence microscopy. It addresses image capture, raw image correction, image segmentation, quantification of segmented objects and their spatial arrangement, volume rendering, and statistical evaluation. It is focused on quantification of spatial properties of many objects and their mutual spatial relations in a collection of many 3D images. It can be used for analysis of a collection of 2D images or time lapse series of 2D or 3D images as well. It has a modular design and is extensible via plug-ins. It is a stand-alone, easy to install application written in C++ language. The GUI is written using cross-platform wxWidgets library.

Functionalities
Description

Slicer, or 3D Slicer, is a free, open source software package for visualization and image analysis. 3D Slicer is natively designed to be available on multiple platforms, including Windows, Linux and Mac Os X.

Source code: https://github.com/Slicer/Slicer

3D slicer
Description
Endrov started development in 2007 by Johan Henriksson in the group of Thomas Bürglin group / Karolinska insitutet. At that time it was merely a tool to support the analysis of C. elegans embryogenesis. It was decided to not base it on ImageJ because little of it could be reused, many of the problems came from the core design. Since then the scope of Endrov has expanded to be useful for all image processing and be able to replace ImageJ.
need a thumbnail
Description
Quote The application Bio7 is an integrated development environment for ecological modelling and contains powerful tools for model creation, scientific image analysis and statistical analysis. The application itself is based on an RCP-Eclipse-Environment (Rich-Client-Platform) which offers a huge flexibility in configuration and extensibility because of its plug-in structure and the possibility of customization.
need a thumbnail
Description

BioImage Analysis Tool for all! Also check out ImageJ2

need a thumbnail
Description

u-track is a multiple-particle tracking Matlab software that is designed to (1) track dense particle fields, (2) close gaps in particle trajectories resulting from detection failure, and (3) capture particle merging and splitting events resulting from occlusion or genuine aggregation and dissociation events. Its core is based on formulating correspondence problems as linear assignment problems and searching for a globally optimal solution.

Data can be read using bio-format and interfaced with OMero data base.

It comes as a standalone software, but can be used as a library, which is according to the authors the most widely used version of it.

  • Version 2.2 adds parallel processing functionality for multi-movie datasets when using the GUI.
  • Version 2.1 enables the analysis of movies stored on an OMERO server
  • Version 2.0 includes two new tracking applications: microtubule plus-end tracking (previously distributed as plusTipTracker) and nuclei tracking
  • A third optional processing step has been added to the analysis workflow, track analysis, with two methods: motion analysis and microtubule plus-end classification

For more information, please see Jaqaman et al., Nature Methods 5, pp. 695-702 (2008). Besides basic particle tracking, the software supports the features described in Applegate et al. J. Struct. Biol. 176(2):168-84. 2011 for tracking microtubule plus end markers; and in Ng et al. J. Cell Biol. 199(3):545-63. 2012 for tracking fluorescently-labeled cell nuclei.


ITK

Description

ITK is an open-source, cross-platform system that provides developers with an extensive suite of software tools for image analysis.

Developed through extreme programming methodologies, ITK employs leading-edge algorithms for registering and segmenting multidimensional data. It is widely used and contributed in the medical imaging field.

Strengths

Highly optimized C++, well commented Consistently updated (new) algorithms many tools and softwares are built upon it connected with VTK Insight Journal (open code and sample data) Extensive list of examples & tutorials

Limitations

yet detached from the bioimage analysis world hard to use for end users without development skills

itk
Description

Schnitzcells is a MATLAB based software that allows for quantitative analysis of fluorescent time-lapse movies of living cells. The software package is developed most specifically for bacteria and has been instrumental in analyzing E.coli and B. subtilis movies. The software contains functions that segment cells (based on either fluorescence or phase images),tracks cells in a frame-to-frame manner,build lineage trees and quantitatively extracts fluorescence.

Strength: tools for manually editing segmentation and lineage, well documented, free matlab source code, sample data

Limitations: no support, changes need to be done directly in the matlab code

need a thumbnail
Description
The Matlab Computer Vision System Toolbox extends the Matlab core functionality with general purpose image processing functions for feature detection & extraction, object detection & tracking and motion estimation. Strengths: - Most functions extend to nD - optimized functions (muti-threaded for some) - Matlab community (Matlab central) - relatively low entry-threshold for functionality - Tutorials & Webinars Limitations: - no embedded visualization of nD Microscopy data
need a thumbnail
Description
The Matlab image processing toolbox extends the Matlab core functionality with general purpose image processing capabilities. This ranges from image access (read / write), common filters (convolution, morphology, order based, Wiener, feature extraction, image enhancement, ...), image transformation (rotation, affine transformation, ...) to segmentation algorithms (thresholding, watershed, region growing). There is also an extensive list of functions to deal with binary or label mask and perform for instance connected particle analysis or morphological operations. Strengths: - Most functions extend to nD - optimized functions (muti-threaded for some) - Matlab community (Matlab central) - relatively low entry-threshold for functionality - Tutorials & Webinars Limitations: - no embedded visualization of nD Microscopy data
need a thumbnail
Description

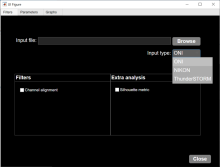
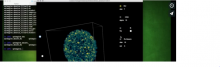
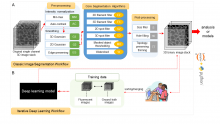
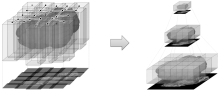
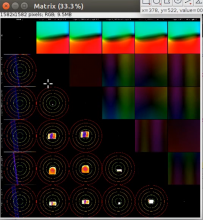
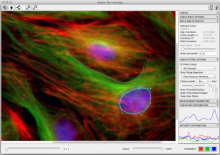
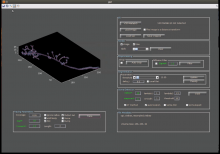
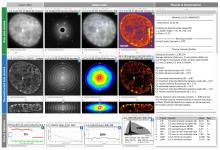
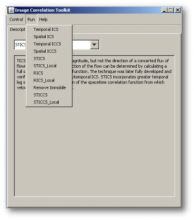
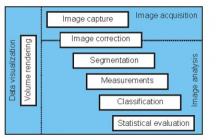
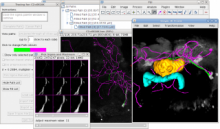
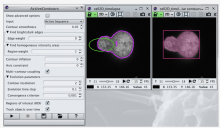
ilastik is a simple, user-friendly tool for interactive image classification, segmentation and analysis. It is built as a modular software framework, which currently has workflows for automated (supervised) pixel- and object-level classification, automated and semi-automated object tracking, semi-automated segmentation and object counting without detection. Most analysis operations are performed lazily, which enables targeted interactive processing of data subvolumes, followed by complete volume analysis in offline batch mode. Using it requires no experience in image processing.

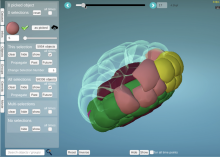
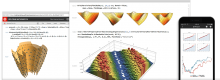
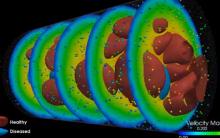
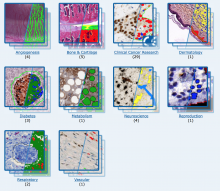
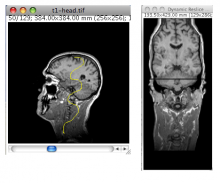
ilastik (the image learning, analysis, and segmentation toolkit) provides non-experts with a menu of pre-built image analysis workflows. ilastik handles data of up to five dimensions (time, 3D space, and spectral dimension). Its workflows provide an interactive experience to give the user immediate feedback on the quality of the results yielded by her chosen parameters and/or labelings.

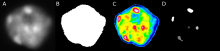
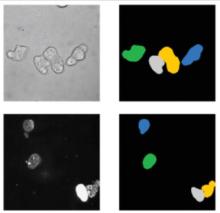
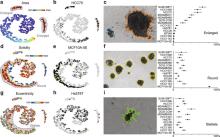
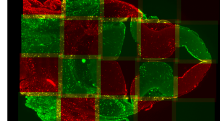
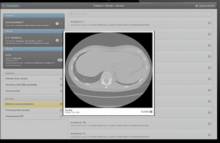
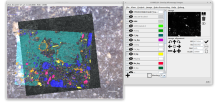
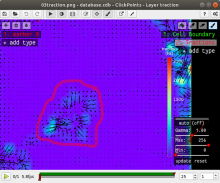
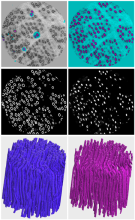
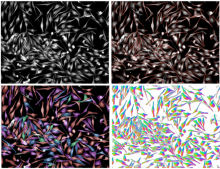
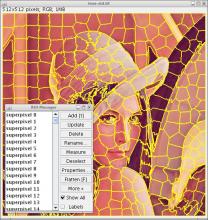
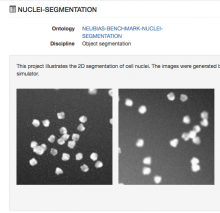
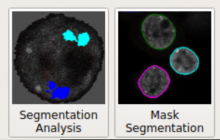
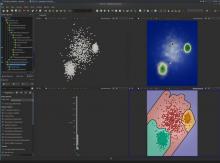
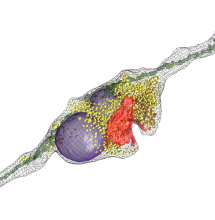
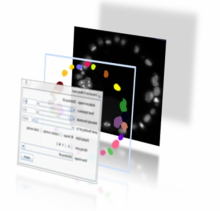
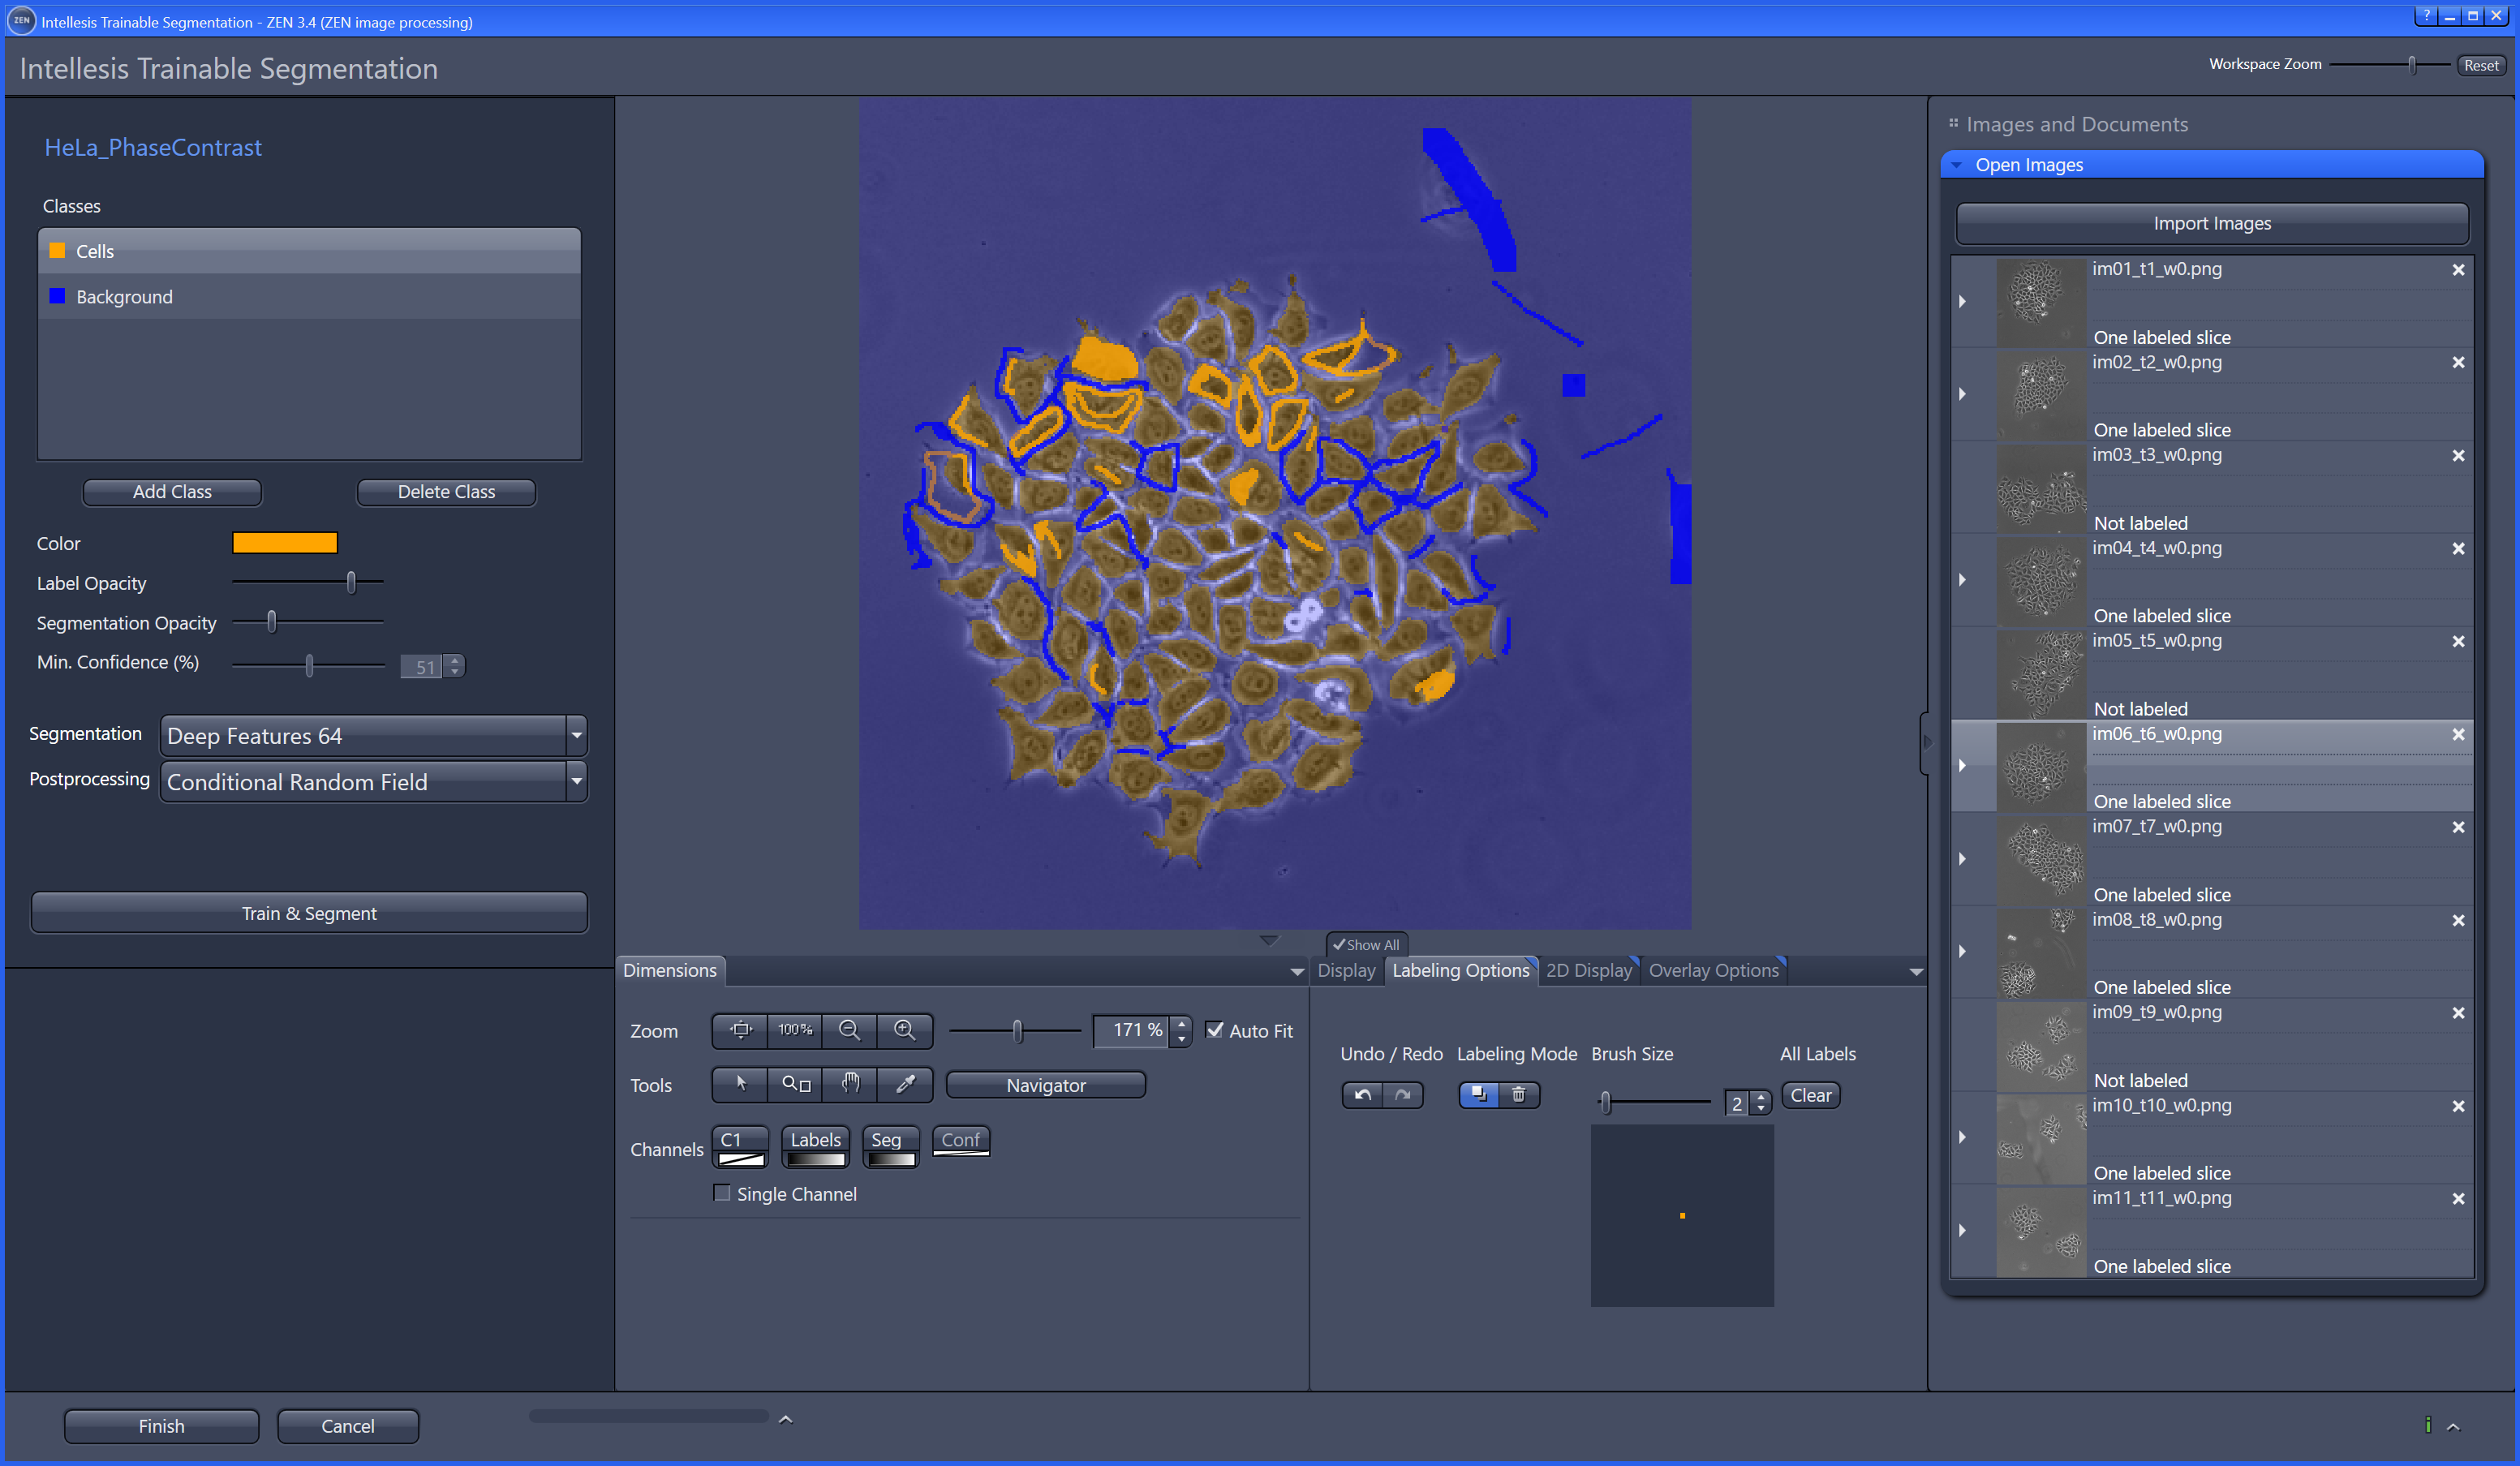
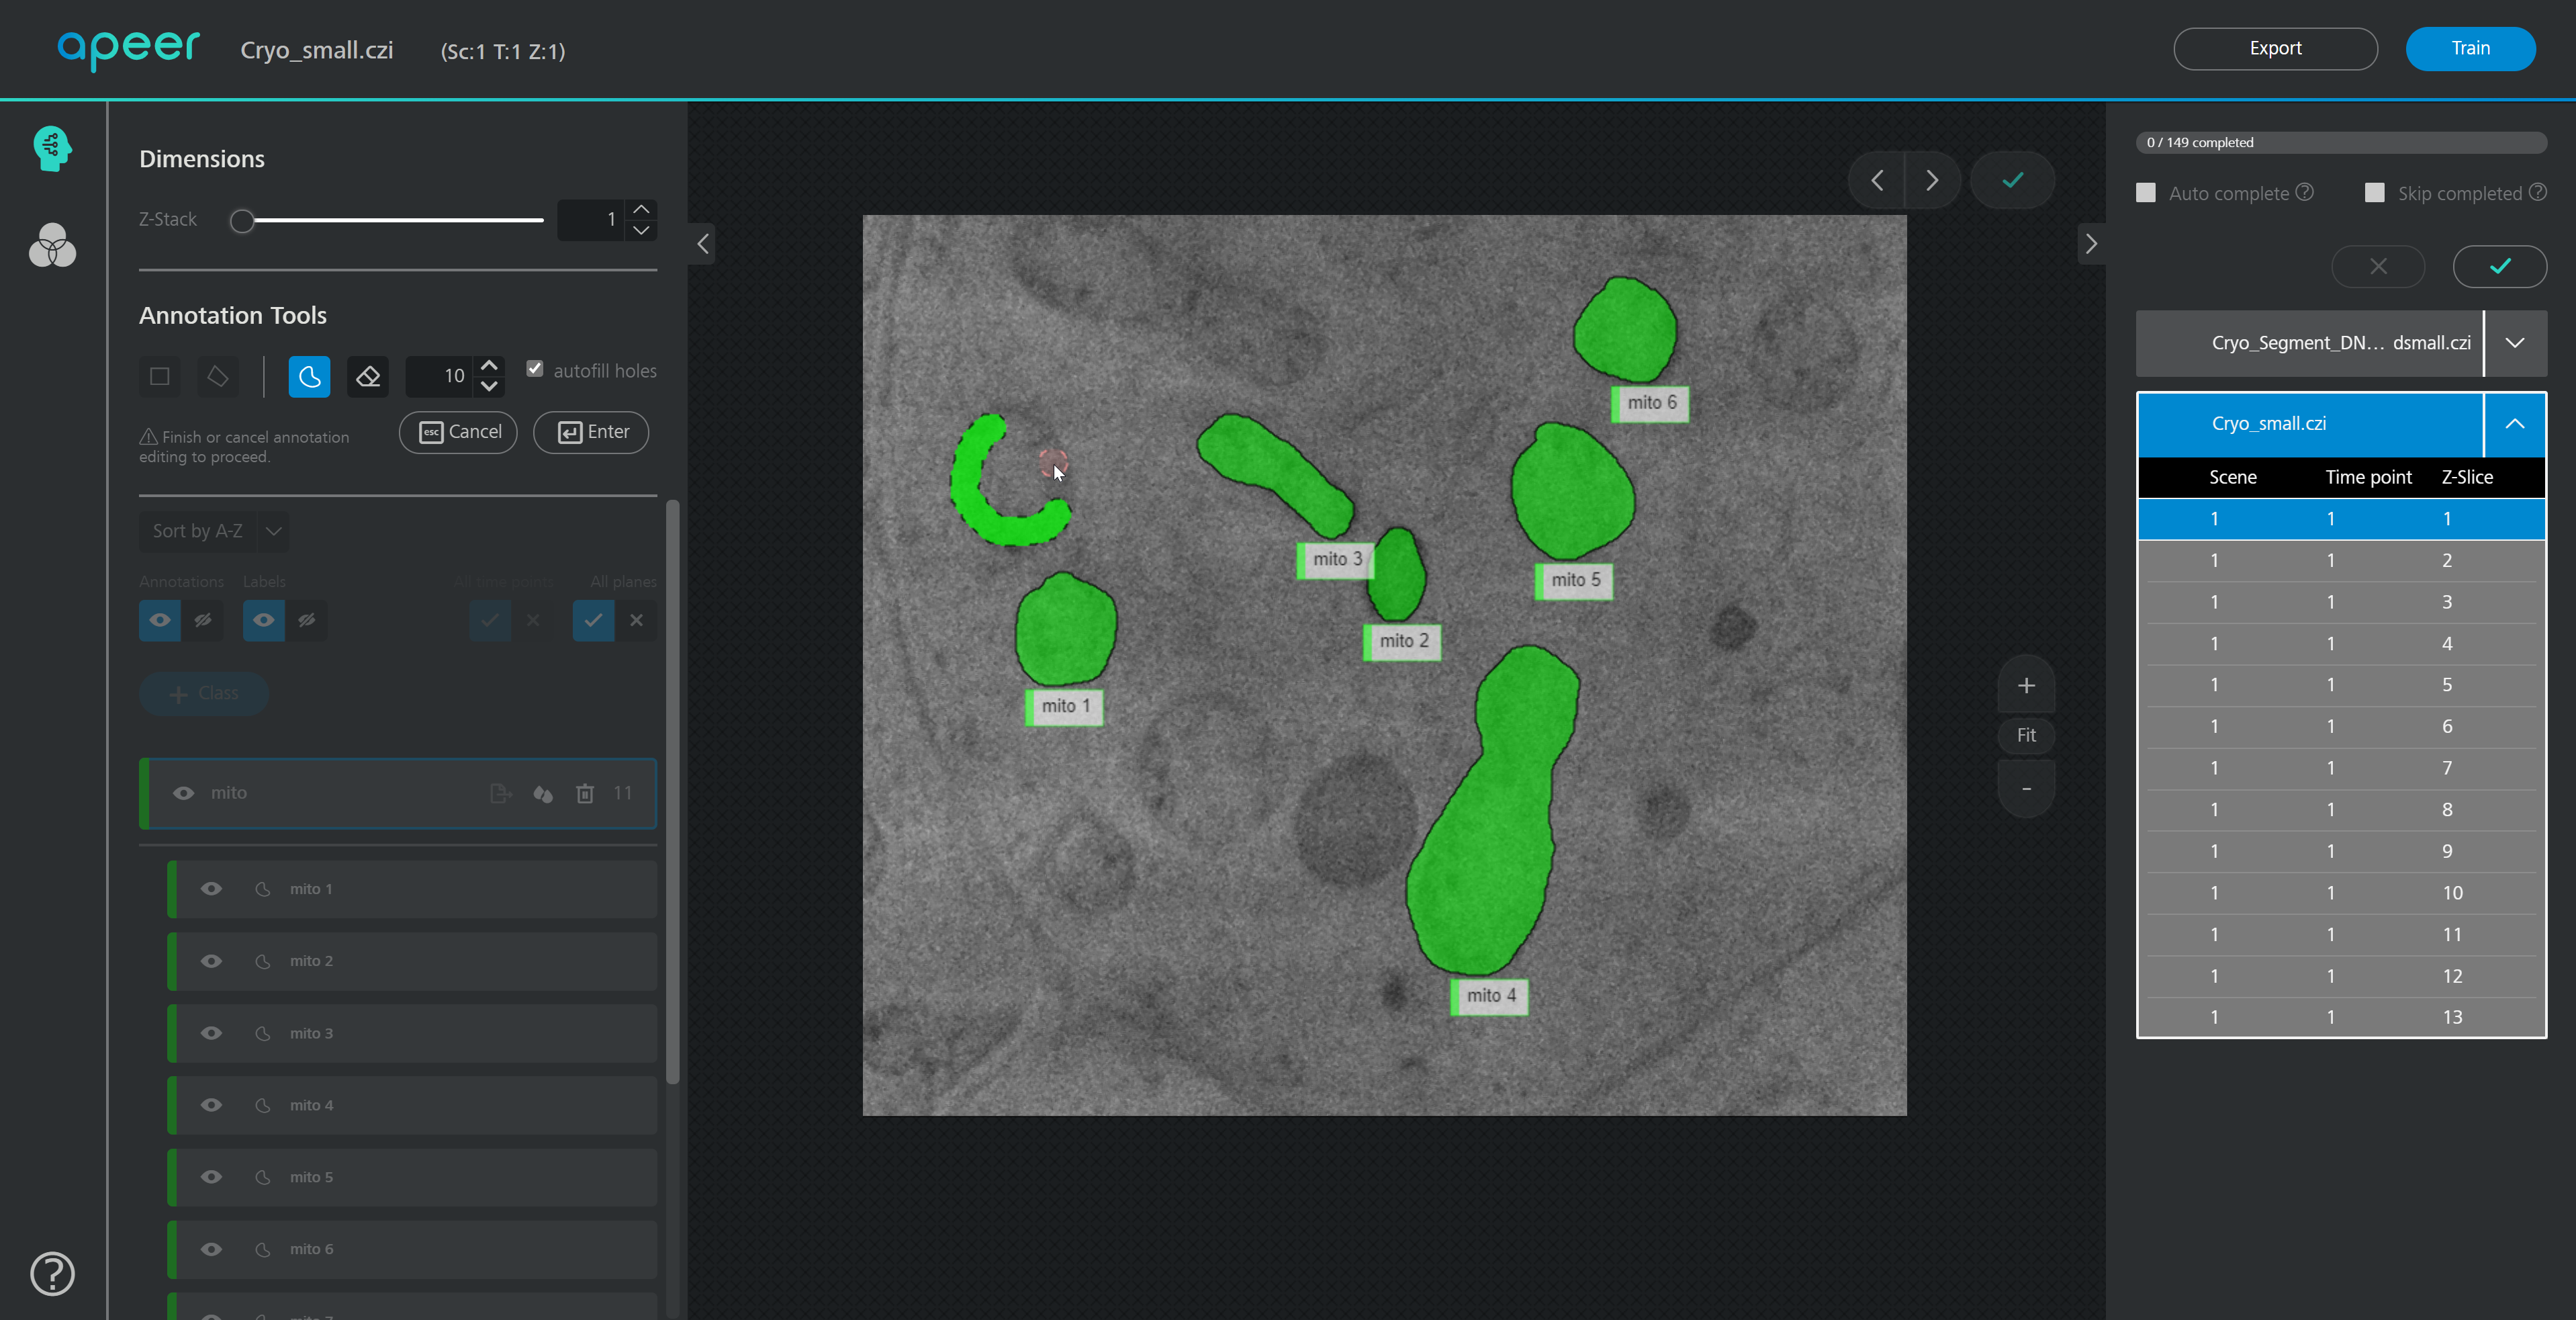
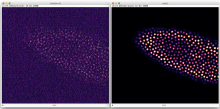
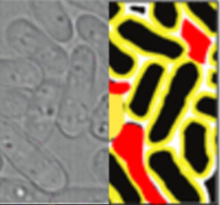
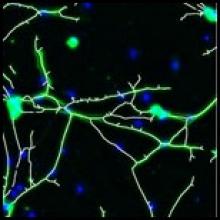
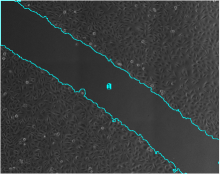
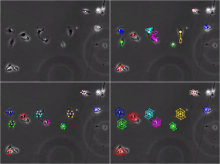
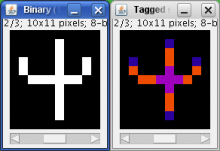
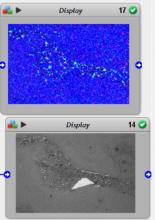
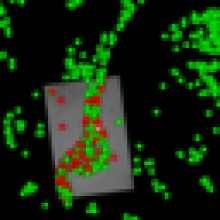
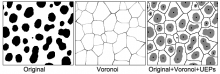
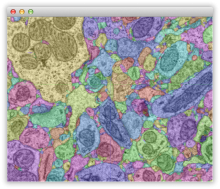
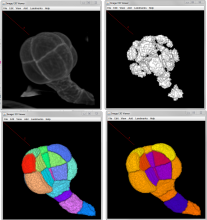
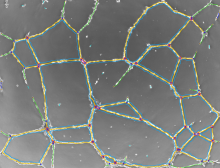
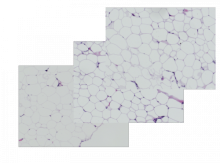
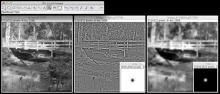
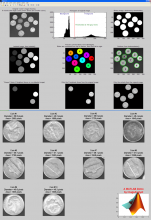
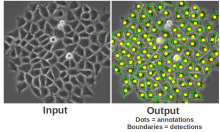
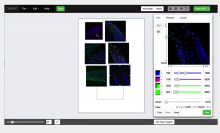
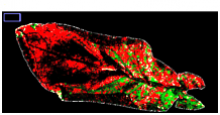
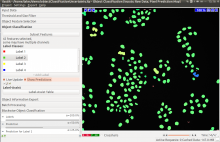
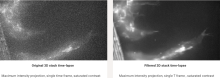
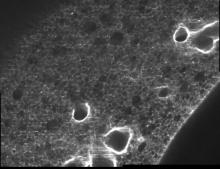
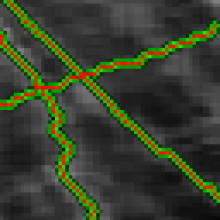
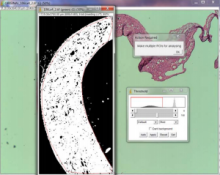
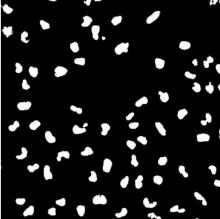
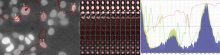
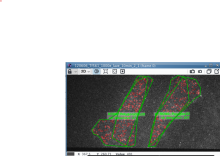
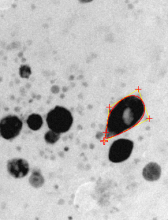
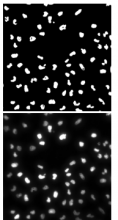
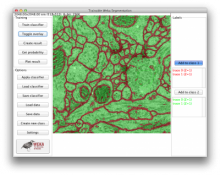
The most commonly used workflow is pixel classification, which requires very little parameter tuning and instead offers a machine learning technique for segmenting an image based on local image features computed for each pixel.

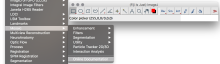
Other workflows include:

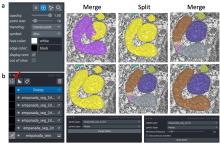
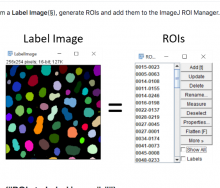
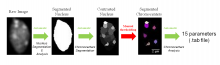
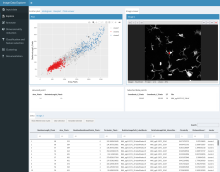
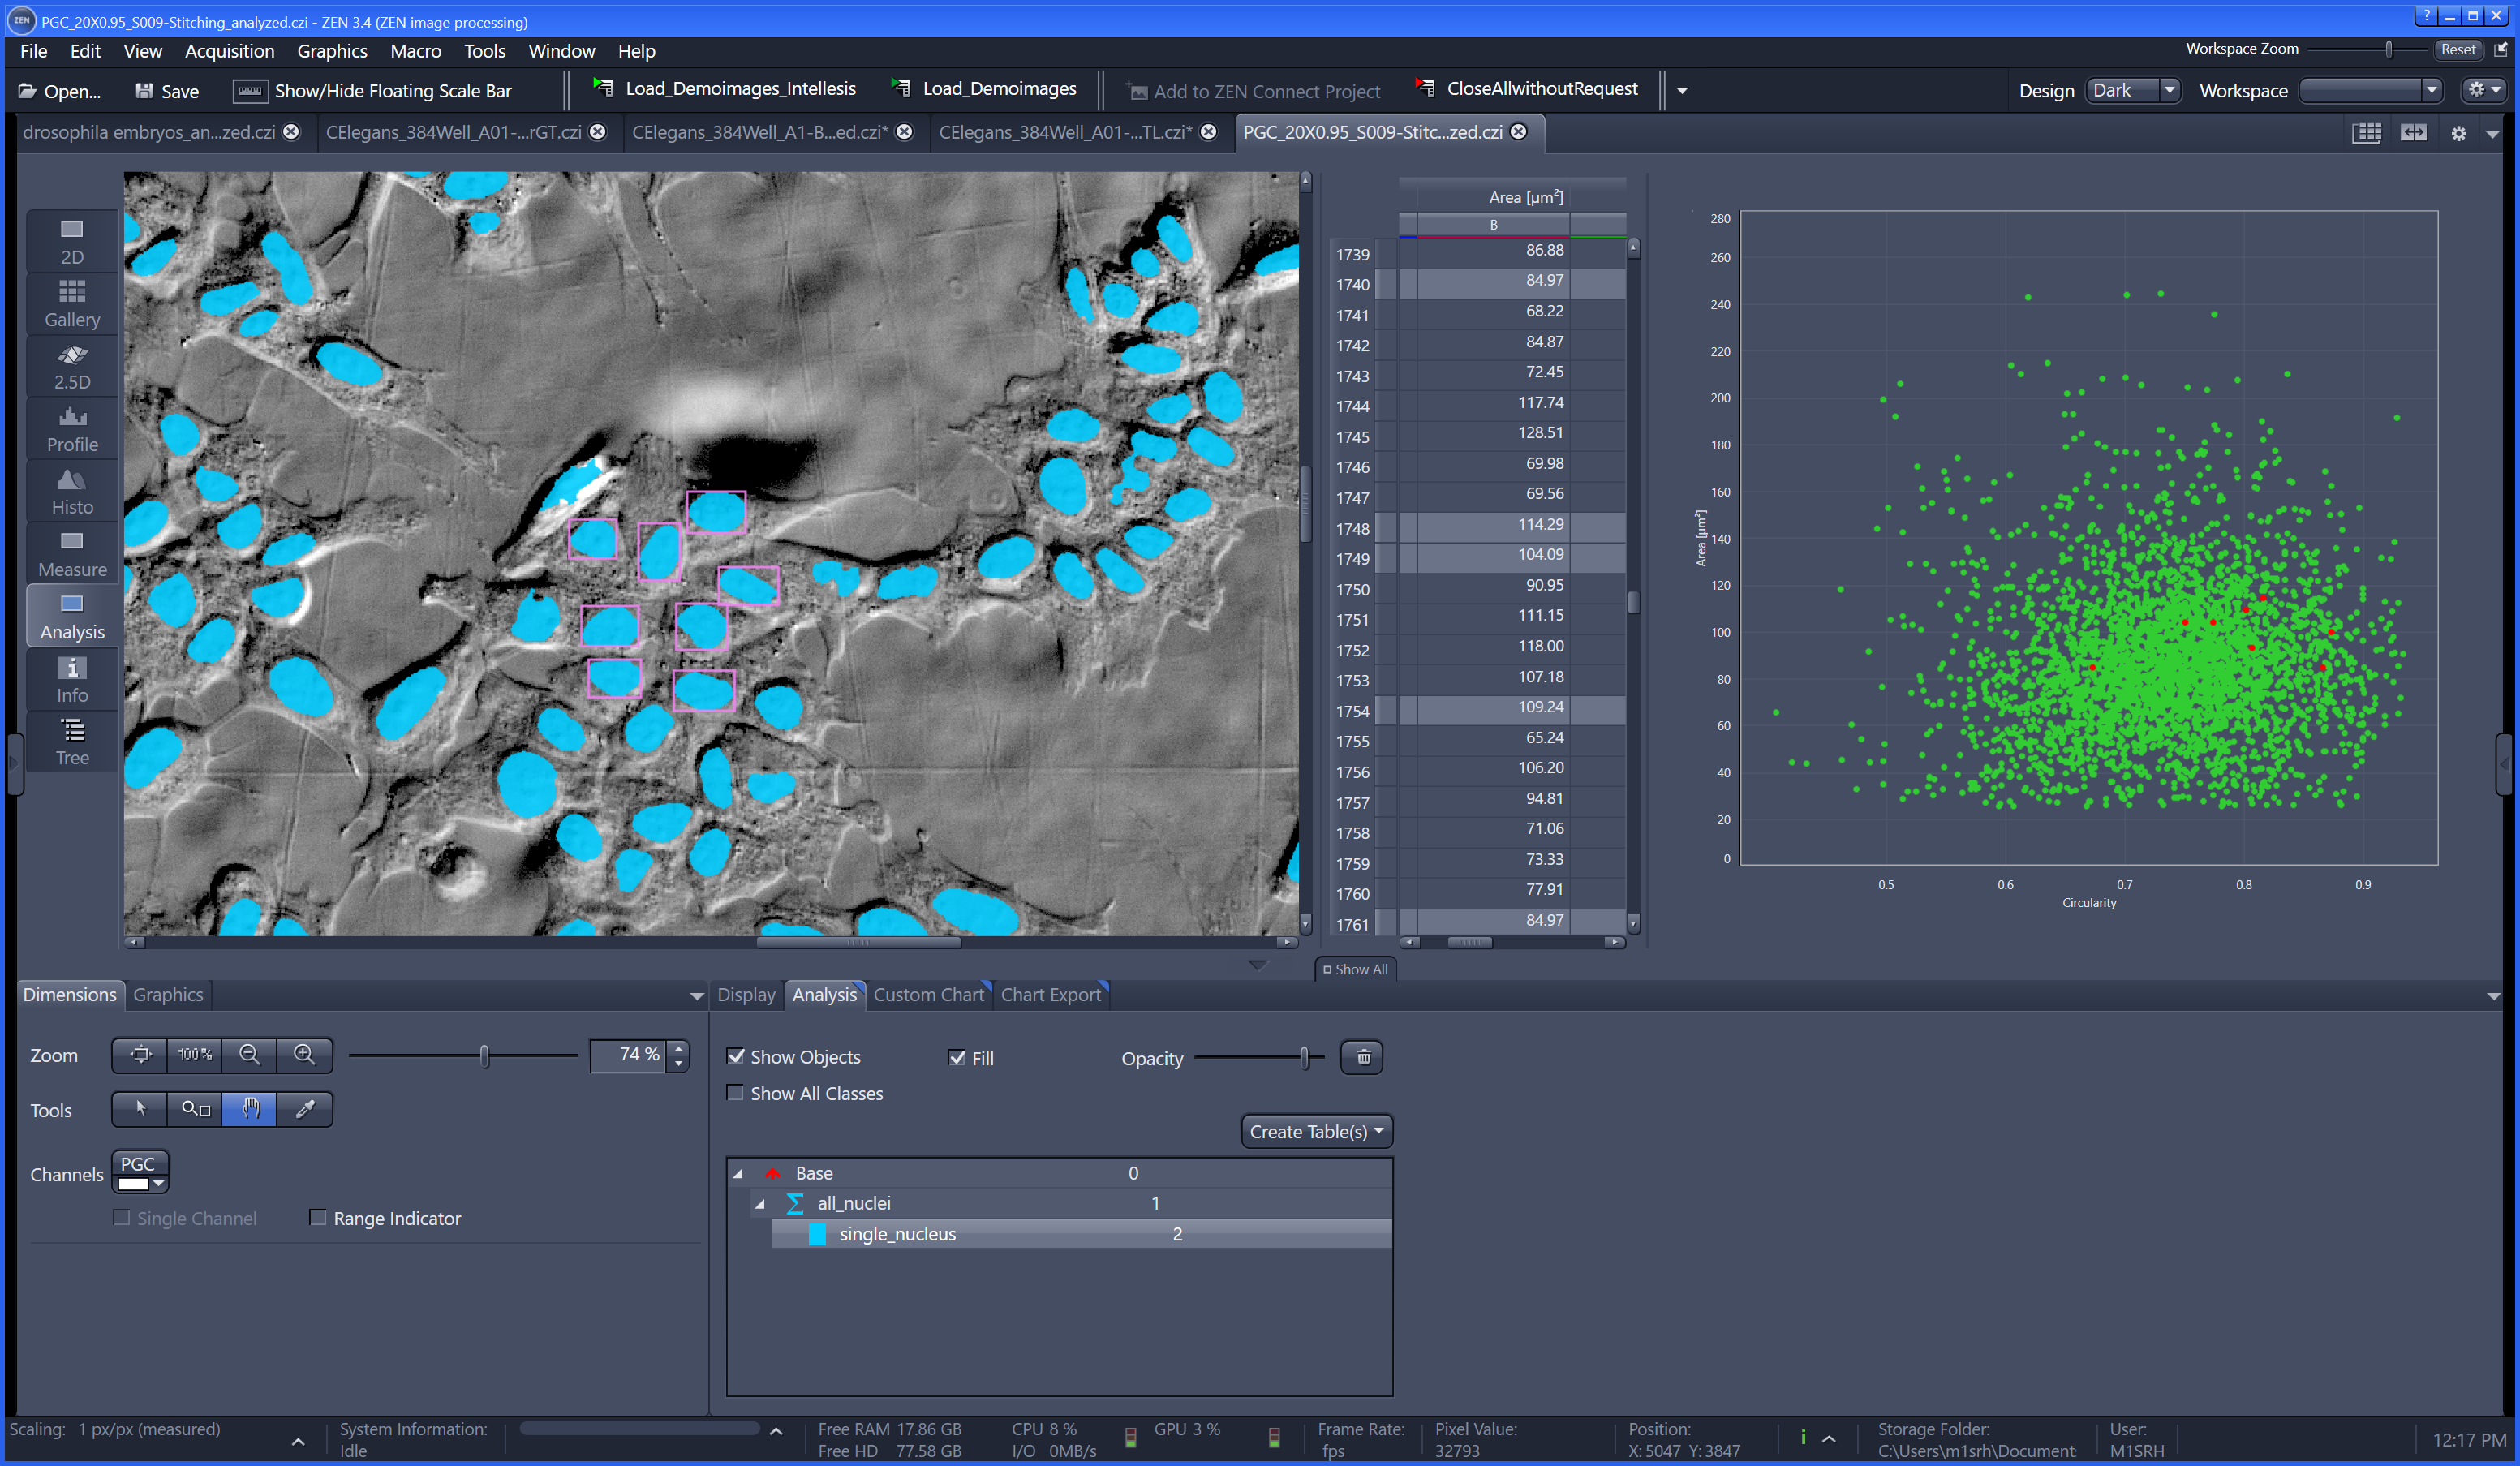
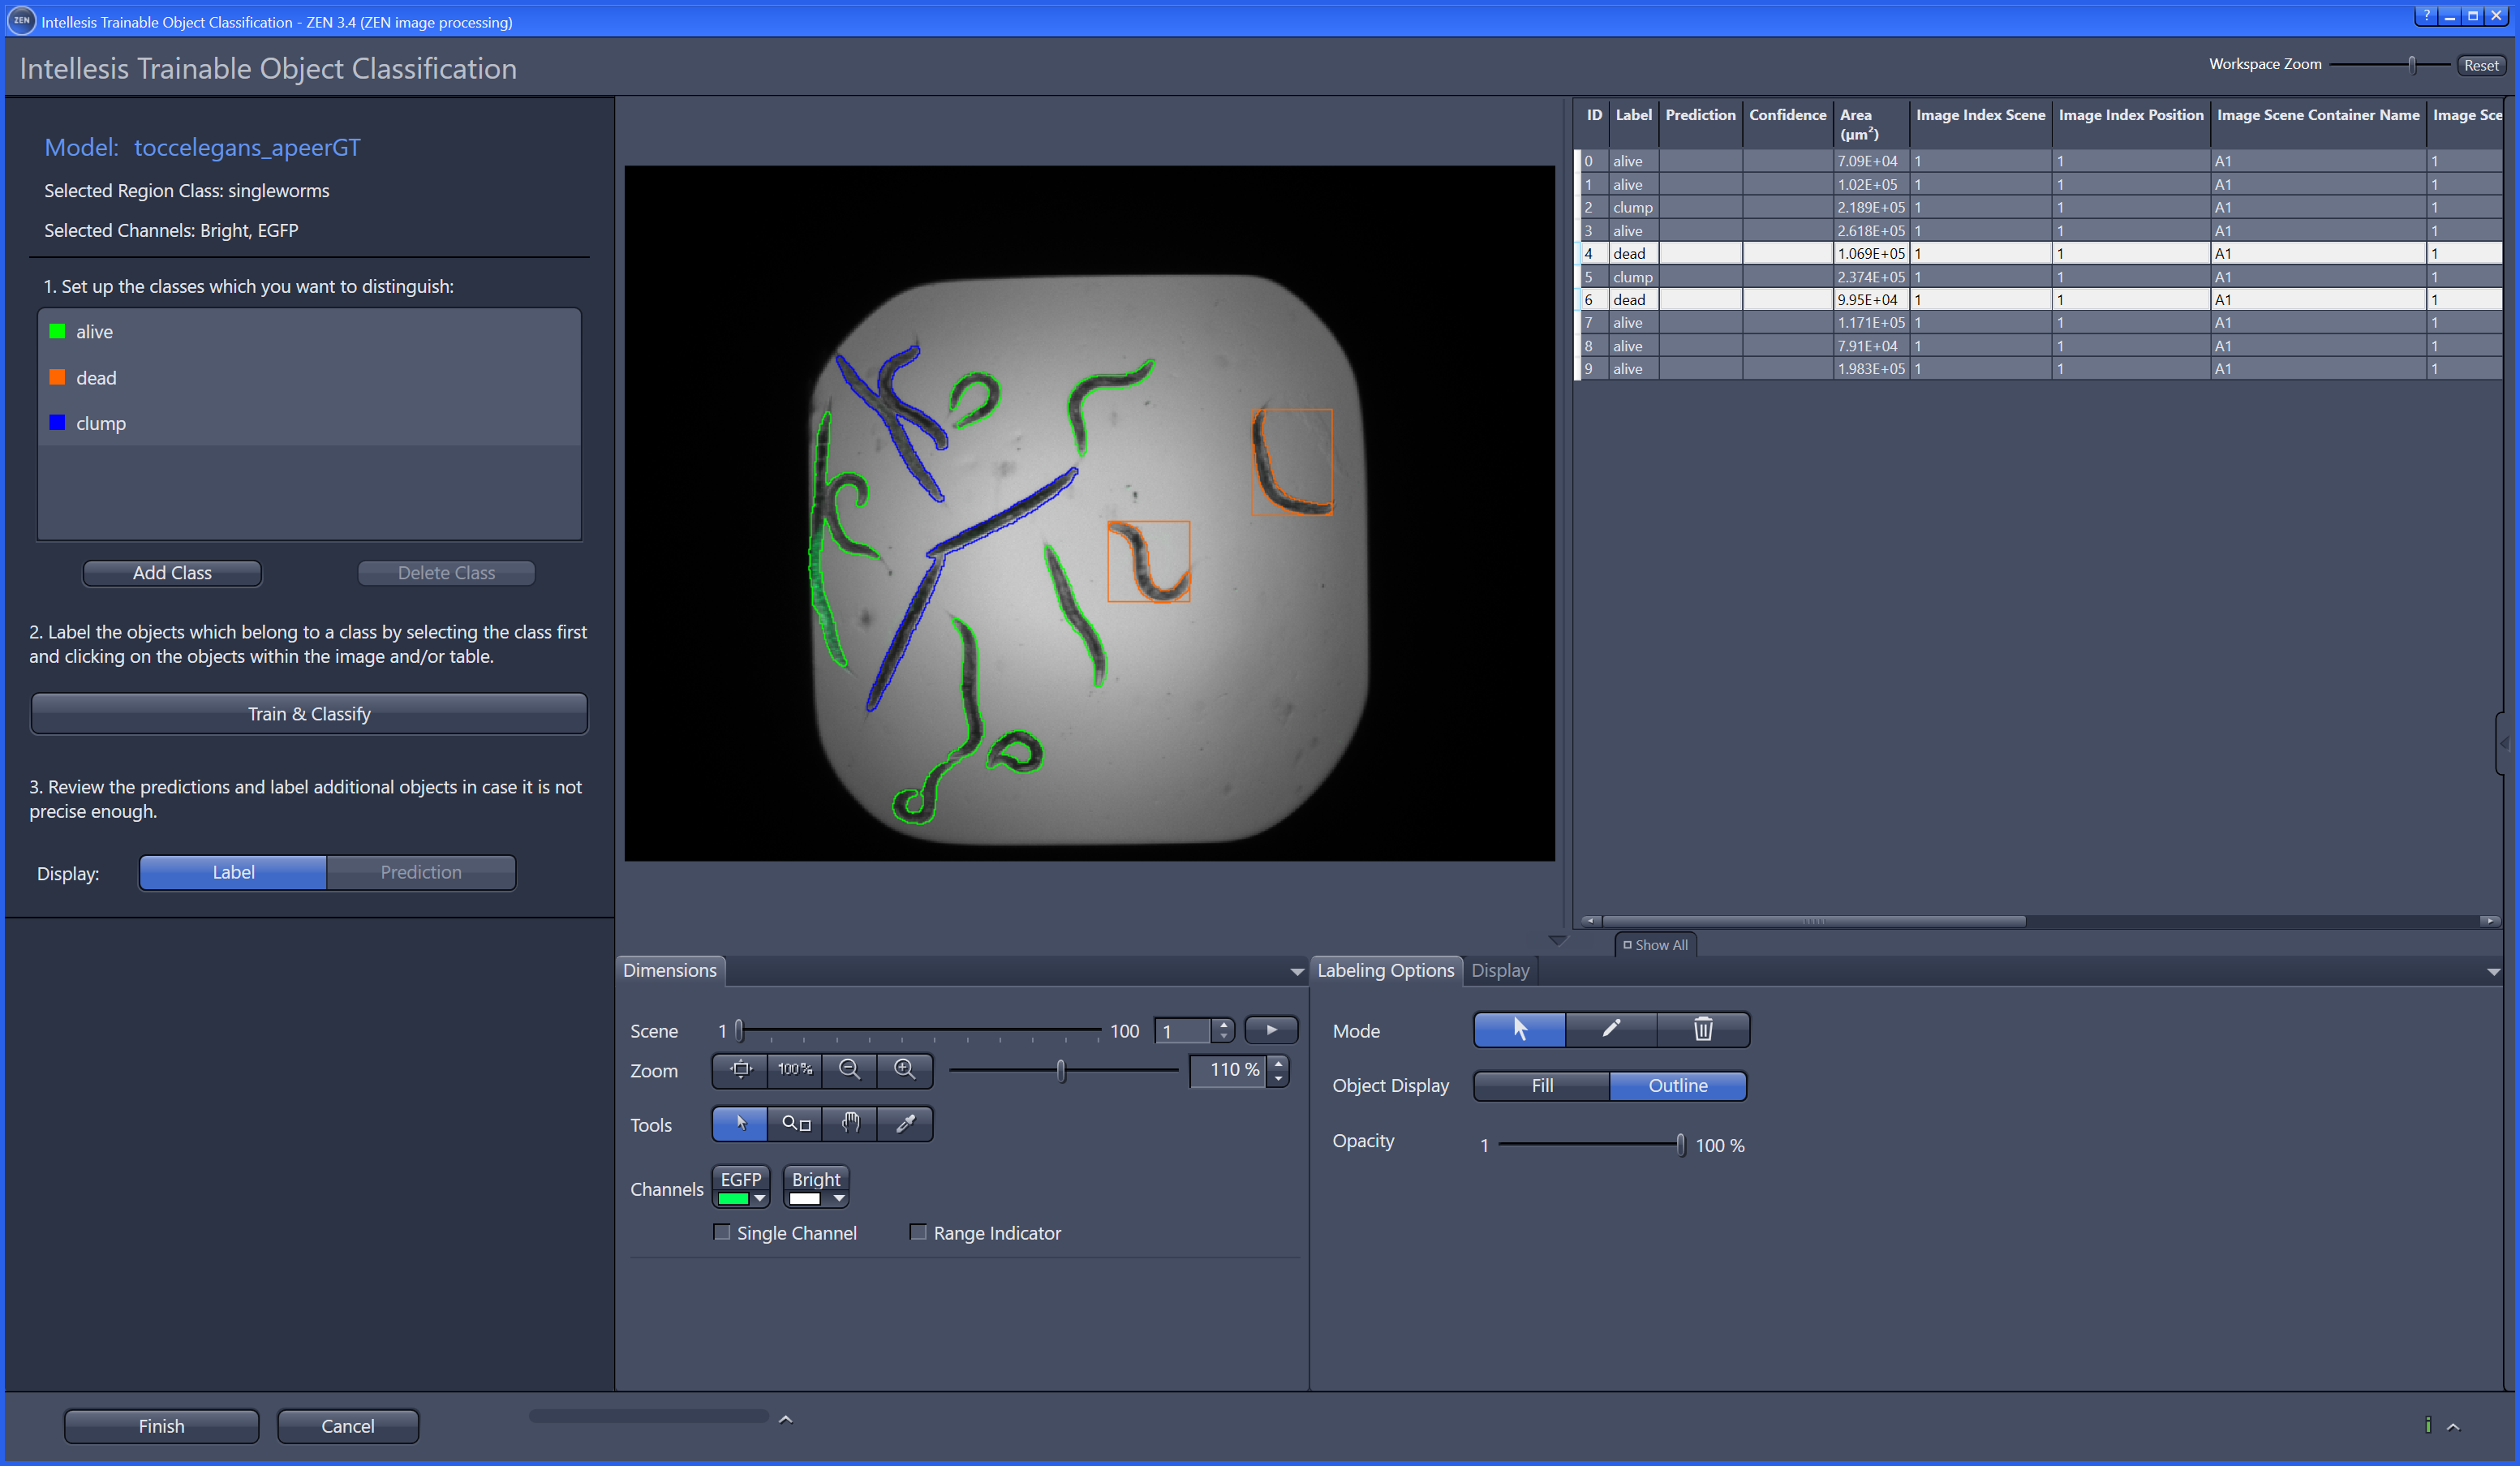
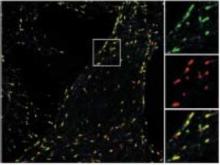
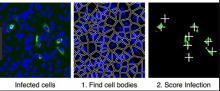
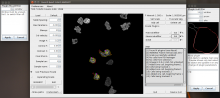
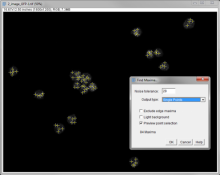
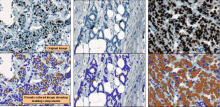
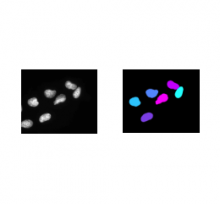
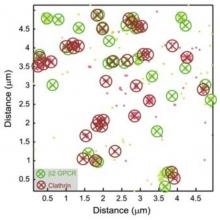
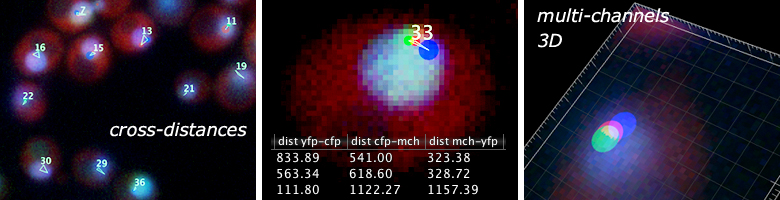
Object classification: Similar to pixel classification, but classifies previously segmented objects by object characteristics in a subsequent step

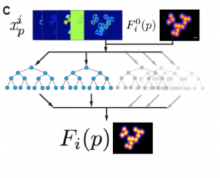
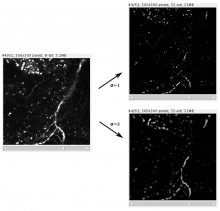
Autocontext: This workflow improves the pixel classification workflow by running it in multiple stages and showing each pixel the results of the previous stage.

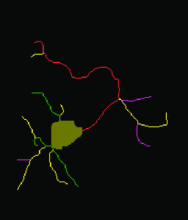
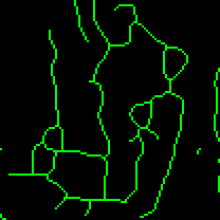
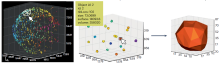
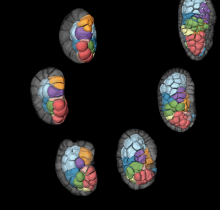
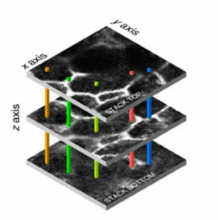
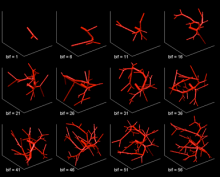
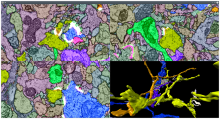
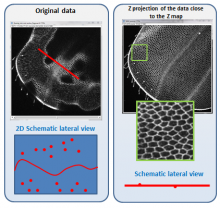
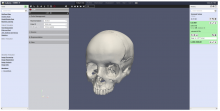
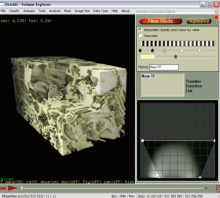
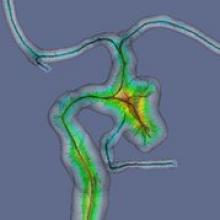
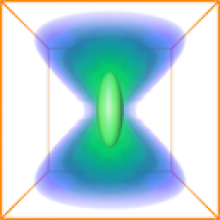
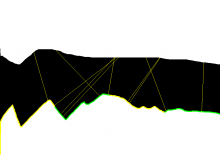
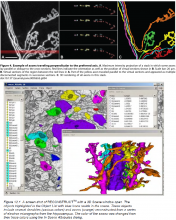
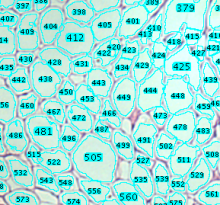
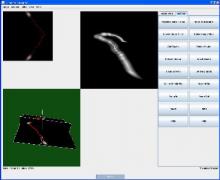
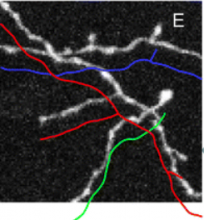
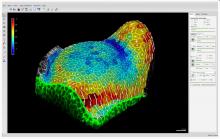
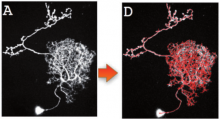
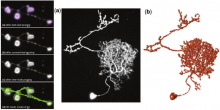
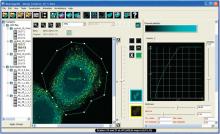
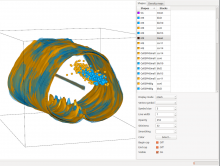
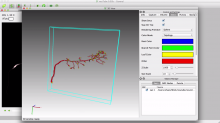
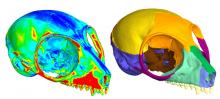
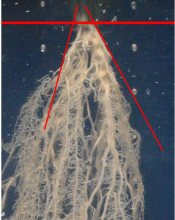
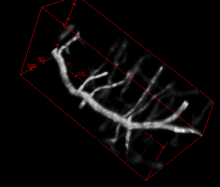
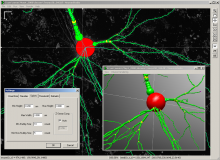
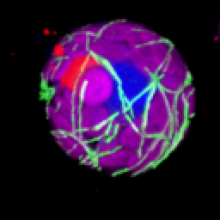
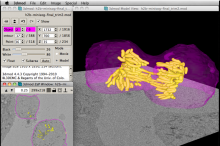
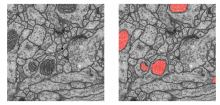
Carving: Semi-automated segmentation of 3D objects (e.g. neurons) based on user-provided seeds

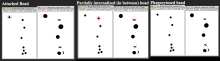
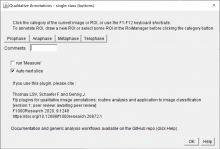
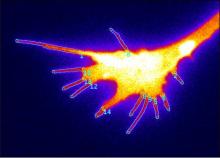
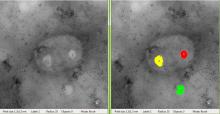
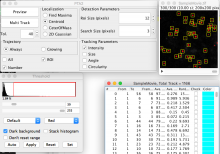
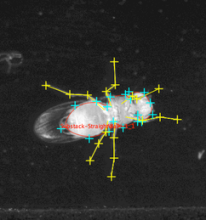
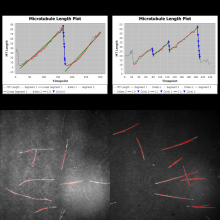
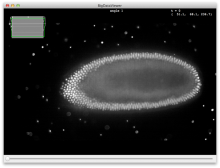
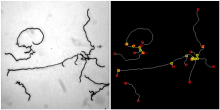
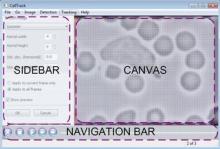
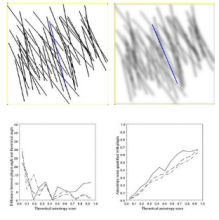
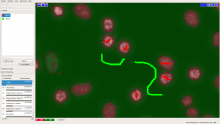
Manual Tracking: Semi-automated cell tracking of 2D+time or 3D+time images based on manual annotations

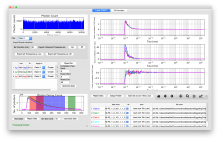
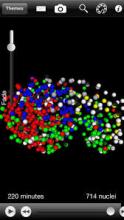
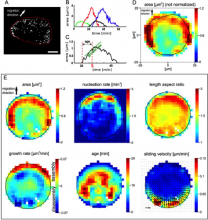
Automated tracking: Fully-automated cell tracking of 2D+time or 3D+time images with some parameter tuning

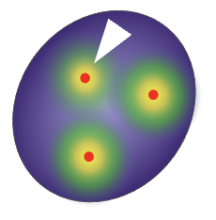
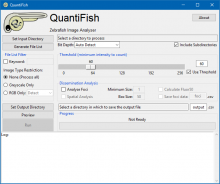
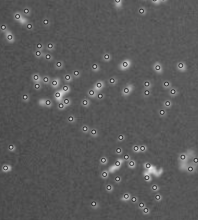
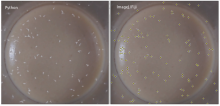
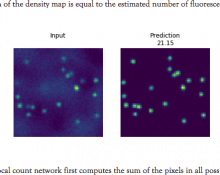
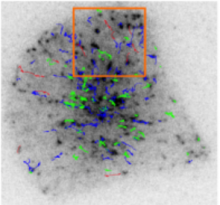
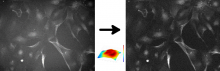
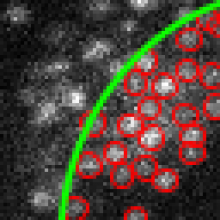
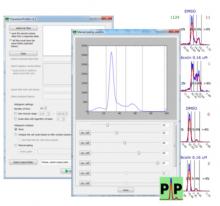
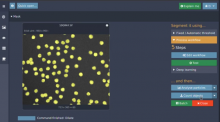
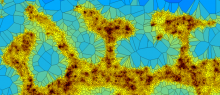
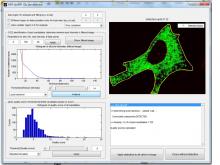
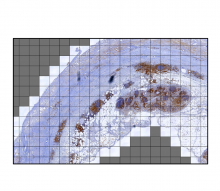
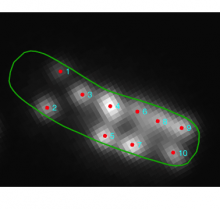
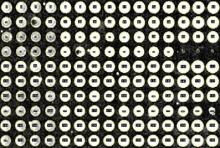
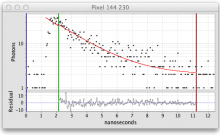
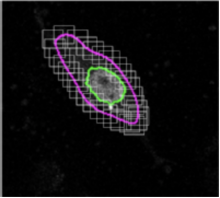
Density Counting: Learned cell population counting based on interactively provided user annotation

Strengths: interactive, simple interface (for non-experts), few parameters, larger-than-RAM data, multi-dimensional data (time, 3D space, channel), headless operation, batch mode, parallelized computation, open source

Weaknesses: Pre-built workflows (not reconfigurable), no plugin system, visualization sometimes buggy, must import 3D data to HDF5, tracking requires an external CPLEX installation

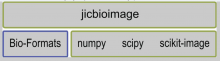
Supported Formats: hdf5, tiff, jpeg, png, bmp, pnm, gif, hdr, exr, sif

Description

Imaris is a software for data visualization, analysis, segmentation and interpretation of 3D and 4D microscopy images. It performs interactive volume rendering that lets users freely navigate even very large datasets (hundreds of GB). It performs both manual and automated detection and tracking of biological “objects” such as cells, nuclei, vesicles, neurons, and many more. ImarisSpots for example is a tool to detect “spherical objects” and track them in time series. Besides the automated detection it gives the user the ability to manually delete and place new spots in 3D space. ImarisCell is a tool to detect nuclei, cell boundaries and vesicles and track these through time. ImarisFilament is a module that lets users trace neurons and detect spines. For any detected object Imaris computes a large set of statistics values such as volume, surface area, maximum intensity of first channel, number of vesicles per cell etc. These values can be exported to Excel and statistics software packages. The measurements can also be analyzed directly within ImarisVantage which is a statistics tool that provides the link back to the 3D objects and the original image data. Strengths: - good visualization - user friendly interface - reads most microscopy file formats - image analysis workflows are very easy to apply - interactive editing of objects to correct errors during automatic detection - large data visualization (hundreds of GB)

has topic
null
Description
A General purpose image processing toolkit written in C++ based on ITK, VTK, Qt, and Boost. Main features: algorithms for cell segmentation, cell tracing, cell tracking, and vessel tracing. Registration and mosaicing algorithms for large scale datasets. Visualization tools actively linked to inspect and edit results. Strengths: - Open-source, free, multi platform, code is highly parallelized, uses git for version control - Large scale processing, also efficient visualization of such datasets. - Active learning module for classification - Most of the algorithms have been extended to handle 16-bit images, and 3D Images. - Possibility to create complex pipelines thanks to it’s modular architecture - Editing tools are designed to save the editing operation which can later be used to validate the algorithms performance - Advance preprocessing algorithms like curvelets, tensor voting, and wrappers around ITK-algorithms - Multiple viewers included to inspect results such as: Histograms, scatter plots, tables, kymograph, all of them linked together. - Strong emphasis to work on multichannel images (up to 40 channels) - Rich number of cell features included Weakness: - GUI is suboptimal compared to commercial packages. - Tracking module requires an external library CPLEX. - No support for brightfield images - No native interoperability with other software packages - More documentation needed / tutorial needed
need a thumbnail
Description
Definiens is a commercial image segmentation and classification tool. The user designs a signal processing workflow by combining built-in filtering, thresholding and object classification modules. Object detection is typically done on hierarchical object levels, e.g cell level for cell objects and organelle level Nucleus and ER obejcts inside a cell object. For each object, a huge set of features (shape-based, intensity based, relations to neighbor objects...) is available and can be used for object classification or merging with neighboring objects. The classical definiens workflow is the so called bottom-up approach: In a first step, the image is segmented in numerous small objects, resulting in a heavy oversegmentation of of the target objects. Objects are then fused step by step on basis of features like “relative border to neighbor object” or “elliptic fit of resulting (fused) object”. Objects can assigned to different classes (like “nucleus” or “cancer cell”), based on their features. Weaknesses: -complex to use -closed (no API) -very expensive -relatively slow (you have to buy one license for each core) -bad 3D-visualization -time lapse analysis is possible but complicated Strengths: -powerful method to classify objects based on multiple features -2D data, especially histological data -good training material to learn software usage -detailed documentation
need a thumbnail

Icy

Description

Reproducing an experiment doesn’t stop at the bench when images are concerned. Icy is an open source bioimaging software package that aims to provide a framework for authors to share, and others to reproduce, research once the sample hits the microscope. Icy was released in April 2011 and is being developed at the Quantitative Image Analysis Unit at the Pasteur Institute in France by Jean-Christophe Olivo-Marin and his team. The goal is to provide standardized software architecture, with a visual programming framework and online repository of plugins and protocols, brought together with sophisticated content-management and communication systems for such extended reproducible research. Icy provides intuitive user interfaces for graphical protocol development for image acquisition, analysis and storage that are easy to use for biologists and developers alike. Developers should find that Icy’s ‘EzPlug’ API library, versioning, and auditing tools make creating a custom plugin from most any source easy. Users will find the automatic error reporting, central repository and on-line community hub great for storing and sharing plugins and protocols. Icy is even developing a cloud-computing framework to address the scalability issues of high-content screening. As of this writing there are 207 plug-ins 50 scripts and 14 protocols available for download, including those for microscope control, particle tracking, three dimensional segmentation, and even spot detection using wavelets.

Published in Nature Methods (Nat Methods 9(7):690-6 (2012)). Icy can be downloaded at http://icy.bioimageanalysis.org/ Strength: Open-source. Centralized repository of 205 plugins, 50 scripts and 14 protocols


Rate and comment plugins 5D Search and install features directly from Icy Graphical programming with protocols Write scripts in javascript or python Automatic bug reports Native ImageJ integration 100% compatible Native Micro-Manager integration Share your plugins and protocols online Can run headless Intuitive user interface Online management of plugins Connect Icy to Matlab Interactive widgets Build your graphical interface with EzPlug Use the power of your graphic card with OpenCL Loaded with 20 up-to date libs Weaknesses No tutorial for plugins writing..yet See here: http://icy.bioimageanalysis.org/index.php?display=devDoc http://icy.bioimageanalysis.org/index.php?display=detailTag&tagId=29 and here: http://icy.bioimageanalysis.org/index.php?display=startDevWithIcy and also here: http://icy.bioimageanalysis.org/index.php?display=startDevWithIcy Image size limited to 2GigaByte per single 2D channel (means that an image of 40.000x40.000 can be handle by Icy. Still big !) Still you can have a stack of 100000x40Kx40kxUnlimited number of channel if you have RAM. Will be improved

Icy
Description

ImgLib2 is a generic, multi-dimensional data processing library allowing for processing algorithms to be defined in a data-type, dimension, and container independent manner. Due to its interface-based design, it is easy to write adapters to virtually all existing data containers. It is the basis of KNIME, ImageJ2 and a couple of Fiji plugins.

need a thumbnail
Description

Fiji is just ImageJ: a distribution of ImageJ (and ImageJ2) together with Java, Java 3D and a lot of plugins organized into a coherent menu structure. The main focus of Fiji is to assist research in life sciences. It is a free, open-source, community-driven project.

Fiji
Description

PALMsiever is a MATLAB-based application that allows the filtering (sieving) and analysis of localization-microscopy data. It provides the ability to render the data using different visualization algorithms and perform simple measurements on the point-localization data. It is extensible using simple MATLAB scripts and a number of plugins is already provided with the software itself, including a clustering algorithm and 3D rendering.

Strengths: intuitive, easy navigation through the point-localization data

Limitations: no multi-color

has function
PalmSiever logo
Description

deletes objects from an image by setting their pixel intensity values to 0.

has function
need a thumbnail
Description

rgbImage combines Grayscale images into a Color one.

has function
need a thumbnail
Description

Most of RestoreTools is now bundled with IR tools.

need a thumbnail
Description

Function to perform an erosion followed by a dilation morphological operation on binary and grayscale images.

need a thumbnail
Description

Computes the oriented contour of objects.

need a thumbnail
Description

Computes signed curvature along a line.

has topic
need a thumbnail
Description

Semi-automated cell tracking of 2D+time or 3D+time images based on manual annotations

has function
need a thumbnail
Description

This workflow estimates (densely distributed) object counts by the density of objects in the image without performing segmentation or object detection. Current version only works for 2D images of roundish objects with similar sizes on relatively homogeneous background. Users should provide a few labels of background and objects (especially on clustered objects), and the tool predicts the density of objects on the entire image. Counting is then estimated by integrating the density values on the whole image or specified rectangular regions of interests.

need a thumbnail
Description

Semi-automated segmentation of 3D objects (e.g. neurons) based on user-provided seeds.

need a thumbnail
Description

Fully-automated cell tracking of 2D+time or 3D+time images with some parameter tuning

has function
need a thumbnail
Description

flop mirrors x around the image vertical axis (horizontal reflection).

has function
need a thumbnail
Description

Filters an image using the fast 2D FFT convolution product.

need a thumbnail
Description

Fill holes in objects.

has function
need a thumbnail
Description

A function to perform morphological operation on binary and grayscale images.

need a thumbnail
Description

‘’’Squassh’’’ is a tool for 2D and 3D segmentation and quantification of subcellular shapes in fluorescence microscopy images. It provides globally optimal detection and segmentation of objects with constant internal intensity distribution, followed by object-based colocalization analysis. The segmentation computed by Region Competition can optionally correct for the PSF of the microscope, hence providing optimally deconvolved segmentations. Part of the mosaic suite

Description

Image segmentation based on the MOSAIC Discrete region competition algorithm. 

Description

Easy-to-use, computationally efficient, two- and three-dimensional, feature point-tracking tool for the automated detection and analysis of particle trajectories as recorded by video imaging in cell biology. 


The tracking process requires no apriori mathematical modelling of the motion, it is self-initialising, it discriminates spurious detections, and it can handle temporary occlusion as well as particle appearance and disappearance from the image region. 


The plugin is well suited for video imaging in cell biology relying on low-intensity fluorescence microscopy. It allows the user to visualize and analyze the detected particles and found trajectories in various ways:

  • Preview and save detected particles for separate analysis
  • Global non progressive view on all trajectories
  • Focused progressive view on individually selected trajectory
  • Focused progressive view on trajectories in an area of interest

It also allows the user to find trajectories from uploaded particles position and information text files and then to plot particles parameters vs. time - along a trajectory

Description

This ImageJ plugin creates high resolution PSF images by averaging many bead im- ages as well as exploiting the assumption that the point spread function is rotationally symmetric with respect to the axial axis (z-direction).

Description

OMERO.webtagging is the umbrella name for tools developed to enhance use of text annotations (tags) in OMERO. There are two tools at present, autotag and tagsearch.

has function
need a thumbnail
has topic
has function
need a thumbnail
Description

Labeled images are integer images where the values correspond to different regions. I.e., region 1 is all of the pixels which have value 1, region two is the pixels with value 2, and so on. By convention, region 0 is the background and often handled differently.


has function
Description

This plugin can be used for inferring spatial interactions between patterns of spot-like objects in images or between coordinates read from a file. 

Description

This plugin can be used to add synthetic Poisson-distributed noise to an image in order to simulate shot noise of various signal-to-noise ratios. It can be used to generate benchmark images in order to assess the accuracy and robustness of image processing algorithms as a function of the noise level present in images.

has topic
need a thumbnail
Description

ImarisReader is a set of classes for reading the data stored in ims files. ImarisReader can read the primary image data, as well as the data for segmented objects: Cells, Filaments, Spots and Surfaces.

has function
Description
Description

CellTracker software is a platform for tracking nuclear and cytoplasmic fluorescence intensities from live cell microscopy time series data.


Requires visual C++

Description

Histogram-based background subtractor for ImageJ.

The implemented algorithm is based on the assumption that, compared to the background region, object (foreground) regions are small. The plugin builds local histograms and assumes the most occuring intensity to be part of the background.

Description

## Introduction CellCognition is a computational framework dedicated to the automatic analysis of live cell imaging data in the context of High-Content Screening (HCS). It contains algorithms for segmentation of cells and cellular compartments based on various fluorescent markers, features to describe cellular morphology by both texture and shape, tools for visualizing and annotating the phenotypes, classification, tracking and error correction. Events such as mitosis can be automatically identified and aligned to study the temporal kinetics of various cellular processes during cell cycle. CellCognition can be used by novices in the field of image analysis and is applicable to hundreds of thousands of images by parallelization on compute clusters with minimal effort. The tool has been successfully applied to quantitative phenotypic profiling of cell division, yet machine learning enables CellCognition to be used for the analysis of other dynamic processes. ## Backends Following libraries are used: * numpy * VIGRA * PyQT * hdf5 * matplotlib * sklearn * Machine Learning in Python

Cell Cognition logo
Description

WIS-NeuroMath - is a software tool for automated analysis and quantification of fluorescent microscopy images of Nerve cells, in both in vivo and in vitro preparations. It allows for accurate detection of neurites in challenging images. Following neurite detection, different types of processing can be carried: Cell Morphology of cultured neurons, Neurite Length Analysis and Ganglion Explant Analysis. Usefull also for angiogenesis analysis.

has function
Description

EnhanceEdges enhances or identifies edges in an image, which can improve object identification or other downstream image processing.

need a thumbnail
Description

This plugin threshold an image using the Maximum Entropy algorithm, which aims at maximizing the inter-class entropy. Entropy is defined as -sum(p.*log2(p)), where p contains the histogram bin counts. This thresholding is very useful to segment images with few bright objects on large dark background. In ImageJ/FIJI you can acces this tool in Image->Adjust->Threshold and choose in the list In Aphelion, you can access this tool in Seglmentation->Threshold-> AphImgEntropyThreshold

need a thumbnail
Description

The purpose of this plugin is to register—in other words, to align or to match—two images, one of them being called the source image and the other the target image.

has topic
has function
Description

This module performs a series of morphological operations on a binary image or grayscale image, resulting in an image of the same type. 

need a thumbnail
Description

This plugin provides a painter to visualize 2D flows. 2D Flows are couples of two sequences, one for the horizontal displacements, the other for the vertical displacements. This plugin provides a painter that draws flow arrows on top of another sequence.

need a thumbnail
Description

This plugin facilitates the assembly of a mosaic of overlapping individual images, or tiles. It provides a semi-automated solution where the initial rough positioning of the tiles must be performed by the user, and where the final delicate adjustments are performed by the plugin.

The MosaicJ plugin requires that a second plugin, named TurboReg, is installed. 

has function
need a thumbnail
Description

This plugin allows to analyze the local direction and frequency of sinusoidal waves, for example muscle repetitive stripy pattern.

The output are optionally smoothed lambda (inversely proportional to the frequency) and phi (direction in degrees).

has topic
has function
Description

This plugin performs Strahler analysis on topographic skeletons (2D/3D). Strahler numbering is a numerical procedure that summarizes the branching complexity of mathematical trees.

has function
Description

Three different methods for correcting fluorescence bleaching. 1. Simple (framewise ratio based) 2. Exponential (curve fitting with exponential decay model) 3. Histogram matching (register histogram shape. with 16 bit, it takes long time... it should be improved).

has function
Description

This plugin automatically threshold an image using the Mixture Modeling algorithm. It is an histogram-based technique that assumes that the histogram distribution is represented by two Gaussian curves.

has function
need a thumbnail
Description

View your multi-channel data as a montage with one image per channel plus a merged, color channel (useful to create figures for communication). 

This viewer plugin will split all N channels of the active sequence into a montage of N+1 images, with one image for each channel, plus an additionnal color (merge) rendering.

Description

Anisotropic filter implements the classical Coherence Enhancing Diffusion Filter [Weickert]. The plugins works on the first band of a 2D, 3D and 4D sequence. 2D and 3D algorithms are proposed. For the 3D case 2 options are available: CED 1D option is the classical filter that acts mainly on the most homogeneous structure direction; CED 2D option acts on the tangential plane of the structure.

has function
need a thumbnail
Description

Image segmentation by representative colors selection. Two versions are available :

  • thresholding
  • positive and negative colors selection and SVM learning
has function
null
Description

"

Coloc 2 is Fiji's plugin for colocalization analysis. It implements and performs the pixel intensity correlation over space methods of PearsonMandersCostesLi and more, for scatterplots, analysis, automatic thresholding and statistical significance testing.

Coloc 2 does NOT perform object based colocalization measurements, where objects are first segmented from the image, then their spatial relationships like overlap etc. are measured. This complementary approach is implemented in many ways elsewhere.

"

Description

Released in 2007, there is a newer "remastered" version "DeconvolutionLab2" (2017)

need a thumbnail
Description

A complete parametric framework and set of MATLAB tools for computing steerable wavelet frames in 2-D.

need a thumbnail
Description

Provides a selection of spatial, separable and customizable filters in 1D and 2D, with OpenCL implementation if supported.

has function
Description

This originally came from this module.

Currently it is available as the ilastik CellProfiler plugin (see this image.sc post for details).

need a thumbnail
Description

TrackProcessor for the TrackManager plugin that allows importing/exporting tracks. Input and output files are in the .xml format used for the ISBI'2012 Particle Tracking Challenge. Tracks are loaded/exported in/from the TrackManager plugin

has function
Description

Saves a RGB image (typically a screenshot) into a CMYK TIFF (required by publishers for high-fidelity color printing).

Description

Wavelet Spot Detector for Blocks, to integrate in Icy protocols.

Description

It measures the degree and nature of textures within images and objects to quantify their roughness and smoothness.

need a thumbnail
Description

Ads a magnifier on top of the default 2D viewer to zoom in and inspect individual pixel values

need a thumbnail
Description

The track manager enables the use of DSP-like trackProcessors. This can affect the display of tracks, selection in time or by ROIs, and also compute some views like the overlaid and animated local flow graph, polar graph.

has function
Description

IdentifySecondaryObjects identifies objects (e.g., cells) using objects identified by another module (e.g., nuclei) as a starting point.

has topic
Description

DisplayScatterPlot plots the values for two measurements.

has function
need a thumbnail
Description

CorrectIlluminationCalculate calculates an illumination function that is used to correct uneven illumination/lighting/shading or to reduce uneven background in images.

has topic
Description

The swiss army knife of plugin developers. Automatically generates elegant graphical interfaces with rich and intuitive user interaction based on your algorithm’s parameters.

need a thumbnail
Description

Automatic detection of the variance (i.e. standard deviation, power) of the noise that affects a sequence, assuming that it is a white additive Gaussian noise.

Description

Browse files in directories with thumbnails view

has function
Description

This CellProfiler module allows smoothen the image with a choice from various algorithms: - Fit Polynomial - Gaussian Filter - Median Filter - Bilateral Filter - Circular averaging - "Smooth to Average" filter.

need a thumbnail
Description

Fills holes below a given threshold. 3D data is currently processed slice per slice.

has function
need a thumbnail
Description

Translate the tracks so that first detection is at 0,0,0 location.

has function
need a thumbnail
Description

Track Processor to color tracks in the Track Manager

Description

Crop crops or masks an image.

This module crops images into a rectangle, ellipse, an arbitrary shape provided by you, the shape of object(s) identified by an Identify module, or a shape created using a previous Crop module in the pipeline.

has function
need a thumbnail
Description

not available anymore in version 3.0 and up?

has function
need a thumbnail
Description

3D reslicing and threshold-enabled 3D visualization.

has topic
has function
Description

Fills the holes in all the ROI of the active sequence (also works in Protocols).

has function
need a thumbnail
Description

OverlayOutlines is a module from CellProfiler to place outlines of objects over a desired image.

need a thumbnail
Description

The grayscale watershed segmentation is useful to segment particles in contact when the model of shape is unknown a priori.

has function
need a thumbnail
Description

This plugin copies the pixel size from the calibration of one image or stack to a second image or stack. This allows one to copy the spatial calibration from one stack to another.

A second dialog allows to enter the scale factors.

need a thumbnail
Description

This plugin extracts groups of connected pixels in 2D and 3D based on their intensity and that of the background. Works on both binary and gray-scale data. Output can be pushed to the swimming pool for other plug-ins to further exploit the extracted objects.

has function

MIJ

Description

A Java package for running ImageJ and Fiji within Matlab.

has function
need a thumbnail
Description

A TrackProcessor that allows the user to monitor, visualize, and export, the intensity profile of tracks in time lapse sequences of 2D images.

has function
need a thumbnail
Description

This display the Instant Speed of tracks for the Icy Track Manager.

Description

GrayToColor takes grayscale images as input and assigns them to colors in a red, green, blue (RGB) image or a cyan, magenta, yellow, black (CMYK) image. Each color’s brightness can be adjusted independently by using relative weights.

has topic
has function
Description

Quantize a color image in any given number of colors.

has function
need a thumbnail
Description

The CreaTools are a suite of medical image processing and visualization software and development tools. They are developed by CREATIS, a research unit with extensive experience in the medical image processing field. 

Description

Calculate Statistics calculates measures of assay quality (V and Z' factors) and dose response data (EC50) for all measured features made from images.

has function
need a thumbnail
Description

This plugin explores the algorithms for reconstructing scientific images as a combination of other scientific images drawing from a large database of scientific imagery. 

Description

Deprecated component -- superseded by SNT. Legacy description follows:

---

Plugin designed to allow easy semi-automatic tracing of neurons or other filament-like structures (e.g., microtubules, blood vessels) through either 2D images or 3D image stacks. Data can be imported and exported in SWC files for interaction with other software, or details of the traces can be exported as CSV files for analysis in spreadsheets or statistical software.

This plugin is included in Fiji by default.

Description

Import ROI from a zip file produced with ImageJ's ROI manager. Works as a standalone plugin and as a block for Protocols

has topic
has function
need a thumbnail
Description

Enhances the global contrast by equalizing the histogram. This plugin transforms pixel intensities so that they are uniformly distributed over the gray-scale range. It operates on the selected channel of each image of a sequence. This operation is also called "histogram flattening".

Description

Built-in component of FIJI to calculate the local thickness map of  a binary image in 2D or 3D. Local thickness is defined as “The diameter of the largest sphere that fits inside the object and contains the point”

need a thumbnail
Description

This plugin creates a non-destructive grid of lines, crosses or points on the current image or stack. You can specify the grid type (lines, crosses or points), the area per point (in pixels or physical units), and the color.

has topic
Description

Plugins for 3D Image processing and Analyisis in ImageJ. Previously (?) known as 3D ImageJ Suite.

need a thumbnail
Description

This segmentation method performs a N-class thresholding based on a K-Means classification of the image histogram, then extracts objects in a bottom-up manner using user-defined minimum and maximum object sizes. Very useful to detect clustered objects in fluorescence microscopy.

need a thumbnail
Description

This plugin allows to open images embedded in PDFs.

has function
need a thumbnail
Description

This plugin parses arbitrary mathematical expressions and compute results using images as variables.

has topic
has function
Description

This plugin combines the idea of using fiduciary markers, local descriptors and geometric hashing and applies global optimization. It can register an arbitrary number of partially overlapping point clouds. It is robust with respect to the amount of incorporated beads, bead distribution, amount of overlap, and can reliably detect non-affine disturbances (e.g. abrupt agarose movement) that might occur during imaging.

For details about the SPIM registration, fusion & deconvolution please have a look at the Multiview Reconstruction Plugin. It is much more powerful, flexible and completely integrated with the BigDataViewer.

need a thumbnail
Description
  • Counts the number of 3D objects in a stack.
  • quantifies for each found object the following parameters:
    • 3D intensity related measurement (with possible redirection to an image with the actual intensity value to be measured, for example for two channels measurements)
    • Volume and shape factors measurements, surface etc...
  • generates results representations such as:
    • Objects' map;
    • Surface voxels' map;
    • Centroids' map;
    • Centres of masses' map.

As ImageJ's “Analyze Particles” function, 3D-OC also has a “redirect to” option, allowing one image to be taken as a mask to quantify intensity related parameters on a second image. But unlike the Analyze particle, it include a thresholding option, meaning that you can start from a gray level  stack, not necessarily a binary mask.

To use it, first set the list of measurements by editing 3D OC Options. Both (3D Object counter and 3D OC Options are now in the default Fiji "Analyze" menu.

need a thumbnail
Description

Fill regions in images.

has function
need a thumbnail
Description

Short Description

Execute complex math operations on sequences, such as '3*sequence1 + log(sequence2)/sequence3', in a single step. All the operations are executed pointwise.

Documentation

This plugin is similar to the Math operations plugin: it provides usual pointwise math operations on sequences, such as addition, product, absolute value extraction, rounding to the closest integer, etc. However, it also allows the user to perform complex combinations of theses operations, using a mathematical expression interpretor.

need a thumbnail
Description

A set of classes and functions which can be used by plugins performing spot detection and spot tracking.

need a thumbnail
Description

Add some noise with customizable characteristics (Gaussian noise, Poisson noise, salt & pepper, etc.) to a sequence. ICY plugin.

need a thumbnail
Description

Used to be the micro manager libraries but now that is an empty plugin (provided for backward compatibility).

need a thumbnail
Description

Plots an intensity profile of a given ROI.

Can plot mean over T or/and Z too.

has topic
has function
need a thumbnail
Description

A fun simulator. It's not very useful for biology but it's a good demo!

need a thumbnail
Description

This module has been deprecated; in Cell Profiler 3.0, it is a function in module "Measurement"

need a thumbnail
Description

CellProfiler FlagImage module allows to assign a flag if an image meets certain measurement criteria that you specify (for example, if the image fails a quality control measurement). The value of the flag is 1 if the image meets the selected criteria (for example, if it fails QC), and 0 if it does not meet the criteria (if it passes QC).

has function
Description

Displays 3D data as 2D montages of all slices.

has function
need a thumbnail
Description

This is an example that find all the image.bin.gz files from channel 01 under a directory and makes an image stack of all the slices numbered 23. It needs to be customized to be useful to you.

need a thumbnail
Description

The SSIM is an index measuring the structural similarity between two images. It is valued between -1 and 1. When two images are nearly identical, their SSIM is close to 1.

need a thumbnail
Description

Displays a live tool tip on the current focused ROI in an image.

The tooltip displays the following informations about the ROI:
– position and size.
– number of interior points and contour points.
– perimeter, area, surface area, volume.
– min, max, mean intensity.

This plugin is a daemon plugin, that means plugin is automatically loaded when Icy starts.

has function
need a thumbnail
Description

Dedicated to score tracking dataset from the ISBI tracking challenge

has function
Description

An ImageJ plugin for evaluate intra-nuclear 3D cross-distances between fluorescent spots in multi-channel images ![image](http://bigwww.epfl.ch/sage/soft/spotdistance/meta/splash.png)

has function
need a thumbnail
Description

ICY plugin,

the right click on sequences and ROIs will open a menu with various features, such as image and ROI copy, data conversion and extraction. See documentation for more information.

has function
need a thumbnail
Description

An ImageJ plugin for iterative deblurring.

has function
need a thumbnail
Description

The aim of this plugin is to characterise the orientation and isotropy properties of a region of interest (ROI) in an image, based on the evaluation of the gradient structure tensor in a local neighborhood. 

has topic
Description

Drag, rotate & zoom in your image using two-finger gestures (in 2D and 3D).

has function
need a thumbnail
Description

Compute and display the histogram of a sequence, with a more accurate control on the histogram parameters (such as the number of bins) than the built-in Icy widget. In particular, the histogram can be computed either over a whole sequence or over a sub-region defined by a ROI.

has function
Description

For post-processing analysis, use Analyze Skeleton plugin written by the same author.

need a thumbnail
Description

Grab random images from Flickr :

  • in recent uploads
  • in interestingness stream
  • from tags search
has topic
has function
need a thumbnail
Description
has function
Description

The plugin Landmark Correspondences calculates a transformation between two corresponding landmark clouds and renders a transformed image. The landmarks are read from point selections over two images. The transformation is estimated by a least squares or Moving Least Squares fit for the available models.

Description

TrakEM2 is an ImageJ plugin for morphological data mining, three-dimensional modeling and image stitching, registration, editing and annotation (Fiji comes with TrakEM2). It supports arbitrary-sized datasets. 

Menu of TrakEM2
Description

Perform morphological operations (like erode and dilate or open and close) on images.

need a thumbnail
Description

This plugin simulates color blindness. 
It is based on http://quarkphysics.ca/phys1/light/u-light.htm

has function
Description

This ImageJ plugin segments the image in classes by thresholding. It uses the same algorithm found in Otsu Thresholding, but was adapted to output more than 2 classes out of the process.

has function
need a thumbnail
Description

Identify objects (as nuclei) within an image without needing the assistance of another cellular feature (as cell). 

CellProfiler
Description

Use Icy as an image viewer from Matlab.

has function
need a thumbnail
Description

This is a set of Matlab routines for computing generalized Daubechies wavelet filters.

need a thumbnail
Description

ImageMath performs simple mathematical operations on image intensities, like addition, subtraction, multiplication, division...

has topic
has function
Description

Label images according to their position in plates. 

has function
Description

When opening the Pannoramic Viewer you see all of your virtual slides in thumbnail view. Selecting one (or up to 10 at a time) the slide gets under the virtual objective of the virtual microscope. Here you can move and change the magnification of the slide quickly and easily using the mouse. Emphasizing 'quickly' is important considering the fact that the size of an average virtual slide can easily be more than 1 GB.


Main characteristics:

  • Seamless zooming and moving of the virtual slide
  • Bookmarking (annotating) on the spot, i.e. defining the specific part of the sample by drawing; finding and reading of previously made bookmarks
  • Easy and precise measurements
  • Real-time changing of brightness, contrast and color bias
  • Fluorescent slide handling, separate channel view & pseudo-colorization
  • Slide uploading and downloading for teleconsultation
  • Synchronized viewing (moving and zooming) of multiple slides for comparison purposes
  • Publication quality image capture of displayed areas (.JPG, .BMP, .TIFF)
  • TIFF, MIRAX slide and Meta-XML export for Carl Zeiss AxioVision™ compatibility
  • Scanmap export for rescanning existing digital slides
  • Easily expandable functionality via the software modules
Description

The plugin analyses a point pattern (positions of objects of interest) distributed within a reference structure.

This analysis allows in particular to assess deviation from spatial randomness, and to reveal trends for clustering (attraction) or regularity (repulsion). No edge correction is performed, as it is assumed that no point is expected outside the reference structure.

This plugin comes together with 3D ImageJ suites plugin.

F-function plot
Description

A fork of PIL python package, with small collection of image import/export and image processing modules. See [Reference Documentation](http://pillow.readthedocs.org/en/latest/reference/index.html) for more details. Though this package mostly works in any platform, some of them are limited to Windows. This package is a part of [pythonxy](https://code.google.com/p/pythonxy/).

need a thumbnail
Description

A toolbox that contains Matlab routines for computing the forward and backward generalized Riesz-wavelet transform of high order is provided. It includes utilities for orientation computation, coefficients steering, basic denoising, frame learning.

Description

NuclearQuant is a QuantCenter module. It is designed for cell nuclei detection and quantification of IHC stained samples. NuclearQuant measures several morphological features besides stain intensity. The cell nuclei classification and the final score are calculated by the intensity score and the proportion score.

has topic
NuclearQuant
Description

not available anymore in version 3.0 and up?

need a thumbnail
Description

This plugin calculates the Nyquist sampling, in the radial and axial direction for your Microscope.

has function
need a thumbnail
Description

The fractional splines are an extension of the polynomial splines for all fractional degrees α > -1. Their basic constituents are piecewise power functions of degree α. One constructs the corresponding B-splines through a localization process similar to the classical one, replacing finite differences by fractional differences. The fractional B-splines share virtually all the properties of the classical B-splines, including the two-scale relation, and can therefore be used to define new wavelet bases with a continuously-varying order parameter

has function
Description

A MATLAB package is made available for computing the fractional smoothing spline estimator of a 1D signal, and for generating fBms (fractional Brownian motion).

has function
need a thumbnail
Description

This version replaces the old Arrow_.class tool that was present in Fiji before. The main changes are the ability to draw the arrow as a floating selection, and to tune its shape.

Warning: Since ImageJ version 1.43n, a similar tool, made by Wayne Rasband, does a similar thing from the ImageJ core, see here.

has topic
has function
need a thumbnail
Description

The EzPlug library is meant to help developers write plug-ins fast and efficiently. This tutorial shows EzPlug's features.

has function
need a thumbnail
Description

Icy Morphomath operators: erosion, dilation, opening, closing, top-hat, gradient, distance map, skeleton and watershed.

need a thumbnail
Description

The smoothing is applied by the way of a bi-exponential filter, itself realized by a pair of one-tap recursions. It is therefore very fast; moreover, its computational cost is truly independent of the amount of smoothing. Meanwhile, the preservation of edges is obtained by a range filter akin to the range filter found in a bilateral filter. More technical details are available here.

The plugin allows one to control the amount of smoothing, the type of range filter, its broadness, and to iterate the filter several times if desired. We illustrate in Figure 2 a possible outcome of this filter. Here, we iterated the BEEPS 10 times with a Gaussian range filter, σ = 10, and the spatial decay λ = 0.1.

Description
has function
Description

The 3D Rotation plug-in allows you to record a 360 degree rotation of the current focused 3D VTK viewer about the vertical screen axis.

The 'angle step' parameter indicates the deviation in degrees between two consecutive snapshots. Increasing the angle will increase rotation speed (up to a point where it might look like jumping more than rotating) and reduce the final movie length.

need a thumbnail
Description

JRuby script that will take an image stack and generate from it an image that should appear in 3D when viewed through red and cyan glasses. All that this does is to do two maximum intensity projections from two slightly different angles and merges them together.

has function
Description

The purpose of this plugin is to create a text file with a list of files from Gatan’s 3View montage image stacks. This text file can then be used to automatically import all the images into TrakEM2, as they are, stored in the original directories.

Description
has function
Description

This plugin perform various 3D filters on 8-bits or 16-bits gray-levels stacks :

  • 3D median

  • 3D mean

  • 3D minimum

  • 3D maximum

  • 3D maximum local

  • 3D tophat (detect bright spots, TH=I-max(min(I)) )

need a thumbnail
Description

3D viewer provides hardware-accelerated 3D visualization of image stacks as volumes, surfaces and orthoslices.

has function
Description

This plugin registers (= aligns, matches) a stack of image slices.

Description

Fast Fourier Transform (FFT) for 2D/3D images.

has function
need a thumbnail
Description

Calibrator for Pixel Size in Calibrator manager.

has function
need a thumbnail
Description

An example ImageJ plugin illustrating how to create and display 3D tubes and 3D spheres in the 3D Viewer.

need a thumbnail
Description

Short Description

Execute some simple math operations on sequences, such as addition, product, absolute value extraction, rounding to the closest integer, etc. All the operations are executed pointwise.

has function
need a thumbnail
Description

An example Clojure script illustrating how to run concurrent threads that perform independent tasks, and how to combine their results afterwards.

has function
need a thumbnail
Description

Produces files that allow individual batches of images to be processed separately on a cluster of computers.

has topic
has function
null
Description

FlipAndRotate flips (mirror image) and/or rotates an image

has function
need a thumbnail
Description

This module identifies objects that are contained within in a grid pattern, allowing you to measure the objects using Measure modules. It requires you to have defined a grid earlier in the pipeline, using the DefineGrid module. For several of the automatic options, you will need to enter the names of previously identified objects. Typically, this module is used to refine locations and/or shapes of objects of interest that you roughly identified in a previous Identify module. Within this module, objects are re-numbered according to the grid definitions rather than their original numbering from the earlier Identify module. If placing the objects within the grid is impossible for some reason (the grid compartments are too close together to fit the proper sized circles, for example) the grid will fail and processing will be canceled unless you choose to re-use a grid from a previous successful image cycle.

has topic
has function
Description

Displays a scale bar overlay on the sequence.
Warning: this plugin needs correct sequence metadata to be effective. Otherwise it will display wrong values.

has topic
has function
need a thumbnail
Description

Fiji Archipelago is a tool designed to make it easy for programmers to export Fiji/ImageJ functionality over a network to several other computers.

need a thumbnail
Description

Color space conversions between image modes.

has topic
Description

ExpandOrShrinkObjects expands or shrinks objects by a defined distance.

has function
need a thumbnail
Description

H2 database packaged as an Icy plugin

See http://www.h2database.com

has function
Description

DisplayDensityPlot plots measurements as a two-dimensional density plot.

has function
need a thumbnail
Description

Merges images from different columns to one image object as follows: the input images are regarded as one single line of pixels (depending on the iteration order of each underlying image factory). 

need a thumbnail
Description

Identifies dead worms based on a couple of parameters. 

has topic
has function
Description

Process an image using Perreault’s modern constant-time median filtering algorithm.

has function
need a thumbnail
Description

This tutorial explain how to create an intensity profile over an ROI.

need a thumbnail
Description

Enables Python scripts that are run inside Icy to communicate with other Python instances outside Icy. This allows the access to CPython-only libraries such as Numpy.

Resources requiring this include: CalloseCounter, BioFlow, EvaFE In Python

need a thumbnail
Description

MonogenicJ performs multiresolution monogenic analyses of 2D images. It extracts wavelet-domain features that characterize the local orientation, the phase and the dominant frequency of an image patch at various levels of resolution.

has function
need a thumbnail
Description

Wavelet-based method to merge a stack of micrographs taken at different focal positions (aligned along the optical axis) into a single, entirely focused composite image.

has function
Description

This plugin allows the creation of custom animations for 3D viewing. It will generate a new sequence that can be edited in Icy, and saved.

The animation is based on key framing, as in most of 3D rendering software projects.

has topic
has function
Description

Layer for the 3D Viewer, allowing the user to move the camera in a more intuitive way.

has function
need a thumbnail
Description

Manual angle measurements. 

No javadoc accessible, but can be downloaded from the webpage. 

Description

Mice Profiler tracks multiple mice from a top view video.

need a thumbnail
Description

Mice Profiler uses geometrical primitives to model and track two mice without requiring any specific tagging. The program monitors a comprehensive repertoire of behavioral states and their temporal evolution, allowing the identification of key elements that trigger social contact.

Mice Profiler Label Analyser performs temporal analysis of data from Mice Profiler.

need a thumbnail
Description

Outline The incessant development of improved microscopy imaging techniques, as well as the advent of highly selective fluorescent dyes has made possible the precise identification of tagged molecules in almost any biological specimen. Of particular interest are the visualization and the study of living cells, which induce tight constraints on the imaging process. To avoid the alteration of the sample and to achieve a high temporal resolution, low fluorophore concentrations, low-power illumination and short exposure time need to be used in practice. Such restrictions have a tremendous impact on the image quality. This is why we have recently introduced a new method, coined PURE-LET [1,2,3], for efficient, fast, and automatic denoising of multidimensional fluorescence microscopy images.

has function
need a thumbnail
Description

This plugin calculates the optic flow for each pair of images made with the given stack.

has function
need a thumbnail
Description

This plugin provides an extended depth of field algorithm to obtain in focus microscopic images of 3D objects and organisms using different algorithms: Sobel, variance, real and complex wavelets.


has function
Description

Manually selecting line ROIs and align two images. 

has function
Description

Automatically segment the boundary of a nucleus or cell starting from an approximate ROI. Supports 2D and 3D images and tracking of slowly moving cells. Ideal to study cell morphodynamics.

has topic
has function
Description

Six 2D differential operations are implemented in this ImageJ plugin. - Gradient Magnitude - Gradient Direction - Laplacian - Largest Hessian - Smallest Hessian - Hessian Orientation

need a thumbnail
Description

 Fast edge and ridge detection, irrespective of their orientation.

need a thumbnail
Description

The method to use for thresholding. Currently only OTSU is available.

has function
need a thumbnail
Description

Transposes an image by swapping its spatial dimensions.

need a thumbnail
Description

A Mathematica package available for the symbolic computation of exponential spline related quantities: B-splines, Gram sequence, Green function, and localization filter.

has function
need a thumbnail
Description

Fill holes in objects 

Included into EBImage Image processing and analysis toolbox for R

Description

The input image is aligned using a simple cross-correlation approach on the smoothed image.

This node is contained in KNIME Image Processing extension

has function
Description

paintObjects

has function
need a thumbnail
Description

Library used by Micro-Manager for fast acquisition.

Description

Applies average filtering to images in n-dimensions

Description

This package implements the interscale orthonormal wavelet thresholding algorithm based on the SURE-LET principle. A multichannel extension is also available. Java Applets are available too.

has function
need a thumbnail
Description

A toolbox to chain image analysis processes.

has function
need a thumbnail
Description

Wavelet-based statistical parametric mapping, a toolbox for SPM that incorporates powerful wavelet processing and spatial domain statistical testing for the analysis of fMRI data.

need a thumbnail
Description

Automatic finding of image features are very convenient for registering two images to align them in proper orientation. Two image plugins are implemented for extracting image features and are placed as menu items at: [Plugins > Feature Extraction > Extract SIFT Correspondences] and [Plugins > Feature Extraction > Extract MOPS Correspondences].

For more details, see the linked page in Fiji wiki. For details about SIFT algorithm, see 2569. For more details about MOPS algorithm, see 2570.

need a thumbnail
Description

The Sholl technique is used to describe neuronal arbors. This plugin can perform Sholl directly on 2D and 3D grayscale images of isolated neurons. Its internal algorithm to collect data is based upon how Sholl analysis is done by hand — it creates a series of concentric shells (circles or spheres) around the focus of a neuronal arbor, and counts how many times connected voxels defining the arbor intersect the sampling shells. The major advantages of this plugin over other implementations are:

sholl analysis
Description

Bio-Formats is a standalone Java library for reading and writing life sciences image file formats. It is capable of parsing both pixels and metadata for a large number of formats, as well as writing to several formats. The primary goal of Bio-Formats is to facilitate the exchange of microscopy data between different software packages and organizations. It achieves this by converting proprietary microscopy data into an open standard called the OME Data Model, particularly into the OME-TIFF file format. ### Command Line Tools Bioformats could also be used as stand alone application from command line. See [Bioformats command line tools introduction.](http://www.openmicroscopy.org/site/support/bio-formats5/users/comlineto…)

has function
need a thumbnail
Description

Some functions for PDE filtering.

has topic
has function
need a thumbnail
has topic
has function
Description

"This ImageJ plugin (CGE) is a semi-automatic tool to detect and track moving cell, and to measure the fluorescent protein expression level. CGE extracts the trajectory of the cells by tracking their displacements, makes the delineation of cell nucleus or whole cell, and finally yields measurements of various features, like reporter protein expression level, cell displacement."

has function
Description
has function
Description

This plugin permit to measure the signal spread of a molecule with respect to the cell area.

Description
has function
Description

2D Image registration method based on elastic deformations represented by B-splines.

Description

An ImageJ plugin for manually tracking objects by mouse clicking. 

This plugin is bundled with Fiji. 


has function
Description

This plugins allows debleaching of time sequences of fluorescence images.

has function
need a thumbnail
Description

Bundled with Fiji. "Do all" is the great feature...

has function
Description
Description

This plugin shows the color distribution within a 3D-color-space. Extensive documentation is available atwww.f4.fhtw-berlin.de/~barthel/ImageJ/ColorInspector/help.htm.

Color Inspector 3D is also available as a stand-alone program that uses ImageJ as a library. To run it, download ColorInspector3D.jar and double click on it. On Windows, Java 5.0 or later must be installed

Description

Choose the best auto thresholding technique for your data. 

has function
Description

It is used to upload a file (not just images) meant for the ImageJ developers. You might need to do this e.g. when the file is too large for email attachments, or when you want to accompany a bug report with a large image. To prevent abuse of this facility, access to the uploaded images is restricted to trusted admins.

has topic
need a thumbnail
Description

Diagnose bugs in Icy

Description

This tutorial explain how to create a simple Area ROI.

has function
need a thumbnail
Description

View a single channel of a 2D image as a 3D elevation map (X,Y,Intensity).

has function
need a thumbnail
Description

The purpose of the ImageJ Updater is to keep you up-to-date with all components of ImageJ (or Fiji), i.e. the macros, scripts, plugins and the core components (libraries) needed by the plugins.

As of 2011, the ImageJ Updater can handle 3rd-party update sites, i.e. anybody can set up their own update site which users can follow.

Description

Allows the identification of objects by subtracting secondary objects from primary objects. For example allows to segment the cytoplasm by subtracting nuclei from cells. 

Description

This plugin provides import and export Icy sequences into Matlab native .mat files from the protocol framework.

has function
need a thumbnail
Description

Fill holes in a binary image.

has function
need a thumbnail
Description

This plugin is a tutorial for the audio and video editing library Xuggler for developers. The slider will show the right image at the exact frame.

has function
need a thumbnail
Description

Computes RCC8D relationship in MereoTopology. Inputs should be labelled images in unsigned byte of short format.

need a thumbnail
Description

Edge detection by Deriche's method.

Description

Shows how to listen active sequence / viewer events.

null
Description

FilterObjects eliminates objects based on their measurements (e.g., area, shape, texture, intensity).

has function
need a thumbnail
Description

Details how to listen and use events provided by the main interface.

need a thumbnail
Description

This module lets you outline the objects in an image using the mouse.

has topic
has function
Description

Tutorial explaining how to display a JFreeChart graph in Icy.

has function
need a thumbnail
Description

Extract image features based on one or more intensity thresholds, and output the result as a labeled image or as a region of interest.

has function
need a thumbnail
Description

An example of a very simple overlay.

has function
need a thumbnail
Description

PSF Generator is a software package that allows one to generate and visualize various 3D models of a microscope PSF. The current version has more than fifteen different models.

3D diffractive models: scalar-based diffraction model Born & Wolf, scalar-based diffraction model with 3 layers Gibson & Lanni, and vectorial-based model Richards & Wolf, and Variable Refractive Index Gibson & Lanni model.

Defocussing a 2D lateral function with 1D axial function: the available lateral functions are: "Gaussian", "Lorentz", "Cardinale-Sine", "Cosine", "Circular-Pupil", "Astigmatism", "Oriented-Gaussian", "Double-Helix".

Optical Transfer Function generated in the Fourier domain: Koehler simulation, defocus simulation.

has topic
Description

This tool compute measures on the ROIs of the chosen sequence, updates the measures live when ROIs are changed and allows to copy/paste the measures to 3rd-party sheet edition softwares. Measures include geometric (bounding box) and intensity information.

It can complement the default ICY built inROI table, where measurements such as volume meausirements, intensity measurements, ... are built in and can be exported as excel as well.

has topic
need a thumbnail
Description

This plugin calculates a classification based on the histogram of the image by generalizing the IsoData algorithm to more than two classes.

This plugin works on 8-bit and 16-bit grayscale images only.

has function
need a thumbnail
Description

Python engine for Icy, based on Jython.

Required for: CalloseCounter, BioFlow, EvaFE In Python, Python Plugin Packager, Python Extractor, Jython execnet for Icy

need a thumbnail
Description

This plugin can display a 2D flow as a color-coded sequence, following the Middlebury color code.

has function
need a thumbnail
Description

This is a Fiji scripting demo using Clojure.

need a thumbnail
Description

Multi-touch provider allowing developers to let their plug-in receive rich multi-touch interaction. Currently supports Mac OS X, and generates raw finger events as well as pre-processed 2-finger gestures (pinch, drag, rotation).

has function
need a thumbnail
Description

Quote from the ImageJ wiki:

The Stitching Plugin (2d-5d) is able to reconstruct big images/stacks from an arbitrary number of tiled input images/stacks, making use of the Fourier Shift Theorem that computes all possible translations (x, y[, z]) between two 2d/3d images at once, yielding the best overlap in terms of the cross correlation measure. If more than two input images/stacks are used the correct placement of all tiles is determined using a global optimization. The stitching is able to align an arbitrary amount of channels and supports timelapse registration. To remove brightness differences at the tile borders, non-linear intensity blending can be applied.

The Image Stitching package comes with 2 different plugins:

  • Pairwise Stitching: Stitch two 2d-5d images, rectangular ROIs can be used to limit the area to search in.
  • Grid/Collection Stitching: Stitch an arbitrary amount of 2d-5d input images. It supports cases where the approximate alignment is known (grid, stored in file, metadata) as well as completely unguided alignment.
has function
need a thumbnail
Description

For each ROI, computes the number of pixel over a threshold. This plugin also provides the density and outputs results as an excel file.

has topic
need a thumbnail
Description

Deprecated ! Use the new Micro-Manager blocks plugin.

need a thumbnail
Description

This is a scripting example to process stack of images using AnalyzeSkeleton.

has function
need a thumbnail
Description

This plugin is bundled with Fiji. For installation in ImageJ1, download from the link below and manually install the class file. 

Quote:

The colour deconvolution plugin (java and class files) for ImageJ and Fiji implements stain separation using Ruifrok and Johnston's method described in [1]. The code is based on a NIH Image macro kindly provided by A.C. Ruifrok.
The plugin assumes images generated by colour subtraction (i.e. light-absorbing dyes such as those used in bright field histology or ink on printed paper). However, the dyes should not be neutral grey (most histological stains are not so).
If you intend to work with this plugin, it is important to read the original paper to understand how new vectors are determined and how the procedure works.
The plugin works correctly when the background is neutral (white to grey), so background subtraction with colour correction must be applied to the images before processing.
The plugin provides a number of "built in" stain vectors some of which were determined experimentally in our lab (marked in the source with GL), but you should determine your own vectors to achieve an accurate stain separation, depending on the stains and methods you use. See the note below.
The built-in vectors are :

  • Haematoxylin and Eosin (H&E) x2
  • Haematoxylin and DAB (H DAB)
  • Feulgen Light Green
  • Giemsa
  • Fast Red, Fast Blue and DAB
  • Methyl green and DAB
  • Haematoxylin, Eosin and DAB (H&E DAB)
  • Haematoxylin and AEC (H AEC)
  • Azan-Mallory
  • Masson Trichrome
  • Alcian blue & Haematoxylin
  • Haematoxylin and Periodic Acid - Schiff (PAS)
  • RGB subtractive
  • CMY subtractive
  • User values entered by hand
  • Values interactively determined from rectangular ROIs
has function
Description

This Jython script illustrates how to make an image interactive. It let you play chess within Fiji!

Description

Draws a contour plot on top of a sequence.

has function
need a thumbnail
Description

The Graph Cut plugin provides a way to obtain a globally smooth binary segmentation. As input, you have to provide a gray-scale image that represents the pixel affinities for belonging to the foreground. Via a single parameter you can adjust the smoothness of the segmentation.

has topic
Description

The Trainable Weka Segmentation is a Fiji plugin that combines a collection of machine learning algorithms with a set of selected image features to produce pixel-based segmentations. Weka (Waikato Environment for Knowledge Analysis) can itself be called from the plugin. It contains a collection of visualization tools and algorithms for data analysis and predictive modeling, together with graphical user interfaces for easy access to this functionality. As described on their wikipedia site, the advantages of Weka include: - freely availability under the GNU General Public License - portability, since it is fully implemented in the Java programming language and thus runs on almost any modern computing platform - a comprehensive collection of data preprocessing and modeling techniques - ease of use due to its graphical user interfaces - Weka supports several standard data mining tasks, more specifically, data preprocessing, clustering, classification, regression, visualization, and feature selection.

The main goal of this plugin is to work as a bridge between the Machine Learning and the Image Processing fields. It provides the framework to use and, more important, compare any available classifier to perform image segmentation based on pixel classification.

has topic
Description
has function
need a thumbnail
Description

EnhanceOrSuppressFeatures enhances or suppresses certain image features (such as speckles, ring shapes, and neurites), which can improve subsequent identification of objects.

need a thumbnail
Description

The plugin performs stitching of images of a tiled scan to reconstruct the image of the whole sample.

has topic
Description

KNIME is a user-friendly graphical workbench for the entire analysis process: data access, data transformation, initial investigation, powerful predictive analytics, visualisation and reporting. Its an open integration platform and provides over 1000 modules (nodes), including those of the KNIME community and its extensive partner network. One of these extensions adds the ability for image analysis allowing to process, segment and further analyze images which can easily be used in combination with the other extensions, potentially from other fields.

Knime
Description

DIPimage is a MATLAB toolbox for scientific image processing and analysis build on the DIPlib image library. It is a tool for teaching and research in image processing. Most operations are independent of dimensionality, and are defined for any data type that MATLAB can store. Many functions are available through a GUI, which makes them more accessible to novices. The interactive image display windows, to which images can be automatically displayed after each operation, provide great insight into the image data.DIPlib is a platform independent scientific image processing library written in C. It consists of a large number of functions for processing and analysing multi-dimensional image data. The library provides functions for performing transforms, filter operations, object generation, local structure analysis, object measurements and statistical analysis of images. Key design features include ample support for different data types (binary, integer, floating point, complex) and dimensionalities.