Particle tracking

Description


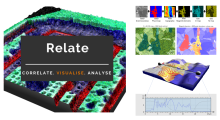
Relate is a correlative software package optimised to work with EM, EDS, EBSD, & AFM data and images.  It provides the tools you need to correlate data from different microscopes, visualise multi-layered data in 2D and 3D, and conduct correlative analyses.

  • Combining data from different imaging modalities (e.g. AFM, EDS & EBSD)

  • Interactive display of multi-layer correlated data

  • Analytical tools for metadata interrogation

  • Documented workflows and processes

Correlate

  • Import data from AZtec using the H5oina file format
  • Import AFM data
  • Correlate both sets of data using intuitive image overlays and image matching tools
  • Produce combined multimodal datasets

Visualise

  • 2D display of multi-layered data
  • 3D visualisation of topography combined with AFM material properties, EM images, and EDS & EBSD map overlays
  • Customisation of colour palettes, data overlays, image rendering options, and document display
  • Export images and animations

Analyse

  • Generate profile (cross section) views of multimodal data
  • Measure and quantify data across multiple layers
  • Analyse areas via data thresholding using amount of x-ray counts, phase maps, height, or other material properties.
  • Select an extensive range of measurement parameters
  • Export analytical data to text or CSV files
Relate analysis workflow example
Description

Track non-dividing particles in 2D time-lapse image.

has topic
has function
need a thumbnail
Description

Particle tracking in 2D time-lapse based on linking closest regional intensity minima (user defined noise tolerance) detected from Laplacian of Gaussian filtered images (user defined radius). A maximum linking distance is set (user defined).

has function
need a thumbnail
Description

This plugin ships automated methods for extracting trajectories of multiples objects in a sequence of 2D or 3D images. Up to version 2 it was known as the ‘Probabilistic particle tracker’ plugin.

need a thumbnail

Analysis of Microtubule Orientation: Tracking with ImageJ, Directionality Analysis with Matlab

Submitted by Perrine on Mon, 04/08/2019 - 14:02

We take an example image data of microtubule binding protein EB1, and will study how to automatically track those signals and how to analyze the tracking results. We use ImageJ for measuring the temporal changes in signal positions, and will feed the tracking results for analyzing their dynamics using Matlab in the following session.