Workflow

A workflow is a set of components assembled in some specific order to

  1. Measure and estimate some numerical parameters of the biological system or
  2. Visualization

for addressing a biological question. Workflows can be a combination of components from the same or different software packages using several scripts and manual steps.

Description

Scripts that allow to automatize  a multiplex analysis in qupath. The input is a multi channel image with one channel containing a staining of cell nuclei and the other channels containing markers for a specific molecule. The goal is to obtain a count of positive cells for the markers in the different channels and for the combinations of positive markers. The workflow also adds the total numbers of positive cells for each marker to the results table (cells positive for multiple markers are not counted positive for the individual markers in the original qupath result).

cells positive for different markers in different channels
Description

Spine Analyzer allows to semi-automatically segment dendritic spines in 3D+t images and to measure their volumes and the intensities of the signal within in different channels over time.

Neurites with segmented dendritic spines
Description

HistoMetrix is an advanced histology analysis software designed to simplify image processing and analysis for biologists and pathologists. Powered by the most advanced deep learning technology, HistoMetrix enables you to effortlessly uncover valuable insights and visualize results without the need for extensive technical expertise. Let’s explore the key features that make HistoMetrix the ultimate solution for histology analysis.

HistoMetrix leverages cutting-edge deep learning technology to streamline and simplify image processing for histology analysis. You can easily navigate through complex datasets, detect and analyze tissue structures, and extract meaningful information with just a few clicks. Research use only.


HistoMetrix combines advanced deep learning technology with cost-effectiveness, making it the ideal histology analysis software for biologists and pathologists. With HistoMetrix, effortlessly uncover valuable insights, visualize results, and simplify image processing, all while enjoying significant cost savings compared to other solutions. Benefit from affordable pricing plans, no expensive hardware requirements, and no need for costly training programs. HistoMetrix streamlines workflows, automates tasks, and provides efficient analysis tools, allowing you to save valuable time and resources. Experience the cost-effective solution for histology analysis and accelerate your research with HistoMetrix.

HistoMetriX for image analysis of histology slides
Description

While a quickly retrained cellpose network (only on xy slices, no need to train on xz or yz slices) is giving good results in 2D, the anisotropy of the SIM image prevents its usage in 3D. Here the workflow consists in applying 2D cellpose segmentation and then using the CellStich libraries to optimize the 3D labelling of objects from the 2D independant labels.

Here the provided notebook is fully compatible with Google Collab and can be run by uploading your own images to your gdrive. A model is provided to be replaced by your own (create by CellPose 2.0)

has function
example of usage
Description

This workflow describes a deep-learning based pipeline for reliable single-organoid segmentation and tracking in 2D+t high-resolution brightfield microscopy of mouse mammary epithelial organoids. The pipeline involves a four-layer U-Net to infer semantic segmentation predictions, adaptive morphological filtering to establish candidate organoid instances, and a shape-similarity-constrained, instance-segmentation-correcting tracking step to associate the corresponding organoid instances in time.

It is particularly focused on automatically detecting an organoid located approximately in the center of the first frame and track all its subsequent instances in the remaining frames, emphasizing on accurate organoid boundary delineation. Furthermore, segmentation network was trained using plausible pix2pixHD-generated bioimage data. Syntheric image simulator code and data are also available here.

Adapted from https://cbia.fi.muni.cz/research/spatiotemporal/organoids.html

GPU Accelerated Image Processing with CLIJ2

The NEUBIAS Academy at home about CLIJ2 gives an introduction to accelerated image processing using Graphics Processing Units (GPUs) in ImageJ/Fiji. Core concepts are explained as well as usage of the tools with the ImageJ Macro recorder and auto-completion in Fijis script editor. Furthermore, an outlook is provided of how the CLIJ project will develop in the coming years to provide long-term maintained access to GPU-acceleration in the Bio-Image Analysis context.

Fractal: A framework for processing OME-Zarr high content imaging data

Fractal is a framework to process high-content imaging data at scale and prepare it for interactive visualization. Fractal provides distributed workflows that convert TBs of image data into OME-Zarr files. The platform then processes the 3D image data by applying tasks like illumination correction, maximum intensity projection, 3D segmentation using cellpose and measurements using napari workflows. The pyramidal OME-Zarr files enable interactive visualization in the napari viewer.
These slides are from an early demo of Fractal in November 2022

Description

This workflow applies a Stardist pre-trained model (versatile_fluo or versatile_HE) depending on the input images ie. uses both models for a dataset including both fluorescence (grayscale or RGB where all channels are equal) and H&E stained (RGB where channels are not equal) images.

This version uses tensorflow CPU version (See Dockerfile) to ensure compatibility with a larger number of computers. A GPU version should be possible by adapting the Dockerfile with tensorflow-gpu and/or nvidia-docker images.

has topic
has function
need a thumbnail
Description

This workflow processes a group of images containing cells with discernible nuclei and segments the nuclei and outputs a binary mask that show where nuclei were detected. It performs 2D nuclei segmentation using pre-trained nuclei segmentation models of Cellpose. And it was developed as a test workflow for Neubias BIAFLOWS Benchmarking tool.

has topic
has function
need a thumbnail
Description

MiNA is a simplified workflow for analyzing mitochondrial morphology using fluorescence images or 3D stacks in Fiji. The workflow makes use of ImageJ Ops3D ViewerSkeletonize (2D/3D)Analyze Skeleton, and Ridge Detection. In short, the tool estimates mitochondrial footprint (or volume) from a binarized copy of the image as well as the lengths of mitochondrial structures using a topological skeleton. The values are reported in a table and overlays (or a 3D rendering) are generated to assess the accuracy of the analysis.

example skeleton image (from https://imagej.net/plugins/mina#processing-pipeline-and-usage)

GPU-Accelerating ImageJ Macro Image Processing Workflows Using CLIJ

Submitted by czhang on Thu, 04/27/2023 - 09:55

This chapter is part of this book. The chapter introduces GPU-accelerated image processing in ImageJ/Fiji. The reader is expected to have some pre-existing knowledge of ImageJ Macro programming. Core concepts such as variables, for-loops, and functions are essential. The chapter provides basic guidelines for improved performance in typical image processing workflows.

Description

The authors present an ImageJ-based, semi-automated phagocytosis workflow to rapidly quantitate three distinct stages during the early engulfment of opsonized beads.

Description

Junction Mapper is a semi-automated software (Java Desktop application) for analysing data from images of cells in close proximity to each other in monolayers. The focus of Junction Mapper is to measure the morphology of cell boundaries, define single junctions and quantify the length, area and intensity of the staining of different proteins localised at cell-cell contacts. The output are various unique parameters that assess the contacting interface between cells and up to two junctional markers.

junction mapper
Description

SynActJ (Synaptic Activity in ImageJ) is an easy-to-use fully open-source workflow that enables automated image and data analysis of synaptic activity. The workflow consists of a Fiji plugin performing the automated image analysis of active synapses in time-lapse movies via an interactive seeded watershed segmentation that can be easily adjusted and applied to a dataset in batch mode. The extracted intensity traces of each synaptic bouton are automatically processed, analyzed, and plotted using an R Shiny workflow. 

has function
SynActJ workflow
Description

ASTEC stands for Adaptive Segmentation and Tracking of Embryonic Cells. It proposes a full workflow for time lapse light sheet imaging analysis, including drift/motion compensation before the segmentation itself, and the capacity to correct for it.  It was used to process 3D+t movies acquired by the MuViSPIM light-sheet microscope in particular.

Astec embryon
Description

Voxelytic-Align is a commercial software provided as a service on cloud targetted to electron microscopy reconstruction (alignement, artifact correction...)

Lecture Bio-image analysis, biostatistics, programming and machine learning for computational biology at the Biotechnology Center, TU Dresden, 2021

Thie lecture is for Python beginners who want to dive into image processing with Python. It specifically aims for students and scientists working with microscopy images in the life sciences. We start with python basics, dive into descriptive statistics for working with measurements and matplotlib for plotting results.

Customizing ImageJ

These slides give an introduction to user interfacre customization in ImageJ using ImageJ Macro and to ImageJ Macro Markdown.

Big thanks to Jerome Mutterer (IBMP) and Nicolas De Francesco (IMBICE) who shared material openly I reused when making these slides.

Supplementary material is available as well under this doi: 10.5281/zenodo.4561714

Description

The tool exports rectangular regions, defined with the NDP.view 2 software (hammatsu) from the highest resolution version of the ndpi-images and saves them as tif-files.

Click the button and select the input folder. The input folder must contain pairs of ndpi and ndpa files. The regions will be exported to a subfolder of the input folder names zones.

has topic
has function
imagej toolset to export regions from ndpi and ndpa-files
Description

Phindr3D is a comprehensive shallow-learning framework for automated quantitative phenotyping of three-dimensional (3D) high content screening image data using unsupervised data-driven voxel-based feature learning, which enables computationally facile classification, clustering and data visualization.

Please see our GitHub page and the original publication for details.

Description

This Fiji plugin is a python script for CLEM registration using deep learning, but it could be applied in principle to other modalities. The pretrained model was learned on chromatin SEM images and fluorescent staining, but a script is also provided to train an new model, based on CSBDeep. The registration is then performed as a feature based registration, using register virtual stack plugin (which extract features and then perform RANSAc. Editing the script in python gives access to more option (such as the transformation model to be used, similarity by default. Images need to be prepared such that they contain only one channel, but channel of ineterst (to be transformed with the same transformation) can be given as input, and Transform Virtual Stack plugin can be used as well.

F1000R Figure 1 DeepCLEM
Description

The tool allows to measure the area of the invading spheroïd in a 3D cell invasion assay. It can also count and measure the area of the nuclei within the spheroïd.

need a thumbnail
Description

This tool allows to analyze morphological characteristics of complex roots. While for young roots the root system architecture can be analyzed automatically, this is often not possible for more developed roots. The tool is inspired by the Sholl analysis used in neuronal studies. The tool creates a binary mask and the Euclidean Distance Transform from the input image. It then allows to draw concentric circles around a base point and to extract measures on or within the circles. Instead of circles, which present the distance from the base point, horizontal lines can be used, which present the distance in the soil from the base-line. The following features are currently implemented:

  • The area of the root per distance/depth.
  • The number of border pixel per distance/depth, giving an idea of the surface in contact with the soil.
  • The maximum radius per distance/depth of a root, measured at the crossing points with the circles or lines.
  • The number of crossings of roots with the circles or lines.
  • The maximum distance to the left and the right from the vertical axis at crossing points with the circles or lines.
Concentric circles on the mask of a root, created by the Analyze Complex Roots Tool
Description

Today, 25% of figures in biomedical publications contain images of various types, e.g. photos, light or electron microscopy images, x-rays, or even sketches or drawings. Despite being widely used, published images may be ineffective or illegible since details are not visible, information is missing or they have been inappropriately processed. The vast majority of such imperfect images can be attributed to the lack of experience of the authors as undergraduate and graduate curricula lack courses on image acquisition, ethical processing, and visualization. 
Here we present a step-by-step image processing workflow for effective and ethical image presentation. The workflow is aimed to allow novice users with little or no prior experience in image processing to implement the essential steps towards publishing images. The workflow is based on the open source software Fiji, but its principles can be applied with other software packages. All image processing steps discussed here, and complementary suggestions for image presentation, are shown in an accessible “cheat sheet”-style format, enabling wide distribution, use, and adoption to more specific needs.

Description

TrackMate based tracker to be used when uploading integer labelled segmentation images, coming from a Deep Learning tool such as stardist. To use this tool efficiently we provide a python notebook to collect/localize the position of cells, this step creates a CSV file which can then be loaded into the Fiji tracker to do particle tracking with TrackMate interface.

Description

QuantiFish is a quantification program intended for measuring fluorescence in images of zebrafish, although use with images of other specimens is possible. This package is geared towards analysis of fluorescent infection models. The software is designed to automate processing of images of single fish, and outputs results as a .csv file. Alongside measures of total fluorescence above a threshold, this package also introduces several measures for dissemination and distribution of fluorescence throughout the specimen.

QuantiFish User Interface
Description

Set of KNIME workflows for the training of a deep learning model for image-classification with custom images and classes.

The workflows take ground-truth category annotations as a table generated by the qualitative annotations plugins in Fiji.

Workflows for the training of a model AND for the prediction of image-category for new images are provided.

There are different workflows if you do:

- binary image-classification (images get classified in 1 category out of 2 possible categories) 

- classification from possibly more than 2 categories (images are classified in 1 category out of N possible categories).

The training workflows take care of image pre-processing and allows the visualization of the training and validation losses in real time along the training.  

For the training, transfer learning from a pre-trained VGG16 base is performed, with freshly initialized fully connected layers.

Only the fully connected layers are trained, the VGG16 base is frozen is this workflow, but once the fully connected layers trained the base could also be finetuned. In practice, it often works well with the frozen base.

has function
Description

Analyze the clustering behavior of nuclei in 3D images. The centers of the nuclei are detected. The nuclei are filtered by the presence of a signal in a different channel. The clustering is done with the density based algorithm DBSCAN. The nearest neighbor distances between all nuclei and those outside and inside of the clusters are calculated.

has function
Description

Vaa3d BJUT Fast Marching Spanning Tree algorithm dockerised workflow for BIAFLOWS

need a thumbnail
Description

Blood vessels tracing in 3D image from 3D Gaussian blurring (user defined radius), local thresholding (user defined radius and offset) and 3D skeletonization. Dockerized version for BIAFLOWS,

need a thumbnail
Description

Blood vessels tracing in 3D image from Tubeness filtering (user defined scale), 3D opening (radius set to 2), thresholding (user defined level) and 3D skeletonization.

need a thumbnail
Description

3D Neuron Tracing with a Dockerized version of Vaa3D MOST Raytracer.

need a thumbnail
Description

3D Neuron Tracing using Dockerized version of Vaa3D Minimum Spanning Tree (MST).

need a thumbnail
Description

Rivuletpy dockerised workflow for BIAFLOWS.

has topic
need a thumbnail
Description

Vaa3d All-Path-Pruning 2.0 (APP2) dockerised workflow for BIAFLOWS.

need a thumbnail
Description

Cell tracking using MU-Lux-CZ algorithm. Dockerized Workflow for BIAFLOWS implemented by Martin Maska (Masaryk University).

has topic
has function
need a thumbnail
Description

Nuclei tracking in 2D time-lapse with Octave tracker (adapted from Matlab LOBSTER version).

has function
need a thumbnail
Description

Object tracking. For each time-frame, an image mask is obtained from median filtering (user defined radius), thresholding (user defined level) and hole filling. Convex objects are split apart by distance map watershed from regional intensity maxima (user defined noise tolerance), eroded (user defined radius) and analyzed as 3D particles (assuming some overlap between objects from a frame to the next frame). Finally, division events are analyzed and accounted for to relabel objects.

has function
need a thumbnail
Description

Track non-dividing particles in 2D time-lapse image.

has topic
has function
need a thumbnail
Description

Particle tracking in 2D time-lapse based on linking closest regional intensity minima (user defined noise tolerance) detected from Laplacian of Gaussian filtered images (user defined radius). A maximum linking distance is set (user defined).

has function
need a thumbnail
Description

Execute Nuclei Segmentation in 3D images using pixel classification with ilastik.

has topic
has function
need a thumbnail
Description

The macro will segment nuclei and separate clustered nuclei in a 3D image using a 2D Gaussian blur, followed by Thresholding, 2D hole filling and a 2D watershed. As a result an index-mask image is written for each input image.

need a thumbnail
Description

U-Net segmentation as presented in Reference Publication. The model predicts three classes: background, edge and foreground. The model was trained with Kaggle Data Science Bowl (DSB) 2018 training set.

has topic
has function
need a thumbnail
Description

Nuclei Segmentation using Deep Learning for individual cell analysis (DeepCell).

has topic
has function
need a thumbnail
Description

3D spot detection using the Determinant of Hessian (DoH) and the detection of 3D minima.

need a thumbnail
Description

Spot detection in 3D images by Wavelet Adaptive Threshold in Icy.

has function
need a thumbnail
Description

This workflow detects spots in a 2D image by filtering the image by Laplacian of Gaussian (user defined radius), thresholding (user defined threshold) and finding local intensity maxima in mask distance map (Dmap).

need a thumbnail
Description

TGMM is a cell tracking solution for large 3D volume (typically lightsheet).

It detects cell nuclei by fitting gaussians on their fluorescent intensity.

It can run on GPU using CUDA and is called via the command line.

has function
need a thumbnail
Description

Collection of add-ons (recipes, scripts, demos,…) that will help you improve your day-to-day use of Amira-Avizo and PerGeos Software and make you gain both time and efficiency.
Use the Search field to look for specific keywords related to your domain of interest. The different filters also help you target specific resources.

Amira logo
Description

OligoMacro Toolset, is an ImageJ macro-toolset aimed at isolating oligodendrocytes from wide-field images, tracking isolated cells, characterizing processes morphology along time, outputting numerical data and plotting them. It takes benefit of ImageJ built-in functions to process images and extract data, and relies on the R software in order to generate graphs.

need a thumbnail
Description

The research goal of this paper was to provide unbiased counts of labeled astrocytes and to estimate the area they cover, further to develop tools for defining the orientation of coupling within astrocyte networks under different stimuli.

In order to count the astrocytes and estimate the area they cover the following steps were used in this software.

Pre-processing: z-project (using max intensity); split channels; subtract background; remove outliers.

Segmentation: adjust threshold and convert to a binary file; Watershed.

Cell counting: Analyze particles

Measure Astrocytic network area: select a ROI using the polygon tool; set measurements (area); ROI manager -> add the traced polygon; measure.

need a thumbnail

Analysis of Microtubule Orientation: Tracking with ImageJ, Directionality Analysis with Matlab

Submitted by Perrine on Mon, 04/08/2019 - 14:02

We take an example image data of microtubule binding protein EB1, and will study how to automatically track those signals and how to analyze the tracking results. We use ImageJ for measuring the temporal changes in signal positions, and will feed the tracking results for analyzing their dynamics using Matlab in the following session.

EB1 tracking with Matlab

Submitted by Perrine on Mon, 04/08/2019 - 11:05

This module follow EB1 tracking with IJ. In this session, we will visualize the tracking results and also cover typical analysis protocols for the quantitative analysis of movement. Two dynamic numerical features could be extracted from tracking results: speed and direction. Estimation of movement speed from multiple trajectories is a popular indicator of movement, and we will quickly go over the method for estimating the average speed of EB1 movement along microtubule. Movement direction is another quantitative feature, but is rarely explored.

EB1 tracking with IJ

Submitted by Perrine on Mon, 04/08/2019 - 11:00

We take an example image data of microtubule binding protein EB1, and will study how to automatically track those signals and how to analyze the tracking results. We use ImageJ for measuring the temporal changes in signal positions, and will feed the tracking results for analyzing their dynamics using Matlab in the following session EB1 tracking with Matlab.

Description

Automated workflow for performing multiview reconstruction of large multiview, multichannel, multiillumination time-lapse SPIM data on a high performance computing (HPC) cluster or on a single workstation. 

Description

NEUBIAS-WG5 workflow for nuclei segmentation using ilastik v1.3.2 and Python post-processing.

has topic
has function
need a thumbnail
Description

NEUBIAS-WG5 workflow for nuclei segmentation using Mask-RCNN. The workflow uses Matterport Mask-RCNN. Keras implementation. The model was trained with Kaggle 2018 Data Science Bowl images.

has topic
need a thumbnail
Description

This workflow predict landmark positions on images by using DMBL landmark detection models.

has topic
has function
need a thumbnail
Description

This workflow trains DMBL landmark detection models from a dataset of annotated images.

has function
need a thumbnail
Description

This workflow predict landmark positions on images by using LC landmark detection models.

has topic
has function
need a thumbnail
Description

This workflow trains LC landmark detection models from a dataset of annotated images.

has topic
has function
need a thumbnail
Description

This workflow predict landmark positions on images by using MSET landmark detection models.

has topic
has function
need a thumbnail
Description

This workflow trains MSET landmark detection models from a dataset of annotated images.

has topic
has function
need a thumbnail
Description

This workflow segments glands from H&E stained histopathological images
from the Gland Segmentation Challenge (GlaS2015) using deep learning (UNet).
UNet implementation largely inspired from PyTorch-UNet by Milesial. 

need a thumbnail
Description

VascuSynth is an ITK-based synthetic image generator. It synthesizes volumetric images of vascular trees and generates a .gxl file of the ground-truth tree structure. VascuSynth receives a number of .txt configuration files and is capable of generating both ground truth ('ideal') images and images with added noise. The user is capable of choosing from a set simple noise additions and artefacts.

has function
Description

This workflow processes a group of images containing cells with discernible nuclei and segments the nuclei and outputs a binary mask that show where nuclei were detected. It was developed as a test workflow for Neubias BIAFLOWS Benchmarking tool.

has function
Description

This workflow processes images of cells with discernible nuclei and outputs a binary mask containing where nuclei are detected.

need a thumbnail
Description

This workflow uses ICY wavelet based spot detector to detect spots in 2D images.

has function
need a thumbnail
Description

This workflow detects spots from a 3D image by using straightforward set of ImageJ components. It receives the Laplacian Radius and the Threshold  value s input.

has function
need a thumbnail
Description

This workflow detects spots in a 2D image by filtering the image by Laplacian of Gaussian (user defined radius) and detecting regional intensity minima (user defined noise tolerance).

has function
need a thumbnail

3D object based colocalisation

Submitted by Perrine on Fri, 02/22/2019 - 09:21

A user comes to the Facility: “I’ve got a set of 2 channels 3D images where objects are overlapping. I think the overlap might not be the same from object to object. I would like to quantify the physical overlap and get a map of quantifications”. Your mission: write the appropriate macro, knowing a user might always change her/his mind, and ask for more… Ready to take on the challenge ?

Description

autoQC encapsulates a number of routines for performing microscope quality controls. From a few input images, it generates computer-friendly (i.e. CSV) data with numerical parameters for quality measures (resolution, field of view illumination, chromatic shift, stage reproducibility).

need a thumbnail
Description

The macro will segment nuclei and separate clustered nuclei in a 3D image using a distance transform watershed. As a result an index-mask image is written for each input image.

need a thumbnail
Description

The macro will segment nuclei and separate clustered nuclei using a binary watershed. As a result an index-mask image is written for each input image.

need a thumbnail
Description

Multimodal image registration based on manual selection of matching pairs of landmarks. This image registration workflow is based
on MATLAB’s image processing toolbox using the identification of sites of clathrin-mediated endocytosis by correlative light electron microscopy (CLEM) as an example.

need a thumbnail
Description

Tracking tools, such as TrackMate, produce tracks and their role stops there. However, tracks are just an intermediate data structure in the workflow. Their subsequent analysis produces the numbers upon which scientific conclusions are made. The track analysis is most often specific to the scientific question to be addressed, and therefore tracking tools remain generic and seldom include specialized analysis modules. Another toolset is required for track analysis; this workflow focuses on using MATLAB.

need a thumbnail
Description

This workflow presents single-particle tracking in Fiji using Track-Mate, and track motility analysis in MATLAB using @msdanalyzer. 

need a thumbnail
Description

This workflow describes a semi-automatic image segmentation procedure for 3D reconstructions of the coronary arterial tree, after which how different morphometric features are automatically extracted, including vessel lumen diameter of the three main coronaries.

video tutorial on 3D vessel segmentation of synchrotron phase contrast tomography

Submitted by czhang on Tue, 01/29/2019 - 20:32

In this tutorial video, a coronary arterial tree is used as the demo example to show in detail how the semi-automatic segmentation workflow, Carving from the open-source image analysis software ilastik, can be used. Tips on how and why a preprocessing is done, as well as parameter settings are provided.

Description

TEM ExosomeAnalyzer is a program for automatic and semi-automatic detection of extracellular vesicles (EVs), such as exosomes, or similar objects in 2D images from transmission electron microscopy (TEM). The program detects the EVs, finds their boundaries, and reports information about their size and shape.

The software has been developed in terms of project MUNI/M/1050/2013 and supported by Grant Agency of Masaryk University.

The EVs are detected based on the shape and edge contrast criteria. The exact shapes of the EVs are then segmented using a watershed-based approach.

With proper parameter settings, even images with EVs both lighter and darked than the background, or containing artifacts or precipitated stain can be processed. If the fully-automatic processing fails to produce the correct results, the program can be used semi-automatically, letting the user adjust the detection seeds during the intermediate steps, or even draw the whole segmentation manually.

screen capture from exosomeAnalyzer
Description

This is a classical workflow for spot detection or blob like structures (vesicules, melanosomes,...)

Step 1 Laplacian of Gaussian to enhance spots . Paraeters= radius, about the average spot radius

Step 2 Detect minima (using Find Maxima with light background option to get minima). Parameter : Tolerance to Noise: to be tested, hard to predict. About the height of the enhanced feautures peaks

has topic
has function
spot detection
Description

The best way to start writing an ImageJ2 plugin (ImageJ2 developers call it command and not plugin) is to download the example command from github and modify it. There is a video tutorial on the whole workflow on how to do this on youtube.

has function
Description

3-D density kernel estimation (DKE-3-D) method, utilises an ensemble of random decision trees for counting objects in 3D images. DKE-3-D avoids the problem of discrete object identification and segmentation, common to many existing 3-D counting techniques, and outperforms other methods when quantification of densely packed and heterogeneous objects is desired. 

Introduction to ImageJ macro language

Submitted by gaby on Wed, 10/17/2018 - 19:41

In this session, we will cover the basics of ImageJ macro programming using a simple example: how to quantify signal enrichment at the nuclear rim? Trainees will (re)discover how to record actions, plan a workflow and organise their code. This session will alternate presentation of technical points, to be directly applied during practical exercises. The macro will progressively complexify as new notions are taught.

Description

This script includes a rough feature detection and then fine 2D Gaussian algorithm to fit Gaussians within detected regions. This macro is unique because the ImageJ/Fiji curve fitting API only supports 1-D curve. I get around this by linearising the equation. This implementation is for isotropic (spherical) or anistropic (longer in x/y) diagonally covariant Gaussians but not fully covariant Gaussians (anisotropic and rotated). 

Description

ZEN and APEER – Open Ecosystem for integrated Machine-Learning Workflows

Open ecosystem for integrated machine-learning workflows to train and use machine-learning models for image processing and image analysis inside the ZEN software or on the APEER cloud-based platform

Highlights ZEN

  • Simple User Interface for Labeling and Training
  • Engineered Features Sets and Deep Feature Extraction + Random Forrest for Semantic Segmentation
  • Object Classification workflows
  • Probability Thresholds and Conditional Random Fields
  • Import your own trained models as *.czann files (see: czmodel · PyPI)
  • Import "AIModel Containes" from arivis AI for advanced Instance Segmentation
  • Integration into ZEN Measurement Framework
  • Support for Multi-dimensional Datasets and Tile Images
  • open and standardized format to store trained models
ZEN Intellesis Segmentation

ZEN Intellesis Segmentation - Training UI

ZEN Intellesis - Pretrained Networks

ZEN Intellesis Segmentation - Use Deep Neural Networks

Intellesis Object Classification

ZEN Object Classification

Highlights Aarivis AI

  • Web-based tool to label datasets to train Deep Neural Networks
  • Fully automated hyper-parameter tuning
  • Export of trained models for semantic segmentation and AIModelContainer for Instance Segmentation
Annotation Tool

APEER Annotation Tool

Description

This notebook uses the rOMERO-gateway and EBImage to process an Image associated to the paper 'Timing of gene expression in a cell-fate decision system'.

The Image "Pos22" is taken from the dataset idr0040-aymoz-singlecell/experimentA/YDA306_AGA1y_PRM1r_Mating. It is a timelapse Image with 42 timepoints separated by 5 minutes. This Image is used to fit a model for the growth of the yeast cells. The notebook does not replicate any of the analysis of the above mentioned paper.

Its purpose is mainly to demonstrate the use of Jupyter, rOMERO-gateway and EBimage.


What it does:

  • For each time point of one movie:
    • Read the image for this time point  from the IDR
    • Threshold the images and count the cells using EBimage functions
  • Fit an exponential model to the count of cells against time to get a coefficient of grow (exponential factor)


has function
Description

This one example workflow from the Cell Profiler(CP)  Examples . CP is commonly used to count cells or other objects as well as percent-positives, by measuring the per-cell staining intensity. This pipeline shows how to do both of these tasks, and demonstrates how various modules may be used to accomplish the same result. 

In a few words, it used the IdentifyPrimaryObject module of CellProfiler to detect nuclei from a channel (e.g DAPI), then again the same module on another channel to detect another probe (e.g some particular histone)  .

Then objects (nuclei) are related to the second object (Histone), to create a parent child-relation ship: where nuclei can have histone has child. Nuclei are then filtered according to the property of having histone (positive) or not having histone (negtiveobject) related to them.  If needed, nuclei can be expanded in order to include touching object rather than object inside only.

The percentage of positive nuclei vs total number of nuclei can then be computed using the CalculateMath Module.

Positivepercentcell
Description

This is a Jupyter notebook demonstrating the run of a code from IDR data sets by loading a CellProfiler Pipeline 

The example here is applied on real data set, but does not correspond to a biological question. It aims to demonstrate how to create a jupyter notebook to process online plates hosted in the IDR.

It reads the plate images from the IDR.

It loads the CellProfiler Pipeline and replace the reading modules used to read local files from this defaults pipeline by module allowing to read data remotely accessible.

It creates a CSV file and displays it in the notebook.

It makes some plot with Matplotlib.


jupyter
Description

This workflow can be ran with data from 3D-SIM showing the centrosomes in order to compare the distribution of diameters of rings (or toroids) of different proteins from the centrioles or the peri centriolar material. It aims to reproduce the results of the Nature Cell Biology Paper Subdiffraction imaging of centrosomes reveals higher-order organizational features of pericentriolar material  from the same data set but with a different analysis method.

It is slightly different from the methods described in the paper itself, where the method was to work on a maximum intensity projection of a 3D-SIM stack, and then to fit circle to the centrioles to estimate the diameters of the toroids.

In this workflow, the images are read from the IDR , then process by thresholding (Maximum entropy auto thresholding with Image J), and processed by Analyze Particles  with different measurement sets, including the bouding box. Then the analysis of diameters and the statistical test are performed using R. All the code and data sets are available, and in the case of this paper have shown a layered organisation of the proteins.

Combined view from Figure 1 Lawo et al.
Description
HyphaTrackerWorkflow
HyphaTracker Workflow

HyphaTracker propose a workflow for time-resolved analysis of conidia germination. Each part of this workflow can also be used independnatly , as a toolbox. It has been tested on bright-field microscopic images of conidial germination. Its purpose is mainly to identify the germlings and to remove crossing hyphae, and measure the dynamics of their growth.

hyphatracker
Description

automated open-source image acquisition and on-the-fly analysis pipeline (initially developped for analysis of mitotic defects in fission yeast)

maars workflow from publication


maars
Description

The purpose of the workflow is ....

First you need

need a thumbnail
Description

  FlyLimbTracker is  a method that uses active contours to semi-automatically track body and leg segments from video image sequences of unmarked, freely behaving Drosophila flies. This approach can be used to measure leg segment motions during a variety of locomotor and grooming behaviors.

For now the plugin have to be downlaoded directly from the EPFL website (see link), not from the search bar as usual in ICY.


Drosophila track legs
Description

NeuroGPS-Tree is a workflow developed to reconstruct a neuronal population from a dense, large-scale data set. NeuroGPS-Tree is suitable for processing image stacks acquired by different image modalities.

need a thumbnail
Description

SliceMap

Whole brain tissue slices are commonly used in neurobiological research for analyzing pathological features in an anatomically defined manner. However, since many pathologies are expressed in specific regions of the brain, it is necessary to have an annotation of the regions in the brain slices. Such an annotation can be done by manual delineation, as done most often, or by an automated region annotation tool.

SliceMap is a FIJI/ImageJ plugin for automated brain region annotation of fluorescent brain slices. The plugin uses a reference library of pre-annotated brain slices (the brain region templates) to annotate brain regions of unknown samples. To perform the region annotation, SliceMap registers the reference slices to the sample slice (using elastic registration plugin BUnwarpJ) and uses the resulting image transformations to morph the template regions towards the anatomical brain regions of the sample. The resulting brain regions are saved as FIJI/ImageJ ROI’s (Regions Of Interest) as a single zip-file for each sample slice.

More information can also be found in "SliceMap: an algorithm for automated brain region annotation", Michaël Barbier, Astrid Bottelbergs, Rony Nuydens, Andreas Ebneth, Winnok H De Vos, Bioinformatics, btx658, https://doi.org/10.1093/bioinformatics/btx658

Example: SliceMaps brain region segmentation
Description

"The plugin analyzes fluorescence microscopy images of neurites and nuclei of dissociated cultured neurons. Given user-defined thresholds, the plugin counts neuronal nuclei, and traces and measures neurite length."[...]" NeuriteTracer is a fast simple-to-use ImageJ plugin for the analysis of outgrowth in two-dimensional fluorescence microscopy images of neuronal cultures. The plugin performed well on images from three different types of neurons with distinct morphologies."

This plugin requires parameter setting: Threshold levels and scale (see more details on the related publication)

Description

Integrates hardware control of Leica microscopes (via CAM), image analysis (e.g. via ImageJ, Matlab), and adaptive automatic screening of identified regions of interest.

Description

The wound healing tool measures the area of a wound in a time series of images of cellular tissue. The tool will measure the area of the wound, i.e. the area that does not contain tissue, in each image. The segmentation is based on the fact that the image is more homogeneous in the region of the wound as in the region of the tissue. Via the options, one of two methods to detect the empty area, can be selected. The first uses edge detection, the second a variance filter. Holes in the detected tissue are filled using morphological operations.

Measure area of the wound
Description

The skin tools measure the thickness of the epidermis and the interdigitation index.

The input images are masks that represent the epidermis and that have been created from images of stained histological sections. The mask must touch the left and right border of the image. The dermal-epidermal border must be on the lower site of the image. The interdigitation index can be measured for one or more segments per image. As a measure of the thickness of the epidermis the lengths of a number of random line segments are measured. The line segments start at the lower border, are perpendicular to the lower border and end at the opposite border of the mask.

See installation Instructions on the website.

has topic
Measure thickness from a mask
Description

The Adipocytes Tools help to analyze fat cells in images from histological section. This is a rather general cell segmentation approach. It can be adapted to different situations via the parameters. This means that you have to find the right parameters for your application.

Sample Image: [0178_x5_3.tif](http://dev.mri.cnrs.fr/attachments/190/0178_x5_3.tif)

has topic
has function
Description

Analysis of adipocyte number and size. The original code and example images supposed to be discovered at http://webspace.buckingham.ac.uk/klanglands/ but currently the webpage is missing the code and sample images.

has topic
has function
Description

This is an example workflow of how to perform automatic registration by

- first detecting spots in both images using wavelet segmentation (with different scale according to the image scale)

- second using Ec-Clem autofinder to register both images

Click on a block to know more about a tool. Non referenced tools are non clickable.

testWorkflowtestWorkflowtestWorkflowimage map example
Workflow results
Description

ImageJ macro for the morphometry of neurites. > NeurphologyJ; it is capable of automatically quantifying neuronal morphology such as soma number and size, neurite length, neurite ending points and attachment points. NeurphologyJ is implemented as a plugin to ImageJ, an open-source Java-based image-processing and analysis platform.


Description

Estimate the frequency of hepatitis C virus infected cells based on the intensity of viral antigen associated immunofluorescence. 

The core is an ImageJ Macro, so it's easy to modify for one's own needs (Link to the code). 

has topic
has function
Description

Free-D (http://free-d.versailles.inra.fr/) is a 3D reconstruction and modeling software. It is multiplatform, free (but not open source) tool for academic research and teaching.

Here is how to proceed, using Free-D:

1. Segmentation:

* load (a collection of) individual 3d stacks

* (optional for serial sections) perform a 2D registration to align image slices

* segment/reconstruct 3D contours using snakes

* segment 3D spots

2. Construct average cell:

* normalize the contours to compute a average cell, by registering/warping 3D contours/surfaces

3. Quantification:

* project each individual cell to the average one

* build density maps to analyze (cartography)

A few notes for current software version (till 10/2016):

* input file format: tiff (not able to import bioformats)

* currently results are saved in customized format, but there is an exportor to convert this format into fiji readable one

* import already generated contours is on the software's TODO list

need a thumbnail
Description


In this workflow, you can use MorphoLibJ to generate accurate morphometric measurements

  • First the fibers are segmented by mathematical morphology:
    • for example by using MorphoLibJ:
      • Create a marker image by creating a rough mask with extended regional maxima (similar to Find Max), such that you have one max per fiber
      • Use the marker controlled watershed (in MorpholLibJ/ Segmentation/ marker controlled watershed) : indicate the original grayscale image as the input, Marker will be your maxima image, select None for mask
      • it will create a label mask of your fibers
  •  In MorphoLibJ /analyze/ select Region Morphometry: this will compute different shape factors which are more robust than the ones implemented by default in ImageJ
  • Export the result table created to a csv file
  • Then for example in Matlab or R, you can apply a PCA analysis (Principal component analysis) followed by a k-means with the number of class (clusters) (different fibers type) you want to separate.
  • You can then add this class as a new feature to your csv file.
  • From this you can sort your labelled fibers into these clusters for a visual feedback or further spatial analysis
has topic
hemp analysis
Description

When trying to isolate objects, one strategy might be to use regular morphological operations (opening/closing) to remove small objects that are not of interest. In case small objects are made of a large number of pixels, this operation might impair the remaining objects' contours. An alternative strategy might be to use morphological reconstruction. In short, seed is placed on the image, on objects, then conditional dilation is performed from those seeds.

Here is how to proceed, using MorphoLibJ:

  1. Open an image
  2. Use the multi-point selection tool and place seeds on objects of interest
  3. Create a new image of same size, black background
  4. Transfer the selection to the new image (Edit/Selection/Restore selection)
  5. Draw (make sure you're using white foreground) the multiple point selection
  6. Launch the Morphological reconstruction plugin: Plugins > MorphoLibJ > Morphological reconstruction
need a thumbnail
Description

Quote:

The "Angiogenesis Analyzer" allows analysis of cellular networks. Typically, it can detect and analyze the pseudo vascular organization of endothelial cells cultured in gel medium

...a simple tool to quantify the ETFA (Endothelial Tube Formation Assay) experiment images by extracting characteristic information of the network.

The outputs are network feature parameters.

Sample images

http://image.bio.methods.free.fr/ij/ijmacro/Angiogenesis/HUVEC-Pseudo-Phase-Contrast.tif.zip

http://image.bio.methods.free.fr/ij/ijmacro/Angiogenesis/HUVEC-Fluo.tif.zip

Source code

https://imagej.nih.gov/ij/macros/toolsets/Angiogenesis%20Analyzer.txt

has topic
has function
Description

This workflow will batch process a directory of images: - comets should be horizontally oriented, tails to the right. Additional preprocessing is required if the gel does not match with this orientation (Rotate images, Using ImageJ/Transform Image or TransformJ plugin for example). Then using the plugin:

  1. Uneven background correction
  2. Automatic detection of comet shapes with outliers detection
  3. Automatic detection of the heads of comets (brightest region or profile analysis)
  4. Statistical values of tails, heads and Olive moments.
  • Manual correction is available.
  • Does live analysis with Micro-Manager
Description

Adiposoft is an automated Open Source software for the analysis of adipose tissue cellularity in histological sections.

Example data can be found on the plugin description page in ImageJ wiki (download link). There is also a link to a MATLAB version of the workflow.

has topic
Description

The workflow consists of firstly identifying spot (which can be also gravity center of cells identified by another method), and then secondly compute trajectories by linking these spots by global optimisation with a cost function. This method is part of the methods evaluated in Chanouard et al (2014) as "method 9" and is described in detail in its supplementary PDF (page 65).

Dependencies

Following plugins are required.

  1. JAR to be placed under IJ plugin directory
  2. A pdf file with instructions and output description is also available in the zip .
  3. MTrackJ : Used for visualization of tracks. Preinstalled in Fiji.
  4. Imagescience.jar: This library is used by MTrackJ. Use update site to install this plugin.
  5. jama.jar. Preinstalled in Fiji.

##Advantages:

  • support blinking (with a parameters allowing it or not)
  • fast,
  • can be used in batch, some analysis results provided.
  • No dynamic model.
  • The tracking part is not dependent of ImageJ.

Pitfalls:

  • does not support division
  • the optimization algorithm used is a simulated annealing, so results can be slightly different between two runs.
  • No Dynamic model (so less good results but can be used for a first study of the kind of movements)

##The sample data

The parameters used for this example data Beads, were

  1. detection: 150
  2. the max distance in pixels: 20
  3. max allowed disappearance in frame: 1
Description

The root tools help to efficiently measure the following characteristics of plant roots: the angle of the opening of the whole root the depth to which it goes down the number of roots at multiple depths (for example 30cm, 35cm, ...) the diameters of the roots at multiple depths (for example 30cm, 35cm, ...)

Root tools
Description

Count bacterial colonies on agar plates and measure the occupied surfaces. The user has to provide a selection (roi) of the area that will be analyzed. He can than run the segmentation and if necessary correct the results. In a third step he can run the counting and measurement.

has function
Description

In this case study, MATLAB, the Image Processing and Signal Processing toolboxes were used to determine the green intensities from a small portion of a microarray image containing 4,800 spots. A 10x10 pattern of spots was detected by averaging rows and columns to produce horizontal and vertical profiles. Periodicity was determined automatically by autocorrelation and used to form an optimal length filter for morphological background removal. A rectangular grid of bounding boxes was defined. Each spot was individually addressed and segmented by thresholding to form a mask. The mask was used to isolate each spot from surrounding background. Individual spot intensity was determined by integrating pixel intensities. Finally, integrated intensities were tabulated and saved to a data file for subsequent statistical analysis to determine which genes matter most.

Description

Normalize the orientation of the images of the Zebrafish embryos.

In the documentation webpage, the aim of the workflow is to normalize the orientation of the images of the Zebrafish embryos, find the point of injection of tumor cells and measure the distribution of Cy3 stained tumor foci.

ImageJ macro implementation of the Workflow described in Ghotra et al (2012). Note that currently only the angle and orientation normalization is implemented in this version.

Sample images are linked in the documentation webpage. 

has function
Description

ImageJ plugin to analyze changes in vessel diameters, described in Fernández er al (2014). More specifically the paper describes the measurement of isolated retinal arterioles (ca 50 micrometer diameter) but can be used for diameter measurements of similar vessel structures.

Description

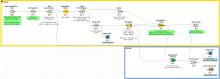
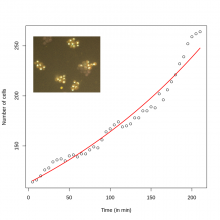
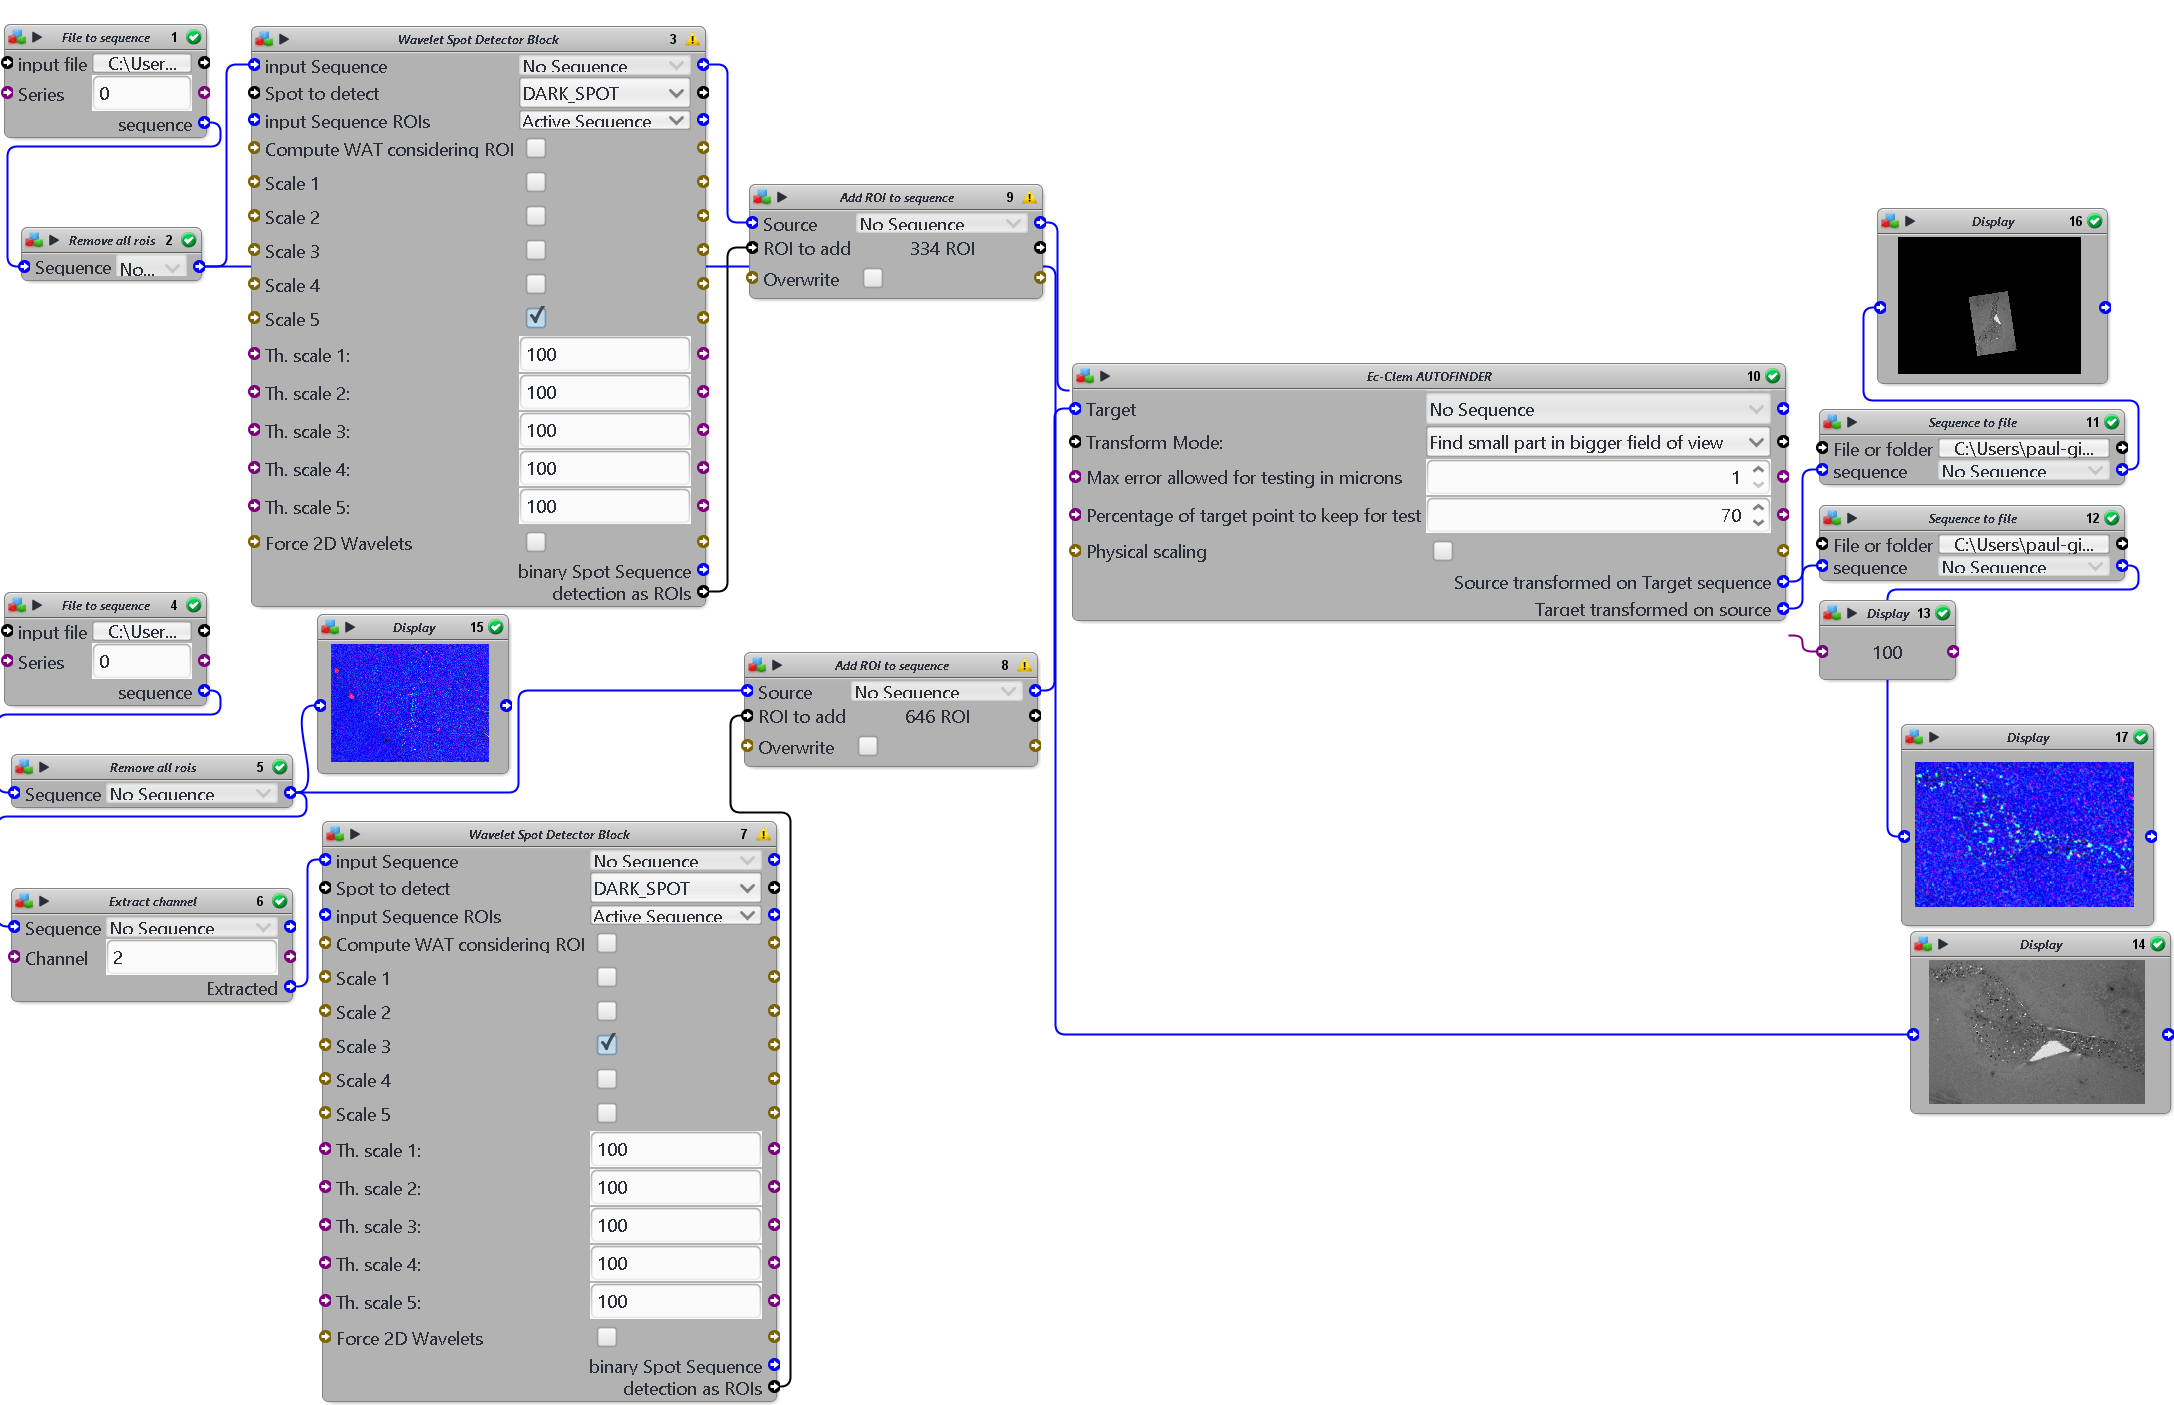
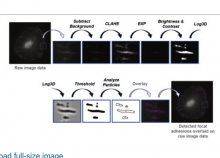
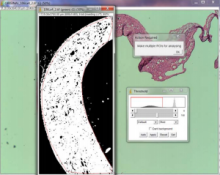
The workflow measures the growth of cells in 3D, combining an ImageJ macro for preprocessing and successive tracking using Imaris.  

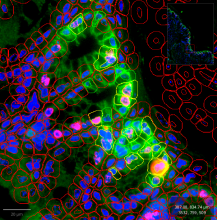
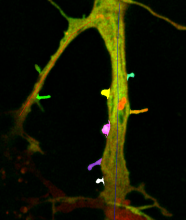
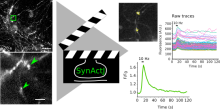
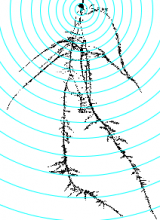
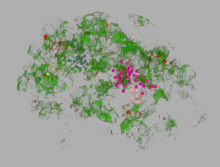
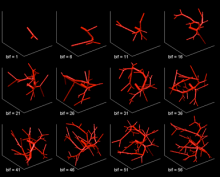
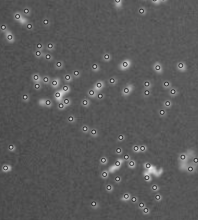
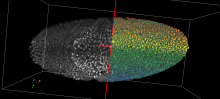
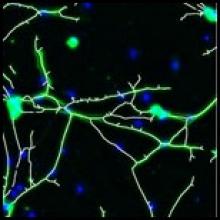
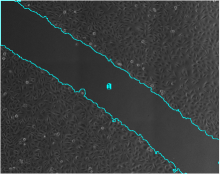
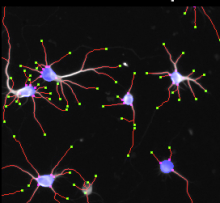
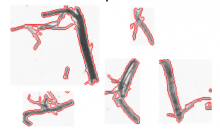
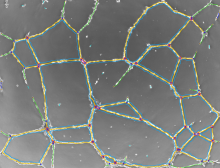
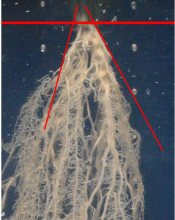
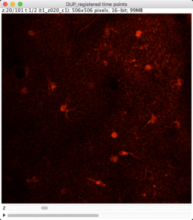
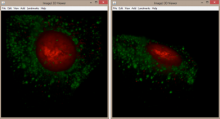
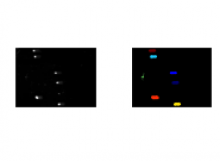
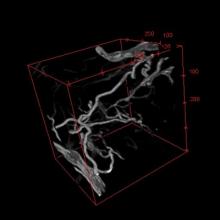
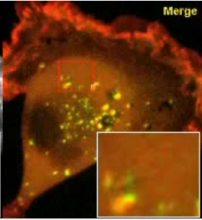
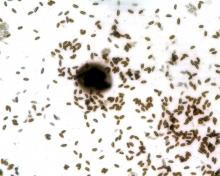
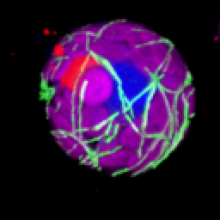
The sample dataset (available in the github repository) contains 2-Photon images of neurons. The neurons were imaged in 3D at two time frames.To allow measuring significant differences in cell volume, the time gap between the frames is large (ca. 30 min) and the animal was removed in the waiting phase. For this reason, there is a considerable shift in sample position between the frames that has to be corrected before cell detection and tracking.

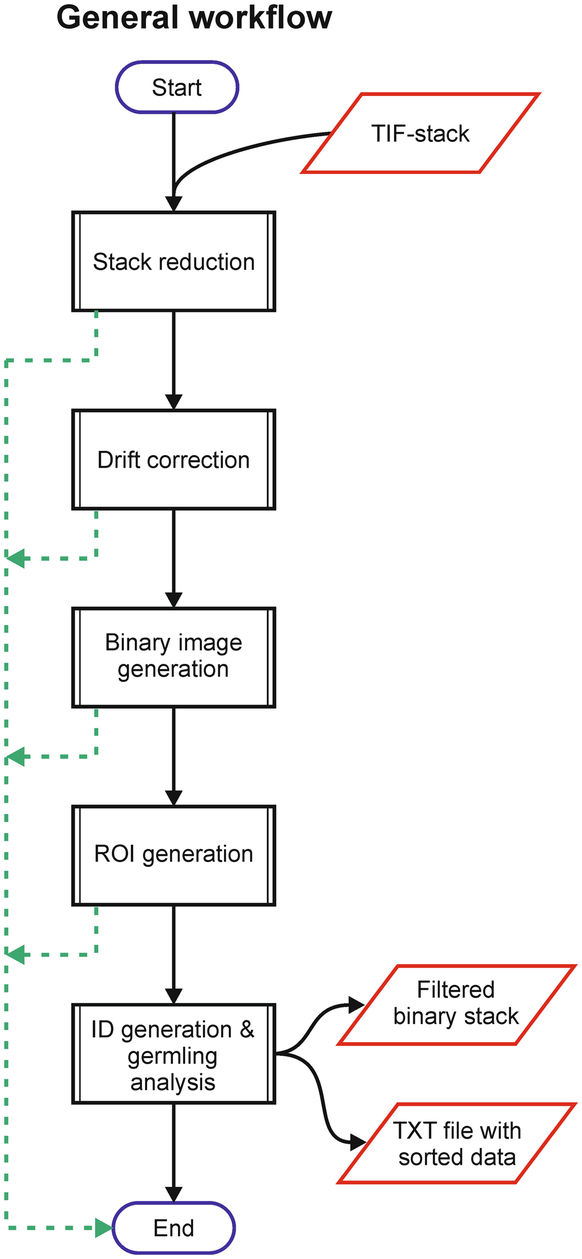
The workflow consists of following steps:

1. Import of single tiff slices [imageJ macro]

2. Organizing the data in a 4D time series with 2 time frames [imageJ macro]

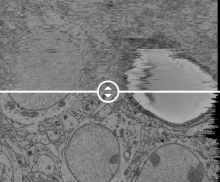
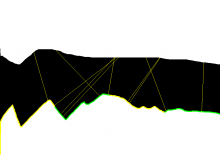
3. Correction of shift between the time frames by rigid registration [imagJ macro]

4. Bleaching correction [imageJ macro]

5. Export of preprocessed image data in ics/ids format [imageJ macro]

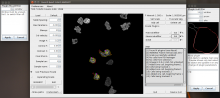
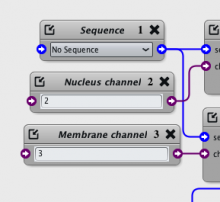
6. Import of ics/ids data to Imaris [Imaris]

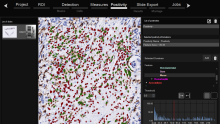
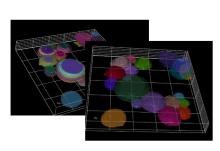
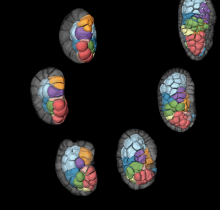
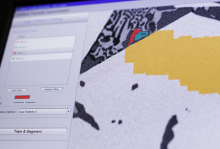
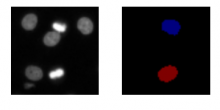
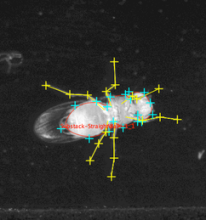
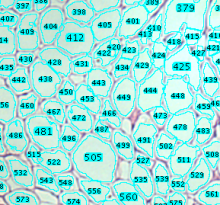
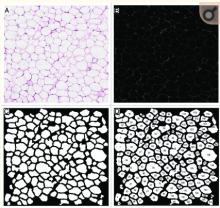
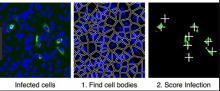
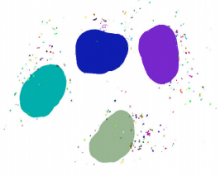
7. Cell object detection as "Imaris Surface Object" [Imaris]

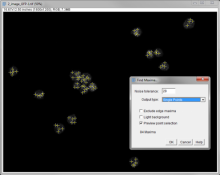
8. Tracking cell objects over time [Imaris]

9. Split Tracks (use Imaris XT extension "Split Tracks") to generate single cell objects [Imaris]

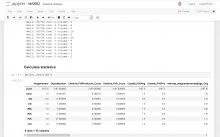
10. Export the statistics: Select the complete folder, go to the statistics tab and use ‚Full Export’ [Imaris]

The preprocessing macro can be referenced here.

The sample images were acquired by Cordula Ulbrich (Petzold Group at German Center of Neurodegenerative Disesases (DZNE), Bonn, Germany).

Input data type: tiff

Output data type: data table

has function
Description
Tracer allows the user to create a trace along a structure in an image. It uses the underlying molecule positions, not the rendered image.
need a thumbnail
Description
Imaris is a commercial 3D image visualisation and analysis tool. It can be used to produce complex 3D animations that include multiple volume and surface elements in several channels, as well as clipping planes and annotations such as text and arrows. Movies interpolate seamlessly between user-defined key frames, and properties such as viewing angle, zoom and visibility of each element can be changed during the animation. These features allow effective communication of results based on image data.
need a thumbnail
Description

DBSCAN (Density-based spatial clustering of applications with noise) performs multi-dimensional clustering based on the local density of points. This plugin is implemented for 2-3 dimensions.

has function
need a thumbnail
Description

Two workflows are proposed here:

one based on fiducials, the other one on cross-correlation.

has function
need a thumbnail
Description
Sieving (or filtering) is choosing the good localizations and discarding the false ones. This operation is performed by inspecting the distribution of the localizations' fitted parameters and changing the min and max accordingly.
need a thumbnail
Description

A workflow template to analyze subcellular structures in fluorescence 2D/3D microscopy images based on a Fiji plugin **Squassh** is described in Rizek et al (2014).

The workflow employs detecting, segmenting, and quantifying subcellular structures. For segmentation, it accounts for the microscope optics and for uneven image background. Further analyses include both colocalization and shape analyses. However, it does not work directly for time-lapse data. A brief summary note can be found here.

Description

This macro is a plugin macro to the "Intelligent Imaging" workflow. It detects the Cytoo patterns (specific fluorsecence channel) and computes the occupancy (number of cells) of each pattern by analyzing the images of the DAPI channel. The analysis function can be easily extended to, for instance, only select the cells that are well spread on the patterns (by analyzing a third channel with a properly chosen marker of the cytoplasm).

need a thumbnail
Description

The Measure Rosette Area Tool allows to measure the area of the rosettes of arabidopsis plants.

See: http://dev.mri.cnrs.fr/projects/imagej-macros/wiki/Measure_Rosette_Area…

Example data: http://biii.eu/node/1146http://biii.eu/node/1145

has function
Description

[as of 20180524, the website is temporary not functioning do to web defacement - please check again later] This tutorial will exemplify basic rapidSTORM usage by showing how to convert an Andor SIF acquisition to a super-resoluted image with rapidSTORM.

Description

The website implements a set of computer vision algorithms designed to automatically process time-lapse images of fluorescently labeled focal adhesion proteins in motile cells.

The methods associated with the processing have been published in PLOS One and Cell. The publication describes a quantitative analysis of focal adhesion dynamics that have been imaged using TIRF. All image processing steps are well explained or referenced.

To better understand the dynamic regulation of focal adhesions, we have developed an analysis system for the automated detection, tracking, and data extraction of these structures in living cells. This analysis system was used to quantify the dynamics of fluorescently tagged Paxillin and FAK in NIH 3T3 fibroblasts followed via Total Internal Reflection Fluorescence Microscopy (TIRF). High content time series included the size, shape, intensity, and position of every adhesion present in a living cell. These properties were followed over time, revealing adhesion lifetime and turnover rates, and segregation of properties into distinct zones.


has function
Description

The workflow computes cell-based colocalisation of two stainings in 2-D images. Both pixel- and object-based readouts are provided and some pros and cons are discussed. Please read here for more information:

https://github.com/tischi/ImageAnalysisWorkflows/blob/master/CellProfil…


Input data type: 

images

Output data type: 

processed images, numbers, text file, csv files

Description

This article Baslat et al. presents a method to compute Lymphatic Vessel Density on an image of the whole slide (a workflow documented as text).

Vessels are obtained with a Maximum Entropy Thresholding applied on the excess Red channel (2 times the red values minus blue+green value). Stroma tissue is obtained with a Moment Preserving Thresholding on the blue channel.

has topic
has function
Description

These two similar KNIME workflow solutions take 3D data stacks to segment the spots first, using local thresholding with subsequent morphological operations in order to remove noise. Colocalization is then defined by overlapping or center point distance between segmented objects. Further filtering such as overlapping ratio or distance range is done through KNIME table processing.

Two different types are available. 

  1. colocalization based on overlapping
  2. colocalization based on distance between object centers

Sample images: Smapp_Ori files

Chapter 4 in the documentation. 

Description

This simple KNIME workflow solution tracks 2D objects/cells in time series. After a few intensity based preprocessing steps, objects/cells are segmented first, then it uses Fiji TrackMate LAP method for the tracking task.

Documentation starts from p23 of the linked PDF. 

Example Image: mitocheck_small.tif (2.9M)

has function
Description

These two KNIME workflow solutions are similar: first one detects nuclei and spots inside the nuclei without taking care of surrounding regions, i.e. mitochondria. The second one provides the full solution including spots in mitochondria.

see section 2.4 for KNIME workflow. Section 2.3 is also available, using Fiji. 

Sample image: hela-cells.tif (674k x 3)

has function
Description

The article describes how a FRAP experiment can be conducted and subsequently analyzed. This includes steps in ImageJ and subsequent normalization of the intensity data.

This is a qualitative analysis, and curve fitting is done using Excel. 

Requires "Template matching and Slice alignment plugin"

Description

OMERO is an image database application consisting of a server and several clients, the most important of which are the web client and _Insight_ java application. Metadata are extracted from images that have been imported (either using the Insight client, or directly from the filesystem), and this is accessible for search. A standardised hierarchy of _Project > Dataset > Image_ in which image thumbnails can be viewed, combined with group membership, tagging, and attachment of results and other files gives a powerful framework for organising scientific image data. Images can also be analysed server-side or client-side within the base OMERO application or one of its many extensions. OMERO has APIs for extension in multiple languages: java, python, C++ and MATLAB; and such extensions have easy access to the image data and metadata in the database.

need a thumbnail
Description

CellX is an open-source software package of workflow template for cell segmentation, intensity quantification, and cell tracking on a variety of microscopy images with distinguishable cell boundary.

Installation and step-by-step usage details are described in Mayer et al (2013). 

After users provide a few annotations of cell sizes and cell boundary profiles, it tries to match boundary profile pattern on cells thus provide segmentation and further tracking. It works the best on cells without extreme shapes and with a rather homogeneous boundary pattern. It may not work well on images with cells of sizes only a few pixels. Its output comprises control images for visual validation, text files for post-processing statistics, and MATLAB objects for advanced subsequent analysis.

Description

The Fiji distribution of ImageJ comes with several manual tracking tools, two of which are particularly useful:

* _Plugins->Tracking->Manual Tracking_

* _Plugins->Tracking->Manual tracking with TrackMate_ (TrackMate is an advanced automatic tracking tool, with the option for manual editing of tracks)

The _Manual Tracking_ plugin is quick to use, intuitive and produces easy-to-understand output. TrackMate has the advantage that automatic detection and linkage can be combined with manual input.

Update sites

MtrackJ (see the component page here) can be installed via Fiji update sites. It has many shortcut keys enabled so for manually tracking many data, it will become quite efficient as you get used to the short-cut key operation.

Pre-processing

Pre-processing steps before manual tracking might include:

* denoising and/or deconvolution

* flicker and photobleaching correction, e.g. using Fiji's _Image->Adjust->Bleach Correction_

* flat-field correction, and/or bandpass (ImageJ's _Process->FFT->Bandpass filter_) according to the size of the features of interest

has function
Description
QuickPALM is a set of programs to aid in the acquisition and image analysis of data in “photoactivated localization microscopy” (PALM) and “stochastic optical reconstruction microscopy” (STORM). QuickPALM features the associated QuickPALM ImageJ plugin, which enables PALM/STORM 2D/3D/4D particle detection and image reconstruction in ImageJ.
need a thumbnail
Description

The QuimP software from Bretschneider group is deployed as ImageJ plugin and includes model-based cell segmentation, cell outline tracking and quantification of the spatially resolved speed of protrusions and retractions. The algorithm to calculate morphological dynamics is faster compared to other approaches (e.g. Machacek and Danuser, 2006). The reference paper describes the workflow for these analyses.

Description
This macro copies all images from one folder to another, randomizing names but keeping channels from the same image grouped. This is useful for blind quantification of images.
need a thumbnail
Description

Tracks a cell in a 2D video using active contours, and produces a list of ROI where intensity is measured and reported into a workbook. The cell must be first delineated with a ROI in the first image of the video.

need a thumbnail
Description

Download the protocol,use and modify in Icy. It permits to detect spot with wavelet spot detector block. Input : loop on a folder Outputs: excel, binary, and detection screenshot

has function
need a thumbnail
Description

Various ways are proposed in different websites for example:

Here, a workflow template using ImageJ's build-in Find Maxima ( Process -> Find Maxima) is explained. It can be used for many 2D counting-related tasks.

For counting small, bright foci (dots), set Output type to be Point Selection. If too many points are detected, the number may be reduced using one or more of the following methods:

Apply a filter to reduce noise, e.g. Process -> Filters -> Gaussian Blur... prior to running Find Maxima Set a minimum threshold with Image -> Adjust -> Threshold... prior to running Find Maxima, then use the Above lower threshold option within the dialog box Increase the Noise tolerance value (which effectively acts as a local threshold)

The resulting point selection can be modified (points added/removed) by the Multi-Point tool.

After the points are available, final measurements can be made using Analyze -> Measure.

Description
An estimate of the shortest distance of vesicles to synaptic cleft is computed in 3D for serial section TEM. Unfortunately the the authors do not provide an implementation. Method: 1. Bias correction for inhomogene lighting 2. Image registration of TEM sections / stacks 3. Detection of vesicles & synaptic cleft (semi-automatic) 4. Compute distances in 3D
need a thumbnail
Description

Requires Matlab Runtime Environment or Matlab. Source code (m-files) are downloaded. Software availability: AVeMap was developed under MATLAB (MathWorks). It is available as an executable, multiplatform program, together with source codes and documentation here, and the source code is also available as Supplementary Software. For practical reasons, this executable version, which does not require MATLAB, runs on a single processor. For users who want to customize the software and/or need the power of parallel computing, an installation of MATLAB with its 'parallel' and 'image processing' toolboxes is needed. Note that, even with the executable version, the velocity fields are stored for further analysis. The add-on AVeMap+ uses these AVeMap-computed velocity fields to generate heat map tables. It is available with the same link.

need a thumbnail
Description

Illumination correction is often important for both accurate segmentation and for intensity measurements. This example shows how the CorrectIlluminationCalculate and CorrectIlluminationApply modules are used to compensate for the non-uniformities in illumination often present in microscopy images.

need a thumbnail
Description

In this example, cells are grown as a tissue monolayer. Rather than identifying individual cells, this pipeline quantifies the area occupied by the tissue sample.


Download package also contains example images. 

Description

quote

This is a simple example of a DNA damage assay using single cell gel electrophoresis. Here, the measurement of interest is the length and intensity of the comet tail. Also, illumination correction is used to reduce background fluorescence prior to measurement. Also shown is a silver-stained comet example in which the percentage of DNA contained in the tail is calculated.

Example Images: Packaged together with the cellprofiler pipeline file. 

Description

Analyzing Ca2+ sparks

ImageJ plugin to detect and measure Ca2+ sparks in linescan images, described in Picht et. al. (2007). The algorithm is based on that described by Cheng et al. (1999). Care should be taken to ensure that detections belong to 'true' events, as without any additional background subtraction steps the algorithm is not appropriate for images in which the baseline fluorescence varies substantially.

Description

This workflow is used to track multiple (appear/disappear, dividing and merging) objects in presumably big 2D+t or 3D+t datasets. It is best suitable for roundish objects or spots. Tracking is done through segmentation, which can be obtained from ilastik pixel classification, or imported from other tools. Users should provide a few object level labels, and the software predicts results on the rest of the image or new images with similar image characteristics. As a result, all objects get assigned random IDs at the first frame of the image sequence and all descendants in the same track (also children objects such as daughter cells) inherit this ID.

need a thumbnail
Description
This publication describes a very simple protocol to acquire images of adherent cell cultures over time and how to process these images in ImageJ to measure the area fraction (confluence).
need a thumbnail
Description
This workflow estimates (densely distributed) object counts by the density of objects in the image without performing segmentation or object detection. Current version only works for 2D images of roundish objects with similar sizes on relatively homogeneous background. Users should provide a few labels of background and objects (especially on clustered objects), and the tool predicts the density of objects on the entire image. Counting is then estimated by integrating the density values on the whole image or specified rectangular regions of interests.
need a thumbnail
Description

The Artemia Tools help to calculate the normalized redness of Artemia in color images.

See: http://dev.mri.cnrs.fr/projects/imagej-macros/wiki/Artemia_Tools

Test images: http://biii.eu/node/1139

Artemia color analysis toolset
Description

In this human cytoplasm-nucleus translocation assay, learn how to load a previously calculated illumination correction function for two separate channels, measure protein content in the nucleus and cytoplasm, and calculate the ratio as a measure of translocation. This is a clumpy cell type, so studying the settings in primary object identification may be helpful for users interested in the more advanced options that module offers. More about these images can be found at the BBBC.

need a thumbnail
Description
ImarisTrack allows 3D tracking of spots and objects, with straightforward manual adjustment of automatic tracking results.
need a thumbnail
Description

A simple workflow is described in the following for measuring subcellular localizations of organelle by the distance from the nucleus. For example, you can quantify how far some type of vesicles or protein aggregates are apart from the nucleus border. This workflow is for analyzing 3D data.

Data requirements:

  • 3D data, 2 channels
  • Channel 1: nucleus stain = Channel 2: stain for marker you want to quantify the distance to nucleus for

Workflow:

  1. Nucleus detection: Imaris
  • Add a new SURFACE object, name it "nuclei"
  • Follow the object detection wizard to segment nucleus objects
  1. Marker object detection: Imaris
  • Add a new SURFACE object
  • Follow the object detection wizard to segment nucleus objects
  1. Creating of distance map channel: Imaris
  • In the image processing menu, go to SurfacesFunctions>>Distance Transformation
  1. MATLAB:
  • select nucleus objects and "distance outside objects"
  • A new image channel should be created now by the Matlab script
  1. Distance measurement
  • The generated distance map channel represents the distance from the nucleus border in pixel values. Thus, the distance of an organelle from the nucleus is equivalent to its mean gray value of the distance map channel.
    For distance measurement, just export the mean gray value of the distance channel for each object.

** Please note:**
In the described workflow, the distance is always calculated to the closest nucleus border. This could be also the nucleus of a neighboring cell, which generates some error. A more complex approach to avoid this error would incorporate a cell segmentation step to assign certain organelle objects to certain cells. Therefore, a cell region marker is needed.

has function
need a thumbnail
Description

This protocol first extracts the cell nuclei from a given fluorescence channel (full labeling), and grows a contour from each nucleus to extract the cell edge in another fluorescence channel (membrane-labeling).

Description
Plot the centroid tracks and area evolution of the cells of a tissue with membrane labelling.
need a thumbnail
Description

The original paper describes a method to analyze mitochondrial morphology in 2D and 3D.

Description

The goal of this workflow is to track cells captured in a time-lapse movie of a syncytial blastoderm stage Drosophila embryo and quantify their movement.

This example shows an example of object tracking. This pipeline analyzes a time-lapse experiment to identify the cells and track them from frame to frame, which is challenging since the cells are also moving. In addition, this pipeline also extracts metadata from the filename and uses groups the images by metadata in order to independently process several sequences of images and output the measurements of each.

Sample images

A portion of a time lapse movie of a syncytial blastoderm stage Drosophila embryo with a GFP-histone gene which renders chromatin fluorescent in live embryos. The movie shows nuclear divisions 10 through 13.

Victoria Foe made this movie on a Bio-Rad Radiance 2000 laser scanning confocal microscope using a 40X 1.3NA oil objective. The frames are 7 seconds apart and plays at 30 frames per second

GFP-histone transformed files provided by Rob Saint

V.Foe and G.Odell, . 26 July 2001

has function
Description

Task

Quantify the length of microtubules (MT) and the MT average density per cell.

Workflow descriptions

Simple two step workflow, allowing visual & manual correction of microtubule between the 2 steps. Batch measurement of microtubule lengths for multiple images is achieved by segmenting the MTs and then their skeletonizations. The number of pixels in the microtubule is proportional to their length, so the length can be estimated.

Script

Workflow is written as an ImageJ macro (Fiji) with following steps:

1. The enhancement of tubular structure by computing eigenvalues of the hessian matrix on a Gaussian filtered version of the image ( sigma 1 pixel), as implemented in the tubeness plugin.

2. The tubules were then thresholded , and structures containing less than 3 pixels were discarded.

3. If needed, a visual check and correction of segmented microtubule is then performed.

4. After correction, segmented MTs were then reduced to a 1-pixel thick line using the skeletonize plugin of Fiji. The length of the skeletonized microtubules was then directly proportional to their length.

5. Data were grouped by condition and converted back to micrometers units under Matlab for the statistical tests.

Pitfalls

Commented but not that general without editing some fields in the macros.

Sample Data

Sample data and workflow (see above URL) can be accessed by - login: biii - password Biii!

Misc

3D version also available here. Use of components Skeletonize and Tubeness Filter

need a thumbnail
Description

Analyzing ER, PR, and Ki-67 immunohistochemistry

ImmunoRatio is an ImageJ plugin to quantify haematoxylin and DAB-stained tissue sections by measuring the percentage of positively stained nuclear area (labeling index), described in [bib]2452[/bib].

Notes for use:

  • It is important to read the URL instructions and original paper to understand what is being measured. In particular, the primary measurement made is percentage of the total nuclear area, not the percentage of detected nuclei (the latter being the more common method of assessing e.g. Ki67). This may be further modified by the Result correction equation.
  • Ultimately ImmunoRatio relies on thresholding (color deconvolved [bib]2451[/bib]) images to define 'nucleus' vs 'non-nucleus' regions according to staining intensity. Therefore dark artefacts, such as tissue folds, are likely to cause errors.
  • The pixel size is not read automatically from the image, but rather the source image scale should be entered into the dialog box - and the image rescaled accordingly prior to analysis. This scale value is the inverse of the value normally found for pixel width and pixel height under Image -> Properties... (i.e. pixel width & height are given in microns per pixel; the dialog box asks for pixels per micron).

Web application: ImmunoRatio

Example Image: Sample ImmunoRatio results

References

  1. [2452] Tuominen VJRuotoistenmäki SViitanen AJumppanen MIsola J.  2010.  ImmunoRatio: a publicly available web application for quantitative image analysis of estrogen receptor (ER), progesterone receptor (PR), and Ki-67.. Breast Cancer Res. 12(4):R56.
  2. [2451] Ruifrok ACJohnston DA.  2001.  Quantification of histochemical staining by color deconvolution.. Anal Quant Cytol Histol. 23(4):291-9.
has topic
has function
Description

Tracking of focal adhesions includes a number of challenges:

  1. Detection of focal adhesion regions in areas of highly variable background
  2. Separation of "clumped" adhesions in different objects.
  3. Dynamics: Focal adhesions dynamically, grow, shrink, change their shape, they can fuse with neighboring adhesions or one adhesion can be split into multiple children.

Würflinger et al (2011) describe how to detect focal adhesion objects and how to track them over time. Interestingly, tracking results are fed back to segmentation to improve separation of clumped adhesions.

The authors implemented the workflow in Matlab, but do not provide a ready-to-use script.

Description

This macro batch processes all the 2D images (tif and jpg files) located in a user defined folder by calling Fiji Weka trainable segmentation to classify each pixel, and reports the areas of each class in a human readable results table. The classifier to be applied to each image should be previously trained on a representative image by an expert and exported to file (Save classifier) into the image folder to be processed.

has function
Description

This macro segments blood vessels in a 3D stack. It is suited for well-contrasted images (low background) and works better if the width of the vessels of interest is reasonably uniform.


Sample image: 1

sample image: 2

has function
Description

This macro performs measurements of average and standard deviation intensity inside wells of a protein microarray (the number of wells is limited to 250, the image should be cropped for larger arrays). The macro requires the "ImageJ plugins toolkit". To ensure compatibility with Fiji you should download the version 1.6.1The installation instructions can be found here, it only consists in un-compressing the .jar file from the previous archive to Fiji plugins folder.


sample image: link

has function
Description

The quantification is explained in detail in chapter 8 "Cell Polarity - Focal Adhesion and Actin Dynamics in Migrating Cells" in "Bioimage Data Analysis Book" downloadable from here.

For codes and sample images, download the zipped archive (linked under "Download").

has function
Description

Quote:

Measuring the colocalization between fluorescently labeled molecules is a widely used approach to measure the degree of spatial coincidence and potential interactions among subcellular species (e.g., proteins). This example shows how the object identification and RelateObjects modules are used to measure the degree of overlap between two fluorescent channels. Sample image is included in the download package.

Description

Microtubule end tracking in live cell fluorescent images of Drosophila oocyte involves overcoming the following challenges, which can be tackled by a series of preprocessing steps and tracking described in Parton et al (2011)

  • illumination flicker & photobleaching: suppress by normalising intensities, e.g. using Image->Adjust->Bleach Correction in Fiji/ImageJ
  • uneven illumination: Fourier bandpass filtering (e.g. Process->FFT->Bandpass Filter) preserves features within a selected size range
  • high background / poor contrast: foreground filter, e.g. Temporal Median filter
  • tracking: e.g. TrackMate in Fiji/ImageJ (segmentation using DoG detector)
has function
Description

Simple workflow description for ImageJ, step-by-step description for delineating focal adhesions, count and characterize their positions.  

Measurement of dynamics is not involved.

Description

The workflow includes segmentation, tracking and quantifying morphological dynamics of moving cells in 3D. The authors have implemented the workflow in Matlab, but so far there is no download link provided. To apply this workflow, we recommend to contact the authors or to implement the worflow based on the detailed description in the original paper.

has function
need a thumbnail
Description

WASH, Exo84, and cortactin spot detection and codistribution analysis To detect endosomes, an automatic Otsu threshold is applied to the Gaussian-filtered MT1-MMP–positive endosome image (= 1.5 pixels for the sample image). Statistics about each endosome are then saved, for example random positioning of spots can be compared to actual positioning. For each endosome, WASH and Exo84 (or WASH and cortactin) spots are searched for in a neighboring of x pixels in their respective channel. Their number and position are saved per endosome (**see the macro in Text file S2 downloadable from here**).

From the position of WASH and Exo84 (or WASH and cortactin) spots around each endosomes, each WASH spot is paired with its closest Exo84 (or cortactin) spot neighbor, optimized over all spots around this endosome.

This allowed measuring of the distribution of distance between WASH-Exo84 (or WASH-cortactin) spots (**for the co-distribution analysis, see matlab scripts in Zip file S3 downloadable).

endosomes and spot neighbors
Description

This macro was designed to measure the size of the scratch wound in a wound scratch assay. It uses an edge-detection and thresholding technique.

It will batch process all images in a directory. Images captured by time-lapse should be compiled into stacks using a tool similar to "Metamorph nd & ROI files importer (nd stack builder)" by Fabrice P. Cordelières. Images to be analyzed should be placed in one directory (Source Directory). A second directory should be created to save results files and images (Destination Directory). Setting correct Lower and Upper thresholds is important to obtain a good result. Two macros are available, one using edge detection, the second one using background subtraction.

Description

It explains how to use ImageJ to compare the density (aka intensity) of bands on an agar gel or western blot.

Some notes can be found here: http://cellnetmcweb.bioquant.uni-heidelberg.de/image-analysis/ShortTutorials/Fiji_GelAnalyzer.pdf

Description

The workflow contains a Matlab package (plusTipTracker) for segmentation and tracking of microtubule tips, based on fluorescence time-lapse movies from microtubule tip markers such as EB-GFP. The tracking model accounts for the specific movement characteristics of microtubules Moreover, scripts for secondary analysis of detected microtubule paths are provided.

plusTipTracker is part of u-track 2.0 package. The workflow is described in the reference. 

has topic
has function
Description

A workflow combining ImageJ macro and manually using Trainable Weka Segmentation plugin for counting clumped cells.

Description

An ImageJ macro for calculating empty surfaces on histological slices (ex: tubules in a kidney).

has topic
Description
<p>Particle detection is based on "Analyze Particles" in ImageJ. It probably could also be used in spot detection, not limited to centromere. &gt;This macro is described in Bodor et al. (2012). The macro recognizes centromere or kinetochore foci in Delta Vision or TIFF images and determines their centroid position. Fluorescent intensities are then measured for each centromere by placing a small box around the centroid position of the centromere. The peak intensity value within the box is corrected for local background by subtraction of the minimum pixel value. This process results in an accurate measurement of large numbers of centromere or kinetochore-specific signals. Following papers uses CRaQ (picked up, maybe more): - [Fachinetti et al. (2017)](https://www.cell.com/developmental-cell/pdf/S1534-5807(16)30909-1.pdf), Developmental Cell 40, 104–113, - [Guo et al. (2017)](https://www.nature.com/articles/ncomms15775) Nature Communications volume 8, Article number: 15775 (2017) doi:10.1038/ncomms15775 - [Lgosdon et. al. (2015)](http://jcb.rupress.org/content/208/5/521) J Cell Biol Mar 2015, 208 (5) 521-531; DOI: 10.1083/jcb.201412011 - [Bodor et al. (2014)](https://www.ncbi.nlm.nih.gov/pmc/articles/PMC4091408/), eLife. 2014; 3: e02137</p>
has function
Description

The tool measures the total length of the microtubules in a 3D image.

See: http://dev.mri.cnrs.fr/projects/imagej-macros/wiki/Microtubules_Tool_(3…

You can find a test image here.

3D microtubules
Description

The Arabidopsis Seedlings Tool allows to analyze the germination and seedling growth of Arabidopsis (Arabidopsis thaliana) in liquid culture. It measures the surface of green pixels per well in images containing multiple wells. It can be run in batch mode on a series of images. It writes a spreadsheet file with the measured area per well and saves a control image showing the green surface that has been detected per well. 

See http://dev.mri.cnrs.fr/projects/imagej-macros/wiki/Arabidopsis_Seedlings_Tool

Test images can be found here.

has function
ImageJ toolbar of the arabidopsis seedlings tool
Description
Human HT29 cells are fairly smooth and elliptical. This CellProfiler workflow demonstrates how to accurately identify these cells and how to measurements cellular parameters such as morphology, count, intensity and texture.
need a thumbnail