Cell segmentation

Description

Fiji plugin to segment oocyte and zona pellucida contours from transmitted light images and extract hundreds of morphological features to describe numerically the oocyte. Segmentation is based on trained neural networks (U-Net) that were trained on both mouse and human oocytes (in prophase and meiosis I) acquired in different conditions. They are freely avaialable on the github repository and can be retrained if necessary. Oocytor also have options to extract hundreds of morphological/intensity features to characterize manually the oocyte (eg perimeter, texture...). These features can also be used in machine learning pipeline for automatic phenotyping.

Description

While a quickly retrained cellpose network (only on xy slices, no need to train on xz or yz slices) is giving good results in 2D, the anisotropy of the SIM image prevents its usage in 3D. Here the workflow consists in applying 2D cellpose segmentation and then using the CellStich libraries to optimize the 3D labelling of objects from the 2D independant labels.

Here the provided notebook is fully compatible with Google Collab and can be run by uploading your own images to your gdrive. A model is provided to be replaced by your own (create by CellPose 2.0)

has function
example of usage
Description

CellStich proposes a set of tools for 3D segmentation from 2D segmentation: it reassembles 2D labels obtained from cell in slices in unique 3D labels across slices. It isparticularly robust to anisotropy, and is the ideal companion to cellpose 2D models or other 2D deep learning based models. One could also think about using it for cell tracking by overlap (using time as a third dimension).

cellstitch
Description

SuperDSM is a globally optimal segmentation method based on superadditivity and deformable shape models for cell nuclei in fluorescence microscopy images and beyond.

Description

btrack is a Python library for multi object tracking, used to reconstruct trajectories in crowded fields. btrack implemented a residual U-Net model coupledd with a classification CNN to allow accurate instance segmentation of the cell nuclei. To track the cells over time and through cell divisions, btrack developed a Bayesian cell tracking methodology that uses input features from the images to enable the retrieval of multi-generational lineage information from a corpus of thousands of hours of live-cell imaging data.

need a thumbnail
Description

The method proposed in this paper is a robust combination of multi-task learning and unsupervised domain adaptation for segmenting amoeboid cells in microscopy. This end-to-end framework provides a consolidated mechanism to harness the potential of multi-task learning to isolate and segment clustered cells from low contrast brightfield images, and it simultaneously leverages deep domain adaptation to segment fluorescent cells without explicit pixel-level re- annotation of the data.

The entry-point to the codebase is the main.py file. The user has the option to

  • Train the network on their own dataset
  • Load a pre-trained model and use that for inference on their own data
  • NoteThe provided pretrained model was trained on 256x256 images. Results on different resolutions could require fine-tuning This model is trained (supervised) on brightfield, and domain adapted to fluorescence data. The results are saved as 'inference.png'
has function
daman
Description

This workflow describes a deep-learning based pipeline for reliable single-organoid segmentation and tracking in 2D+t high-resolution brightfield microscopy of mouse mammary epithelial organoids. The pipeline involves a four-layer U-Net to infer semantic segmentation predictions, adaptive morphological filtering to establish candidate organoid instances, and a shape-similarity-constrained, instance-segmentation-correcting tracking step to associate the corresponding organoid instances in time.

It is particularly focused on automatically detecting an organoid located approximately in the center of the first frame and track all its subsequent instances in the remaining frames, emphasizing on accurate organoid boundary delineation. Furthermore, segmentation network was trained using plausible pix2pixHD-generated bioimage data. Syntheric image simulator code and data are also available here.

Adapted from https://cbia.fi.muni.cz/research/spatiotemporal/organoids.html
Description

OrganoSeg is an open-source software that integrates segmentation, filtering, and analysis for breast-cancer spheroid and colon and colorectal-cancer organoid morphologies.

Figure 2 in OrganoSeg Scientific Reports publication
Description

OrganoID is an image analysis platform that automatically recognizes, labels, and tracks single organoids, pixel-by-pixel, in brightfield and phase-contrast microscopy experiments. The platform was trained on images of pancreatic cancer organoids and validated on separate images of pancreatic, lung, colon, and adenoid cystic carcinoma organoids.

need a thumbnail

Introduction to 3D Analysis with 3D ImageJ Suite

The 3D ImageJ Suite is a set of algorithms and tools (mostly ImageJ plugins) developed since 2010, originally for 3D analysis of fluorescence microscopy. Since then, the plugins have been widely used and cited more than 200 times in biological journals. In this presentation we will give a general introduction to the tools available in the 3D ImageJ Suite : filtering, 3D segmentation for spots and nuclei, and 3D analysis. A graphical interface to manage 3D objects, the 3DManager, was also developed and will be presented.

GPU Accelerated Image Processing with CLIJ2

The NEUBIAS Academy at home about CLIJ2 gives an introduction to accelerated image processing using Graphics Processing Units (GPUs) in ImageJ/Fiji. Core concepts are explained as well as usage of the tools with the ImageJ Macro recorder and auto-completion in Fijis script editor. Furthermore, an outlook is provided of how the CLIJ project will develop in the coming years to provide long-term maintained access to GPU-acceleration in the Bio-Image Analysis context.

Image Analysis of Biological Data using CellProfiler

After the session you will be able to built your own CellProfiler pipeline, including:

  • Image data import
  • Object segmentation (e.g. detect nuclei in an image) using the modules "IdentifyPrimaryObjects" and "IdentifySecondaryObjects"
  • Object feature measurements (e.g. measure size, shape and intensity of cells)
  • Measurements export to a spreadsheet
  • Creating and saving quality control images
Description

This workflow applies a Stardist pre-trained model (versatile_fluo or versatile_HE) depending on the input images ie. uses both models for a dataset including both fluorescence (grayscale or RGB where all channels are equal) and H&E stained (RGB where channels are not equal) images.

This version uses tensorflow CPU version (See Dockerfile) to ensure compatibility with a larger number of computers. A GPU version should be possible by adapting the Dockerfile with tensorflow-gpu and/or nvidia-docker images.

has topic
has function
need a thumbnail
Description

This workflow processes a group of images containing cells with discernible nuclei and segments the nuclei and outputs a binary mask that show where nuclei were detected. It performs 2D nuclei segmentation using pre-trained nuclei segmentation models of Cellpose. And it was developed as a test workflow for Neubias BIAFLOWS Benchmarking tool.

has topic
has function
need a thumbnail
Description

The Incucyte® Base Analysis Software provides a guided interface and purpose-built tools, which include the process of acquiring, viewing, analyzing and sharing images of living cells.

need a thumbnail
Description

The authors present an ImageJ-based, semi-automated phagocytosis workflow to rapidly quantitate three distinct stages during the early engulfment of opsonized beads.

Description

SMLM is a mature but still growing field, which still lacks efficient and user-friendly analysis and visualization software platform adapted for both users and developers. We here introduce PoCA, a powerful open-source software platform dedicated to the visualization and analysis of 2D and 3D point-cloud data. PoCA allows manipulating large datasets, and integrates a plugin architecture, a native batch analysis engine and a Python code interpreter, facilitating both the analysis of data and the integration of new methods.

Visualization, segmentation and exploration of 3D SMLM data
Description

The empanada-napari plugin is built to democratize deep learning image segmentation for researchers in electron microscopy (EM). It ships with MitoNet, a generalist model for the instance segmentation of mitochondria. There are also tools to quickly build and annotate training datasets, train generic panoptic segmentation models, finetune existing models, and scalably run inference on 2D or 3D data. To make segmentation model training faster and more robust, CEM pre-trained weights are used by default. These weights were trained using an unsupervised learning algorithm on over 1.5 million EM images from hundreds of unique EM datasets making them remarkably general.

Empanada-napari
Description

ASTEC stands for Adaptive Segmentation and Tracking of Embryonic Cells. It proposes a full workflow for time lapse light sheet imaging analysis, including drift/motion compensation before the segmentation itself, and the capacity to correct for it.  It was used to process 3D+t movies acquired by the MuViSPIM light-sheet microscope in particular.

Astec embryon
Description

ClearMap is a toolbox for the analysis and registration of volumetric data from cleared tissues.

It was initially developed to map brain activity at cellular resolution in whole mouse brains using immediate early gene expression. It has since then been extended as a tool for the qunatification of whole mouse brain vascualtur networks at capilary resolution.

It is composed of sevral specialized modules or scripts: tubemap, cellmap, WobblyStitcher.

ClearMap has been designed to analyze O(TB) 3d datasets obtained via light sheet microscopy from iDISCO+ cleared tissue samples immunolabeled for proteins. The ClearMap tools may also be useful for data obtained with other types of microscopes, types of markers, clearing techniques, as well as other species, organs, or samples.

ClearMap SCreenshot
Description

Machine Learning made easy

APEER ML provides an easy way to train your own machine learning
models and segment your microscopy images. No expertise or coding required.

APEER

Description

The tool allows to measure the area of the invading spheroïd in a 3D cell invasion assay. It can also count and measure the area of the nuclei within the spheroïd.

need a thumbnail
Description

Histology Topography Cytometry Analysis Toolbox (histoCAT) is a package to visualize and analyse multiplexed image cytometry data interactively. It can also export data in.fcs data for further analysis using  a specialized cytometry sofwtare such as Flowjo. 

It can be run as a compiled standalone or from matlab.

Description

BioImage.IO -- a collaborative effort to bring AI models to the bioimaging community. 

  • Integrated with Fiji, ilastik, ImJoy and more
  • Try model instantly with BioEngine
  • Contribute your models via Github

This is a database of pretrained deep Learning models. 

need a thumbnail
Description

LOBSTER (Little Objects Segmentation and Tracking Environment), an environment designed to help scientists design and customize image analysis workflows to accurately characterize biological objects from a broad range of fluorescence microscopy images, including large images, i.e. terabytes of data, exceeding workstation main memory.

  • 75 workflows available 
  • no programming, with GUI
  • matlab based 
Description

This is the ImageJ/Fiji plugin for StarDist, a cell/nuclei detection method for microscopy images with star-convex shape priors ( typically for Dapi like staining of nuclei). The plugin can be used to apply already trained models to new images.

Stardist
Description

Summary

Deep learning-based segmentation of cells, both fluorescence, and bright-field images ("a generalist algorithm for cellular segmentation"). The tool can be used either online or local or via notebooks (e.g. ZeroCostDL4Mic).

How to use it

cellpose can be used online via ready-to-use Jyupyter notebooks with very good documentation. These notebooks are listed here.

Local Installation

The general local installation procedure can be found here.

... Installing to Silicon Mac (M1 processor) needs some tricks, and as of October 2021, the following sequence of commands works. numba should be conda-installed before pip-installing the cellpose.


conda create --name cellpose python=3.8
conda activate cellpose
conda install numba
git clone https://github.com/MouseLand/cellpose.git
cd cellpose
pip install -e .

has topic
has function
Description

DeepImageJ is a user-friendly plugin that enables the use of a variety of pre-trained deep learning models in ImageJ and Fiji. The plugin bridges the gap between deep learning and standard life-science applications. DeepImageJ runs image-to-image operations on a standard CPU-based computer and does not require any deep learning expertise.

Training developper constructs and upload trained model, and made them available to users.

Models are available in a repository here.

It is macro recordable. It is advised to use DeepImageJ on a computer with GPU (CPU will likely be 20x slower)

has topic
deepImageJ
Description

VAST (Volume Annotation and Segmentation Tool) is a utility application for manual annotation of large EM stacks.

General labeling tool, used for a large variety of 3D data sets; electron-microscopic, multi-channel light-microscopic, and Micro-CT data sets as well as videos, and annotating arbitrary structures, regions and locations, depending on the user’s needs.

Description

The macro will segment nuclei and separate clustered nuclei in a 3D image using a 2D Gaussian blur, followed by Thresholding, 2D hole filling and a 2D watershed. As a result an index-mask image is written for each input image.

need a thumbnail
Description

U-Net segmentation as presented in Reference Publication. The model predicts three classes: background, edge and foreground. The model was trained with Kaggle Data Science Bowl (DSB) 2018 training set.

has topic
has function
need a thumbnail
Description

Nuclei Segmentation using Deep Learning for individual cell analysis (DeepCell).

has topic
has function
need a thumbnail
Description

OligoMacro Toolset, is an ImageJ macro-toolset aimed at isolating oligodendrocytes from wide-field images, tracking isolated cells, characterizing processes morphology along time, outputting numerical data and plotting them. It takes benefit of ImageJ built-in functions to process images and extract data, and relies on the R software in order to generate graphs.

need a thumbnail
Description


DeepCell is neural network library for single cell analysis, written in Python and built using TensorFlow and Keras.

DeepCell aids in biological analysis by automatically segmenting and classifying cells in optical microscopy images. This framework consumes raw images and provides uniquely annotated files as an output.

The jupyter session in the read docs are broken, but the one from the GitHub are functional (see usage example )

deepcell
Description

Code to segment yeast cells using a pre-trained mask-rcnn model. We've tested this with yeast cells imaged in fluorescent images and brightfield images, and gotten good results with both modalities. This code implements an user-friendly script that hides all of the messy implementation details and parameters. Simply put all of your images to be segmented into the same directory, and then plug and go.

has function
Description

There are many methods in bio-imaging that can be parametrized. This gives more flexibility
to the user as long as tools provide easy support for tuning parameters. On the other hand, the
datasets of interest constantly grow which creates the need to process them in bulk. Again,
this requires proper tool support, if biologist is going to be able to organize such bulk
processing in an ad-hoc manner without the help of a programmer. Finally, new image
analysis algorithms are being constantly created and updated. Yet, lots of work is necessary to
extend a prototype implementation into product for the users. Therefore, there is a growing
need for software with a graphical user interface (GUI) that makes the process of image
analysis easier to perform and at the same time allows for high throughput analysis of raw
data using batch processing and novel algorithms. Main program in this area are written in
Java, but Python grow in bioinformatics and will be nice to allow easy wrap algorithm written
in this language.
Here we present PartSeg, a comprehensive software package implementing several image
processing algorithms that can be used for analysis of microscopic 3D images. Its user
interface has been crafted to speed up workflow of processing datasets in bulk and to allow
for easy modification of algorithm’s parameters. In PartSeg we also include the first public
implementation of Multi-scale Opening algorithm descibed in [1]. PartSeg allows for
segmentation in 3D based on finding connected components. The segmentation results can be
corrected manually to adjust for high noise in the data. Then, it is possible to calculate some
standard statistics like volume, mass, diameter and their user-defined combinations for the
results of the segmentation. Finally, it is possible to superimpose segmented structures using
weighted PCA method. Conclusions: PartSeg is a comprehensive and flexible software
dedicated to help biologists in processing, segmentation, visualization and the analysis of the
large microscopic 3D image data. PartSeg provides well established algorithms in an easy-touse,
intuitive, user-friendly toolbox without sacrificing their power and flexibility.


Examples include Chromosome territory analysis.

PartSeg
Description

AssayScope is an intuitive application dedicated to large scale image processing and data analysis. It is meant for histology, cell culture (2D, 3D, 2D+t) and phenotypic analysis. 

need a thumbnail
Description

"The Microscope Image Analysis Toolbox MiToBo is an extension for the widely used image processing application ImageJ and its new release ImageJ 2.0.
MiToBo ships with a set of operators ready to be used as plugins in ImageJ. They focus on the analysis of biomedical images acquired by various types of microscopes."

Description

Nessys: Nuclear Envelope Segmentation System


Nessys is a software written in Java for the automated identification of cell nuclei in biological images (3D + time). It is designed to perform well in complex samples, i.e when cells are particularly crowded and heterogeneous such as in embryos or in 3D cell cultures. Nessys is also fast and will work on large images which do not fit in memory.


Nessys also offers an interactive user interface for the curation and validation of segmentation results. Think of this as a 3D painter / editor. This editor can also be used to generate manually segmented images to use as ground truth for testing the accuracy of the automated segmentation method.


Finally Nessys, contains a utility for assessing the accuracy of the automated segmentation method. It works by comparing the result of the automated method to a manually generated ground truth. This utility will provide two types of output: a table with a number of metrics about the accuracy and an image representing a map of the mismatch between the result of the automated method and the ground truth.

has function
Description

The interactive Watershed Fiji plugin provides an interactive way to explore local maxima and threshold values while a resulting label map is updated on the fly.

After the user has found a reliable parameter configuration, it is possible to apply the same parameters to other images in a headless mode, for example via ImageJ macro scripting.

Description

ZEN and APEER – Open Ecosystem for integrated Machine-Learning Workflows

Open ecosystem for integrated machine-learning workflows to train and use machine-learning models for image processing and image analysis inside the ZEN software or on the APEER cloud-based platform

Highlights ZEN

  • Simple User Interface for Labeling and Training
  • Engineered Features Sets and Deep Feature Extraction + Random Forrest for Semantic Segmentation
  • Object Classification workflows
  • Probability Thresholds and Conditional Random Fields
  • Import your own trained models as *.czann files (see: czmodel · PyPI)
  • Import "AIModel Containes" from arivis AI for advanced Instance Segmentation
  • Integration into ZEN Measurement Framework
  • Support for Multi-dimensional Datasets and Tile Images
  • open and standardized format to store trained models
ZEN Intellesis Segmentation

ZEN Intellesis Segmentation - Training UI

ZEN Intellesis - Pretrained Networks

ZEN Intellesis Segmentation - Use Deep Neural Networks

Intellesis Object Classification

ZEN Object Classification

Highlights Aarivis AI

  • Web-based tool to label datasets to train Deep Neural Networks
  • Fully automated hyper-parameter tuning
  • Export of trained models for semantic segmentation and AIModelContainer for Instance Segmentation
Annotation Tool

APEER Annotation Tool

Description

This one example workflow from the Cell Profiler(CP)  Examples . CP is commonly used to count cells or other objects as well as percent-positives, by measuring the per-cell staining intensity. This pipeline shows how to do both of these tasks, and demonstrates how various modules may be used to accomplish the same result. 

In a few words, it used the IdentifyPrimaryObject module of CellProfiler to detect nuclei from a channel (e.g DAPI), then again the same module on another channel to detect another probe (e.g some particular histone)  .

Then objects (nuclei) are related to the second object (Histone), to create a parent child-relation ship: where nuclei can have histone has child. Nuclei are then filtered according to the property of having histone (positive) or not having histone (negtiveobject) related to them.  If needed, nuclei can be expanded in order to include touching object rather than object inside only.

The percentage of positive nuclei vs total number of nuclei can then be computed using the CalculateMath Module.

Positivepercentcell
Description


The phase contrast microscopy segmentation toolbox (PHANTAST) is a collection of open-source algorithms and tools for the processing of phase contrast microscopy (PCM) images. It was developed at University College London's department of Biochemical Engineering and CoMPLEX.

has function
Description

Orbit Image Analysis is a free open source software with the focus to quantify big images like whole slide scans.

It can connect to image servers, e.g. Omero.
Analysis can be done on your local computer or via scaleout functionality in a distrubuted computing environment like a Spark cluster.

Sophisticated image analysis algorithms incl. tissue quantification using machine learning, object segmentation and classification are build in. In addition a versatile API allows you to enhance Orbit and to run your own scripts.

Orbit
Description

automated open-source image acquisition and on-the-fly analysis pipeline (initially developped for analysis of mitotic defects in fission yeast)

maars workflow from publication


maars
Description

The Adipocytes Tools help to analyze fat cells in images from histological section. This is a rather general cell segmentation approach. It can be adapted to different situations via the parameters. This means that you have to find the right parameters for your application.

Sample Image: [0178_x5_3.tif](http://dev.mri.cnrs.fr/attachments/190/0178_x5_3.tif)

has topic
has function
Description

Analysis of adipocyte number and size. The original code and example images supposed to be discovered at http://webspace.buckingham.ac.uk/klanglands/ but currently the webpage is missing the code and sample images.

has topic
has function
Description

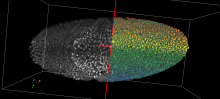
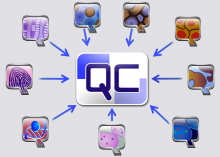
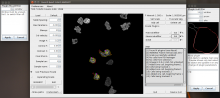
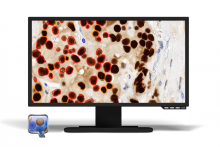
Vaa3D is a handy, fast, and versatile 3D/4D/5D Image Visualization and Analysis System for Bioimages and Surface Objects. It also provides many unique functions that you may not find in other software. It is Open Source, and supports a very simple and powerful plugin interface and thus can be extended and enhanced easily.

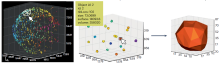
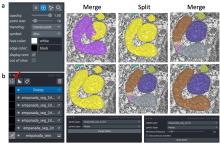
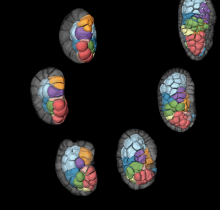
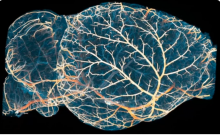
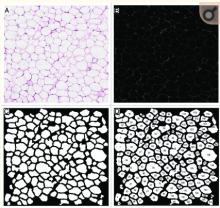
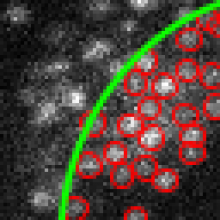
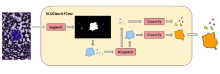
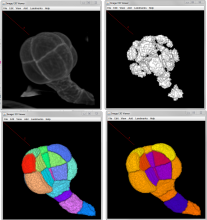
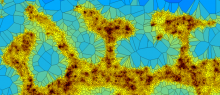
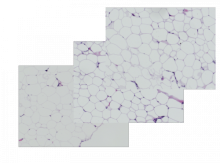
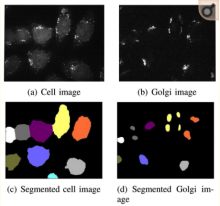
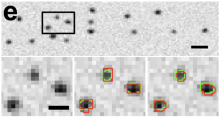
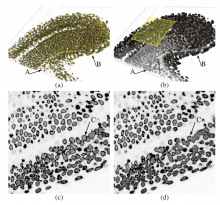
Vaa3D is cross-platform (Mac, Linux, and Windows). This software suite is powerful for visualizing large- or massive-scale (giga-voxels and even tera-voxels) 3D image stacks and various surface data. Vaa3D is also a container of powerful modules for 3D image analysis (cell segmentation, neuron tracing, brain registration, annotation, quantitative measurement and statistics, etc) and data management. This makes Vaa3D suitable for various bioimage informatics applications, and a nice platform to develop new 3D image analysis algorithms for high-throughput processing. In short, Vaa3D streamlines the workflow of visualization-assisted analysis.

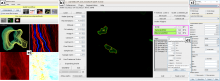
Vaa3D can render 5D (spatial-temporal) data directly in 3D volume-rendering mode; it supports convenient and interactive local and global 3D views at different scales... it comes with a number of plugins and toolboxes. Importantly, you can now write your own plugins to take advantage of the Vaa3D platform, possibly within minutes!


Vaa3D_logo
Description

Summary

QuimP is software for tracking cellular shape changes and dynamic distributions of fluorescent reporters at the cell membrane. QuimP's unique selling point is the possibility to aggregate data from many cells in form of spatio-temporal maps of dynamic events, independently of cell size and shape. QuimP has been successfully applied to address a wide range of problems related to cell movement in many different cell types. 

Introduction

In transmembrane signalling the cell membrane plays a fundamental role in localising intracellular signalling components to specific sites of action, for example to reorganise the actomyosin cortex during cell polarisation and locomotion. The localisation of different components can be directly or indirectly visualised using fluorescence microscopy, for high-throughput screening commonly in 2D. A quantitative understanding demands segmentation and tracking of whole cells and fluorescence signals associated with the moving cell boundary, for example those associated with actin polymerisation at the cell front of locomoting cells. As regards segmentation, a wide range of methods can be used (threshold based, region growing, active contours or level sets) to obtain closed cell contours, which then are used to sample fluorescence adjacent to the cell edge in a straightforward manner. The most critical step however is cell edge tracking, which links points on contours at time t to corresponding points at t+1. Optical flow methods have been employed, but usually fail to meet the requirement that total fluorescence must not change. QuimP uses a method (ECMM, electrostatic contour migration method (Tyson et al., 2010) which has been shown to outperform traditional level set methods. ECMM minimises the sum of path lengths connecting all pairs of points, equivalent to minimising the energy required for cell deformation. The original segmentation based on an active contour method and outline tracking algorithms have been described in (Dormann et al., 2002; Tyson et al., 2010; Tyson et al., 2014).

Screenshot
Description

Spot detector detects and counts spots, based on wavelet transform.

- Detects spots in noisy images 2D/3D.
- Depending on objective, spots can be nuclei, nucleus or cell
- Versatile input: sequence or batch of file.
- Detects spot in specific band/channel.
- Multi band labeling: automaticaly creates ROIs from one band and count in the same or an other band.
- Filters detection by size.
- Sort detection by ROIs
- Output data in XLS Excel files: number of detection by ROIs, and each detection location and size.
- Outputs withness image with ROIs and detection painted on it.
- Outputs binary detection image.
- Displays detections
- Displays tags

logo spot detector
Description

QuantCenter is the framework for 3DHISTECH image analysis applications. with the goal of helping the pathologists to diagnose in an easier way. QuantCenter, is optimized for whole slide quantification. It has a linkable algorithm concept that tries to provide an easy-to-use and logical workflow. The user has different quantification modules that he or she could link one after other to fine-tune or to speed up the analysis.

QuantCenter logo
Description

QuPath is open source software for Quantitative Pathology. QuPath has been developed as a research tool at Queen's University Belfast.

QuPath
Description

A workflow in Python to measure muscule fibers corresponding to the method used in Keefe, A.C. et al. Muscle stem cells contribute to myofibres in sedentary adult mice. Nat. Commun. 6:7087 doi: 10.1038/ncomms8087 (2015).


Example image:


muscleQNT/15536_2032_0.tif ...

Description

Neurolucida is a powerful tool for creating and analyzing realistic, meaningful, and quantifiable neuron reconstructions from microscope images. Perform detailed morphometric analysis of neurons, such as quantifying 1) the number of dendrites, axons, nodes, synapses, and spines, 2) the length, width, and volume of dendrites and axons, 3) the area and volume of the soma, and 4) the complexity and extension of neurons. See 10.3389/fnins.2012.00049

Neurolucida example
Description

SLDC is an open-source Python workflow. SLDC stands for Segment Locate Dispatch Classify. This framework aims at facilitating the development of algorithms for detecting objects in multi-gigapixel images. Particularly, it provides algorithm developers with a structure to define problem-dependent components of their processing workflow (i.e. segmentation and classification) in a concise way. Every other concern such as parallelization and large image handling are encapsulated by the framework. It also features a powerful and customizable logging system and some components to apply several workflows one after another on a same image. SLDC can work on local images or interact with Cytomine

Example image:

Toy image data

has topic
Description

MorphoLibJ is a library of plugin for ImageJ with functionalities for image processing such as filtering, reconstructing, segmenting, etc... Tools are based on Mathematical morphology with more rigorous mathematical approach than in the standard tools of ImageJ in particular for surface (or perimeter) measurements which are usually based on voxel counting.  

http://imagej.net/MorphoLibJ#Measurements

Among the features:

Morphological operations :  Dilation, Erosion, Opening,  Closing , Top hat (white and black), Morphological gradient (aka Beucher Gradient), Morphological Laplacian, Morphological reconstruction, Maxima/Minima , Extended Maxima/Minima -Watershed (classic or controlled) -Image overlay -Image labelling -Geodesic diameter -Region Adjacency Graph -Granulometry curves, morphological image analysis.


several steps of morphological segmentation of plant tissue using MorphoLibJ.
Description

LocAlization Microscopy Analyzer (LAMA) is a software tool that contains several well-established data post processing algorithms for single-molecule localization microscopy (SMLM) data. LAMA has implemented algorithms for cluster analysis, colocalization analysis, localization precision estimation and image registration. LAMA works with a graphical user interface (GUI), and accepts simple input data formats as supported by various single- molecule localization software tools.

Description

Localization-based super-resolution techniques open the door to unprecedented analysis of molecular organization. This task often involves complex image processing adapted to the specific topology and quality of the image to be analyzed. SR-Tesseler is an open-source segmentation software using Voronoï tessellation constructed from the coordinates of localized molecules. It allows precise, robust and automatic quantification of protein organization at different scales, from the cellular level down to clusters of a few fluorescent markers. SR-Tesseler is insensitive to cell shape, molecular organization, background and noise, allowing comparing efficiently different biological conditions in a non-biased manner, and perform quantifications on various proteins and cell types. SR-Tesseler software comes with a very simple and intuitive graphical user interface, providing direct visual feedback of the results and is freely available under GPLv3 license.

Density map of a neuron extracted from the Voronoï diagram
Description

Adiposoft is an automated Open Source software for the analysis of adipose tissue cellularity in histological sections.

Example data can be found on the plugin description page in ImageJ wiki (download link). There is also a link to a MATLAB version of the workflow.

has topic
Description

This Matlab code demonstrates an edge-based active contour model as an application of the Distance Regularized Level Set Evolution (DRLSE) formulation.

initialisation
Description

An automated MATLAB tool for segmentation of surface stained cells

has function
need a thumbnail
Description

DBSCAN (Density-based spatial clustering of applications with noise) performs multi-dimensional clustering based on the local density of points. This plugin is implemented for 2-3 dimensions.

has function
need a thumbnail
Description

A clear tutorial on how to write a MATLAB script to segment clustered cells.

The full script is downloadable near the bottom of the article. 

Description

CellDetector can detect cells (or other objects) in microscopy images such as histopathology, fluorescence, phase contrast, bright field, etc. It uses a machine learning-based method where a cell model is learned from simple dot annotations on a few images for training and predict on test sets. The installation requires some efforts but the instruction is well explained. Training parameters should be tuned for different datasets, but the default settings could be a good starting point.

has function
Description

Quantification of HER2 immunohistochemistry.

ImmunoMembrane is an ImageJ plugin for assessing HER2 immunohistochemistry, described in [bib]2472[/bib]. It is important to read the URL documentation and original paper to understand how to use the plugin appropriately.

There is web service available. Users can upload image data to process them and get cell membrane to be segmented: Web ImmunoMembrane

Note also that the pixel size is not read automatically from the image, but rather the source image scale should be entered into the dialog box - and the image rescaled accordingly prior to analysis. This scale value is the inverse of the value normally found for pixel width and pixel height under Image -> Properties... (i.e. pixel width & height are given in microns per pixel; the dialog box asks for pixels per micron).

has topic
Description

The QuimP software from Bretschneider group is deployed as ImageJ plugin and includes model-based cell segmentation, cell outline tracking and quantification of the spatially resolved speed of protrusions and retractions. The algorithm to calculate morphological dynamics is faster compared to other approaches (e.g. Machacek and Danuser, 2006). The reference paper describes the workflow for these analyses.

Description

Oufti (previously named MicrobeTracker) is a MATLAB application / suite of tools for analysing fluorescent spots inside microbes. MicrobeTracker can identify cell outlines and fluorescent foci, and generate plots and statistics based on positions and intensity (kymographs, histograms etc.) The MATLAB code is easy to modify and extend to add additional plots and statistics: see e.g. Lesterlin et al. (2014).

The Outfi Forum is quite active.

Description

This protocol first extracts the cell nuclei from a given fluorescence channel (full labeling), and grows a contour from each nucleus to extract the cell edge in another fluorescence channel (membrane-labeling).

Description

A workflow combining ImageJ macro and manually using Trainable Weka Segmentation plugin for counting clumped cells.

Description

Segmentation of Golgi.

Sample Images can be found here.

has function
Description

‘’’Squassh’’’ is a tool for 2D and 3D segmentation and quantification of subcellular shapes in fluorescence microscopy images. It provides globally optimal detection and segmentation of objects with constant internal intensity distribution, followed by object-based colocalization analysis. The segmentation computed by Region Competition can optionally correct for the PSF of the microscope, hence providing optimally deconvolved segmentations. Part of the mosaic suite

Description

Image segmentation based on the MOSAIC Discrete region competition algorithm. 

Description

IdentifySecondaryObjects identifies objects (e.g., cells) using objects identified by another module (e.g., nuclei) as a starting point.

has topic
Description

Identify objects (as nuclei) within an image without needing the assistance of another cellular feature (as cell). 

CellProfiler
Description

NuclearQuant is a QuantCenter module. It is designed for cell nuclei detection and quantification of IHC stained samples. NuclearQuant measures several morphological features besides stain intensity. The cell nuclei classification and the final score are calculated by the intensity score and the proportion score.

has topic
NuclearQuant