Fluorescence microscopy

Description

EPySeg is a package for segmenting 2D epithelial tissues. EPySeg also ships with a graphical user interface that allows for building, training and running deep learning models.

Training can be done with or without data augmentation (2D-xy and 3D-xyz data augmentation are supported). EPySeg relies on the segmentation_models library. EPySeg source code is available here. Cloud version available here.

has function
need a thumbnail
Description

Fast4DReg is a Fiji macro for drift correction for 2D and 3D video and is able to correct drift in all x-, y- and/or z-directions. Fast4DReg creates intensity projections along both axes and estimates their drift using cross-correlation based drift correction, and then translates the video frame by frame. Additionally, Fast4DReg can be used for alignment multi-channel 2D or 3D images which is particularly useful for instruments that suffer from a misalignment of channels.

has function
Description

Spine Analyzer allows to semi-automatically segment dendritic spines in 3D+t images and to measure their volumes and the intensities of the signal within in different channels over time.

Neurites with segmented dendritic spines
Description

DeXtrusion is a machine learning based python pipeline to detect cell extrusions in epithelial tissues movies. It can also detect cell divisions and SOPs, and can easily be trained to detect other dynamic events.

DeXtrusion takes as input a movie of an epithelium and outputs the spatio-temporal location of cell extrusion events or other event as cell divisions. The movie is discretized into small overlapping rolling windows which are individually classified for event detection by a trained neural network. Results are then put together in event probability map for the whole movie or as spatio-temporal points indicating each event.

DeXtrusion probability map
Description

While a quickly retrained cellpose network (only on xy slices, no need to train on xz or yz slices) is giving good results in 2D, the anisotropy of the SIM image prevents its usage in 3D. Here the workflow consists in applying 2D cellpose segmentation and then using the CellStich libraries to optimize the 3D labelling of objects from the 2D independant labels.

Here the provided notebook is fully compatible with Google Collab and can be run by uploading your own images to your gdrive. A model is provided to be replaced by your own (create by CellPose 2.0)

has function
example of usage
Description

CellStich proposes a set of tools for 3D segmentation from 2D segmentation: it reassembles 2D labels obtained from cell in slices in unique 3D labels across slices. It isparticularly robust to anisotropy, and is the ideal companion to cellpose 2D models or other 2D deep learning based models. One could also think about using it for cell tracking by overlap (using time as a third dimension).

cellstitch
Description

btrack is a Python library for multi object tracking, used to reconstruct trajectories in crowded fields. btrack implemented a residual U-Net model coupledd with a classification CNN to allow accurate instance segmentation of the cell nuclei. To track the cells over time and through cell divisions, btrack developed a Bayesian cell tracking methodology that uses input features from the images to enable the retrieval of multi-generational lineage information from a corpus of thousands of hours of live-cell imaging data.

need a thumbnail
Description

The method proposed in this paper is a robust combination of multi-task learning and unsupervised domain adaptation for segmenting amoeboid cells in microscopy. This end-to-end framework provides a consolidated mechanism to harness the potential of multi-task learning to isolate and segment clustered cells from low contrast brightfield images, and it simultaneously leverages deep domain adaptation to segment fluorescent cells without explicit pixel-level re- annotation of the data.

The entry-point to the codebase is the main.py file. The user has the option to

  • Train the network on their own dataset
  • Load a pre-trained model and use that for inference on their own data
  • NoteThe provided pretrained model was trained on 256x256 images. Results on different resolutions could require fine-tuning This model is trained (supervised) on brightfield, and domain adapted to fluorescence data. The results are saved as 'inference.png'
has function
daman
Description

MiNA is a simplified workflow for analyzing mitochondrial morphology using fluorescence images or 3D stacks in Fiji. The workflow makes use of ImageJ Ops3D ViewerSkeletonize (2D/3D)Analyze Skeleton, and Ridge Detection. In short, the tool estimates mitochondrial footprint (or volume) from a binarized copy of the image as well as the lengths of mitochondrial structures using a topological skeleton. The values are reported in a table and overlays (or a 3D rendering) are generated to assess the accuracy of the analysis.

example skeleton image (from https://imagej.net/plugins/mina#processing-pipeline-and-usage)
Description

The Incucyte® Base Analysis Software provides a guided interface and purpose-built tools, which include the process of acquiring, viewing, analyzing and sharing images of living cells.

need a thumbnail
Description

The authors present an ImageJ-based, semi-automated phagocytosis workflow to rapidly quantitate three distinct stages during the early engulfment of opsonized beads.

Description

Junction Mapper is a semi-automated software (Java Desktop application) for analysing data from images of cells in close proximity to each other in monolayers. The focus of Junction Mapper is to measure the morphology of cell boundaries, define single junctions and quantify the length, area and intensity of the staining of different proteins localised at cell-cell contacts. The output are various unique parameters that assess the contacting interface between cells and up to two junctional markers.

junction mapper
Description

BaSiC is a software tool for Background and Shading correction of Optical Microscopy Images. It implements an image correction method based on low-rank and sparse decomposition to solve both shading in space and background variation in time. It can correct temporal drift in time-lapse microscopy data and thus improve continuous single-cell quantification. BaSiC is available as a Fiji/ImageJ plugin.


has function
A BaSiC Tool for Background and Shading Correction of Optical Microscopy Images
Description

The tool allows to measure the area of the invading spheroïd in a 3D cell invasion assay. It can also count and measure the area of the nuclei within the spheroïd.

need a thumbnail
Description

webKnossos is an open-source data sharing and annotation platform for tera-scale 2D and 3D image datasets.

The core features of webKnossos are:

  • fast 3D data streaming
  • share links to specific locations in the data
  • uniquely fast skeleton annotation (flight mode) and
  • efficient volume annotation
  • mesh rendering
  • collaboration and sharing tools

webKnossos facilitates image analysis workflows on multi-terabyte datasets, including visualization of raw and multi-modal microscopy data, distributed training data generation and proof-reading of automatic segmentation.

As a scientific resource, webknossos.org serves as a database for published image datasets including their annotations.


Description

QuantiFish is a quantification program intended for measuring fluorescence in images of zebrafish, although use with images of other specimens is possible. This package is geared towards analysis of fluorescent infection models. The software is designed to automate processing of images of single fish, and outputs results as a .csv file. Alongside measures of total fluorescence above a threshold, this package also introduces several measures for dissemination and distribution of fluorescence throughout the specimen.

QuantiFish User Interface
Description

Histology Topography Cytometry Analysis Toolbox (histoCAT) is a package to visualize and analyse multiplexed image cytometry data interactively. It can also export data in.fcs data for further analysis using  a specialized cytometry sofwtare such as Flowjo. 

It can be run as a compiled standalone or from matlab.

Description

Analyze the clustering behavior of nuclei in 3D images. The centers of the nuclei are detected. The nuclei are filtered by the presence of a signal in a different channel. The clustering is done with the density based algorithm DBSCAN. The nearest neighbor distances between all nuclei and those outside and inside of the clusters are calculated.

has function
Description

ND-SAFIR is a software for denoising n-dimentionnal images especially dedicated to microscopy image sequence analysis. It is able to deal with 2D, 3D, 2D+time, 3D+time images have one or more color channel. It is adapted to Gaussian and Poisson-Gaussian noise which are usually encountered in photonic imaging. Several papers describe the detail of the method used in ndsafir to recover noise free images (see references).

It is available either in Metamorph (commercial version), either as command line tool. Source are available on demand.

has function
Description

BioImage.IO -- a collaborative effort to bring AI models to the bioimaging community. 

  • Integrated with Fiji, ilastik, ImJoy and more
  • Try model instantly with BioEngine
  • Contribute your models via Github

This is a database of pretrained deep Learning models. 

need a thumbnail
Description

LOBSTER (Little Objects Segmentation and Tracking Environment), an environment designed to help scientists design and customize image analysis workflows to accurately characterize biological objects from a broad range of fluorescence microscopy images, including large images, i.e. terabytes of data, exceeding workstation main memory.

  • 75 workflows available 
  • no programming, with GUI
  • matlab based 
Description

This is the ImageJ/Fiji plugin for StarDist, a cell/nuclei detection method for microscopy images with star-convex shape priors ( typically for Dapi like staining of nuclei). The plugin can be used to apply already trained models to new images.

Stardist
Description


DeepCell is neural network library for single cell analysis, written in Python and built using TensorFlow and Keras.

DeepCell aids in biological analysis by automatically segmenting and classifying cells in optical microscopy images. This framework consumes raw images and provides uniquely annotated files as an output.

The jupyter session in the read docs are broken, but the one from the GitHub are functional (see usage example )

deepcell
Description

Fiji plugin for detecting, tracking and quantifying filopodia

Description

This python toolbox performs registration between 2-D microscopy images from the same tissue section or serial sections in several ways to achieve imaging mass spectrometry (IMS) experimental goals.

This code supports the following works and enables others to perform the workflows outlined in the following works, please cite them if you use this toolbox:

  • Advanced Registration and Analysis of MALDI Imaging Mass Spectrometry Measurements through Autofluorescence Microscopy10.1021/acs.analchem.8b02884

  • Next Generation Histology-directed Imaging Mass Spectrometry Driven by Autofluorescence Microscopy10.1021/acs.analchem.8b02885

need a thumbnail
Description

Preprocessing step for high-density analysis methods in super resolution localisation microscopy: it aims at correcting artefacts due to these approaches with based on Haar Wavelet Kernel Analysis.

Description

Image correction software for chromatic shifts in fluorescence microscopy

null
Description

Daybook 2 is the analysis software linked to argoligth slides. It tests the performance of microscopes on various levels: illumination homogeneity, field distortion, lateral resolving power, stage drift, chromatic aberrations, intensity response... It works with various file formats but requires the use of an argolight test slide. 

Description

Assess the performance of the lasers, the objective lenses and other key components required for optimum confocal operation.

need a thumbnail
Description

This plugin allows measuring relevant parameters which helps testing, following and comparing microscopes performances. This is achieved by extracting four indicators out of standardized images, acquired from standardized samples: the estimation of the detector sensitivity, the evaluation of the field illumination homogeneity, the system resolution, and finally the characterization of its spectral registration.

has function
Description

Nessys: Nuclear Envelope Segmentation System


Nessys is a software written in Java for the automated identification of cell nuclei in biological images (3D + time). It is designed to perform well in complex samples, i.e when cells are particularly crowded and heterogeneous such as in embryos or in 3D cell cultures. Nessys is also fast and will work on large images which do not fit in memory.


Nessys also offers an interactive user interface for the curation and validation of segmentation results. Think of this as a 3D painter / editor. This editor can also be used to generate manually segmented images to use as ground truth for testing the accuracy of the automated segmentation method.


Finally Nessys, contains a utility for assessing the accuracy of the automated segmentation method. It works by comparing the result of the automated method to a manually generated ground truth. This utility will provide two types of output: a table with a number of metrics about the accuracy and an image representing a map of the mismatch between the result of the automated method and the ground truth.

has function
Description

This plugin detects a minimum cost z-surface in a 3D volume. A z surface is a topographic map indicating the altitude z as a function of the position (x,y) in the image. The cost of the surface depends on pixel intensity the surface is going through. This plugin find the z-surface with the lowest intensity in an image.

has function
Description

The interactive Watershed Fiji plugin provides an interactive way to explore local maxima and threshold values while a resulting label map is updated on the fly.

After the user has found a reliable parameter configuration, it is possible to apply the same parameters to other images in a headless mode, for example via ImageJ macro scripting.

Description

FoCuS-point is stand-alone software for TCSPC correlation and analysis. FoCuS-point utilizes advanced time-correlated single-photon counting (TCSPC) correlation algorithms along with time-gated filtering and innovative data visualization. The software has been designed to be highly user-friendly and is tailored to handle batches of data with tools designed to process files in bulk. FoCuS-point also includes advanced diffusion curve fitting algorithms which allow the parameters of the correlation functions and thus the kinetics of diffusion to be established quickly and efficiently.

Description

FoCuS-scan is software for processing and analysis of large-scale scanning fluorescence correlation spectroscopy (FCS) data. FoCuS-scan can correlate data acquired on conventional turn-key confocal systems and in the form of xt image carpets.

Description

Acquiarium is open source software (GPL) for carrying out the common pipeline of many spatial cell studies using fluorescence microscopy. It addresses image capture, raw image correction, image segmentation, quantification of segmented objects and their spatial arrangement, volume rendering, and statistical evaluation.

It is focused on quantification of spatial properties of many objects and their mutual spatial relations in a collection of many 3D images. It can be used for analysis of a collection of 2D images or time lapse series of 2D or 3D images as well. It has a modular design and is extensible via plug-ins. It is a stand-alone, easy to install application written in C++ language. The GUI is written using cross-platform wxWidgets library.

Acquiarium functionalities diagram
Description

ZEN and APEER – Open Ecosystem for integrated Machine-Learning Workflows

Open ecosystem for integrated machine-learning workflows to train and use machine-learning models for image processing and image analysis inside the ZEN software or on the APEER cloud-based platform

Highlights ZEN

  • Simple User Interface for Labeling and Training
  • Engineered Features Sets and Deep Feature Extraction + Random Forrest for Semantic Segmentation
  • Object Classification workflows
  • Probability Thresholds and Conditional Random Fields
  • Import your own trained models as *.czann files (see: czmodel · PyPI)
  • Import "AIModel Containes" from arivis AI for advanced Instance Segmentation
  • Integration into ZEN Measurement Framework
  • Support for Multi-dimensional Datasets and Tile Images
  • open and standardized format to store trained models
ZEN Intellesis Segmentation

ZEN Intellesis Segmentation - Training UI

ZEN Intellesis - Pretrained Networks

ZEN Intellesis Segmentation - Use Deep Neural Networks

Intellesis Object Classification

ZEN Object Classification

Highlights Aarivis AI

  • Web-based tool to label datasets to train Deep Neural Networks
  • Fully automated hyper-parameter tuning
  • Export of trained models for semantic segmentation and AIModelContainer for Instance Segmentation
Annotation Tool

APEER Annotation Tool

Description

This notebook uses the rOMERO-gateway and EBImage to process an Image associated to the paper 'Timing of gene expression in a cell-fate decision system'.

The Image "Pos22" is taken from the dataset idr0040-aymoz-singlecell/experimentA/YDA306_AGA1y_PRM1r_Mating. It is a timelapse Image with 42 timepoints separated by 5 minutes. This Image is used to fit a model for the growth of the yeast cells. The notebook does not replicate any of the analysis of the above mentioned paper.

Its purpose is mainly to demonstrate the use of Jupyter, rOMERO-gateway and EBimage.


What it does:

  • For each time point of one movie:
    • Read the image for this time point  from the IDR
    • Threshold the images and count the cells using EBimage functions
  • Fit an exponential model to the count of cells against time to get a coefficient of grow (exponential factor)


has function
Description

This one example workflow from the Cell Profiler(CP)  Examples . CP is commonly used to count cells or other objects as well as percent-positives, by measuring the per-cell staining intensity. This pipeline shows how to do both of these tasks, and demonstrates how various modules may be used to accomplish the same result. 

In a few words, it used the IdentifyPrimaryObject module of CellProfiler to detect nuclei from a channel (e.g DAPI), then again the same module on another channel to detect another probe (e.g some particular histone)  .

Then objects (nuclei) are related to the second object (Histone), to create a parent child-relation ship: where nuclei can have histone has child. Nuclei are then filtered according to the property of having histone (positive) or not having histone (negtiveobject) related to them.  If needed, nuclei can be expanded in order to include touching object rather than object inside only.

The percentage of positive nuclei vs total number of nuclei can then be computed using the CalculateMath Module.

Positivepercentcell
Description

This is a Jupyter notebook demonstrating the run of a code from IDR data sets by loading a CellProfiler Pipeline 

The example here is applied on real data set, but does not correspond to a biological question. It aims to demonstrate how to create a jupyter notebook to process online plates hosted in the IDR.

It reads the plate images from the IDR.

It loads the CellProfiler Pipeline and replace the reading modules used to read local files from this defaults pipeline by module allowing to read data remotely accessible.

It creates a CSV file and displays it in the notebook.

It makes some plot with Matplotlib.


jupyter
Description

This workflow can be ran with data from 3D-SIM showing the centrosomes in order to compare the distribution of diameters of rings (or toroids) of different proteins from the centrioles or the peri centriolar material. It aims to reproduce the results of the Nature Cell Biology Paper Subdiffraction imaging of centrosomes reveals higher-order organizational features of pericentriolar material  from the same data set but with a different analysis method.

It is slightly different from the methods described in the paper itself, where the method was to work on a maximum intensity projection of a 3D-SIM stack, and then to fit circle to the centrioles to estimate the diameters of the toroids.

In this workflow, the images are read from the IDR , then process by thresholding (Maximum entropy auto thresholding with Image J), and processed by Analyze Particles  with different measurement sets, including the bouding box. Then the analysis of diameters and the statistical test are performed using R. All the code and data sets are available, and in the case of this paper have shown a layered organisation of the proteins.

Combined view from Figure 1 Lawo et al.
Description

Python/C++ port of the ImageJ extension TurboReg/StackReg written by Philippe Thevenaz/EPFL.

A python extension for the automatic alignment of a source image or a stack (movie) to a target image/reference frame.

need a thumbnail
Description

Quantitative Criterion Acquisition Network (QCA Net) performs instance segmentation of 3D fluorescence microscopic images. QCA Net consists of Nuclear Segmentation Network (NSN) that learned nuclear segmentation task and Nuclear Detection Network (NDN) that learned nuclear identification task. QCA Net performs instance segmentation of the time-series 3D fluorescence microscopic images at each time point, and the quantitative criteria for mouse development are extracted from the acquired time-series segmentation image. The detailed information on this program is described in our manuscript posted on bioRxiv.

has function
Description

The purpose of the workflow is ....

First you need

need a thumbnail
Description

  FlyLimbTracker is  a method that uses active contours to semi-automatically track body and leg segments from video image sequences of unmarked, freely behaving Drosophila flies. This approach can be used to measure leg segment motions during a variety of locomotor and grooming behaviors.

For now the plugin have to be downlaoded directly from the EPFL website (see link), not from the search bar as usual in ICY.


Drosophila track legs
Description

Classification of trajectoire: need tracking results as input and will then classify the trajectories as  brownian motion, confined brownian or directed.

has function
thot
Description

SliceMap

Whole brain tissue slices are commonly used in neurobiological research for analyzing pathological features in an anatomically defined manner. However, since many pathologies are expressed in specific regions of the brain, it is necessary to have an annotation of the regions in the brain slices. Such an annotation can be done by manual delineation, as done most often, or by an automated region annotation tool.

SliceMap is a FIJI/ImageJ plugin for automated brain region annotation of fluorescent brain slices. The plugin uses a reference library of pre-annotated brain slices (the brain region templates) to annotate brain regions of unknown samples. To perform the region annotation, SliceMap registers the reference slices to the sample slice (using elastic registration plugin BUnwarpJ) and uses the resulting image transformations to morph the template regions towards the anatomical brain regions of the sample. The resulting brain regions are saved as FIJI/ImageJ ROI’s (Regions Of Interest) as a single zip-file for each sample slice.

More information can also be found in "SliceMap: an algorithm for automated brain region annotation", Michaël Barbier, Astrid Bottelbergs, Rony Nuydens, Andreas Ebneth, Winnok H De Vos, Bioinformatics, btx658, https://doi.org/10.1093/bioinformatics/btx658

Example: SliceMaps brain region segmentation
Description

Software for analysis, visualization, simulation, and acquisition  of data from spectroscopy and fluorescence microscopy.

  • Fluorescence Correlation Spectroscopy (FCS)
  • Fluorescence Lifetime Imaging (FLIM) and Phasor plots
  • Förster Resonance Energy Transfer (FRET)
  • Generalized Polarization (GP) and Spectral Phasors
  • Number and Brightness (N&B)
  • Photon Counting Histogram (PCH)
  • Raster and Spatio-temporal Image Correlation Spectroscopy (RICS and STICS)
  • Single Particle and Modulation Tracking (SPT, MT)
  • Image Mean Square Displacement (iMSD)
  • Pair correlation function (pCF)
has function
Description

"The plugin analyzes fluorescence microscopy images of neurites and nuclei of dissociated cultured neurons. Given user-defined thresholds, the plugin counts neuronal nuclei, and traces and measures neurite length."[...]" NeuriteTracer is a fast simple-to-use ImageJ plugin for the analysis of outgrowth in two-dimensional fluorescence microscopy images of neuronal cultures. The plugin performed well on images from three different types of neurons with distinct morphologies."

This plugin requires parameter setting: Threshold levels and scale (see more details on the related publication)

Description

ORION: Online Reconstruction and functional Imaging Of Neurons: segmentation and tracing of neurons for reconstruction.

A project to develop tools that explore single neuron function via sophisticated image analysis. ORION software bridges advanced optical imaging and compartmental modeling of neuronal function by rapidly, accurately, and robustly generating, from structural image data, a cylindrical morphology model suitable for simulating neuronal function. The goal of this project is to develop a computational and experimental framework to allow real-time mapping of functional imaging data (e.g., spatio-temporal patterns of dendritic voltages or intracellularions) to neuronal structure, during the very limited duration of an acute experiment.

ORION_example_result
Description

Measures wound-healing assay videos, 

 For each video, the velocity and the order parameter are analyzed in time and space to extract quantitative parameters characterizing the cell motility phenotype. The different conditions (videos) can then be classified according to these parameters.

AveMAP
Description

Summary

QuimP is software for tracking cellular shape changes and dynamic distributions of fluorescent reporters at the cell membrane. QuimP's unique selling point is the possibility to aggregate data from many cells in form of spatio-temporal maps of dynamic events, independently of cell size and shape. QuimP has been successfully applied to address a wide range of problems related to cell movement in many different cell types. 

Introduction

In transmembrane signalling the cell membrane plays a fundamental role in localising intracellular signalling components to specific sites of action, for example to reorganise the actomyosin cortex during cell polarisation and locomotion. The localisation of different components can be directly or indirectly visualised using fluorescence microscopy, for high-throughput screening commonly in 2D. A quantitative understanding demands segmentation and tracking of whole cells and fluorescence signals associated with the moving cell boundary, for example those associated with actin polymerisation at the cell front of locomoting cells. As regards segmentation, a wide range of methods can be used (threshold based, region growing, active contours or level sets) to obtain closed cell contours, which then are used to sample fluorescence adjacent to the cell edge in a straightforward manner. The most critical step however is cell edge tracking, which links points on contours at time t to corresponding points at t+1. Optical flow methods have been employed, but usually fail to meet the requirement that total fluorescence must not change. QuimP uses a method (ECMM, electrostatic contour migration method (Tyson et al., 2010) which has been shown to outperform traditional level set methods. ECMM minimises the sum of path lengths connecting all pairs of points, equivalent to minimising the energy required for cell deformation. The original segmentation based on an active contour method and outline tracking algorithms have been described in (Dormann et al., 2002; Tyson et al., 2010; Tyson et al., 2014).

Screenshot
Description

The Sprout Morphology plugin measures sprout number, length, width and cell density of endothelial cell (EC) sprouts grown in a bead sprouting assay. It optionally includes measuring the coverage of these sprouts with pericytes included in the assay, as well as the endothelial cell/pericyte ratio.

graphical abstract
Description

SOAX is an open source software tool to extract the centerlines, junctions and filament lengths of biopolymer networks in 2D and 3D images. It facilitates quantitative, reproducible and objective analysis of the image data. The underlying method of SOAX uses multiple Stretching Open Active Contours (SOACs) that are automatically initialized at image intensity ridges and then stretch along the centerlines of filaments in the network. SOACs can merge, stop at junctions, and reconfigure with others to allow smooth crossing at junctions of filaments.

SOAX provides 3D visualization for exploring image data and visually checking results against the image. Quantitative analysis functions based on extracted networks are also implemented in SOAX, including spatial distribution, orientation, and curvature of filamentous structures. SOAX also provides interactive manual editing to further improve the extraction results, which can be saved in a file for archiving or further analysis. Useful for microtubules or actin filaments.

Observation: Depending on the operating system, the installation may or may not require Boost C++, ITK and VTK libraries. Windows has a standalone executable application without the need of those. 

snapshot microtubules soax
Description

This ImageJ plug-in is a compilation of co-localization tools. It allows:

-Calculating a set of commonly used co-localization indicators:

Pearson's coefficient Overlap coefficient k1 & k2 coefficients Manders' coefficient Generating commonly used visualizations:

-Cytofluorogram

Having access to more recently published methods:

-Costes' automatic threshold

Li's ICA Costes' randomization Objects based methods (2 methods: distances between centres and centre-particle coincidence)

example of partial colocalisation from reference publication
Description

ADAPT is capable of rapid, automated analysis of migration and membrane protrusions, together with associated
fluorescently labeled proteins, across multiple cells. ADAPT can detect and morphologically profile filopodia.

ADAPT (Automated Detection and Analysis of ProTrusions) is a plug-in developed for the ImageJ/Fiji platform to automatically detect and analyse cell migration and morphodynamics. The program provides whole-cell analysis of multiple cells, while also returning data on individual membrane protrusion events. The plug-in accepts as input one or two image stacks and outputs a variety of data. ADAPT may also be run in batch mode.


has function
ADAPT logo
Description

A workflow in Python to measure muscule fibers corresponding to the method used in Keefe, A.C. et al. Muscle stem cells contribute to myofibres in sedentary adult mice. Nat. Commun. 6:7087 doi: 10.1038/ncomms8087 (2015).


Example image:


muscleQNT/15536_2032_0.tif ...

Description

PSF Lab is a software program that calculates the illumination point spread function of a confocal microscope under various imaging conditions. It is available in 32-bit and 64-bit for Windows and in 64-bit for Mac.

has function
Description

## Short Summary Quote from the plugin page: >LineageTracker offers an ImageJ based framework which is easily extendible and has the capability to track cell lineages while being specifically designed to handle large cell displacements between frames. The methods are designed for fluorescent cells and have been used to analyse Schizosaccharomyces pombe, C2C12 mouse stem cells or migrating RPE cells. This tool also allows flexible cell segmentation and extendable in all aspects. The webpage is detailed with usage from ImageJ macro. Rather than being simply a component, the plugin is indeed a framework with set of components. ## Misc info A tip from the plugin author in ImageJ mailing list (08.Sep.2015): > We have an additional script to export only a selected range of frames. I can send you that if you think LineageTracker is something for you. To be on the safe side I would try it with an older version of ImageJ. We have experienced some problems, mostly related to Java. Java 8 seems to fix most of it. ## References 2630: Application example. 2631: Plugin Paper.

has function
need a thumbnail
Description

## About TANGO software is an open-source software for Analysis of Nuclear Genome Organization. It is composed of an ImageJ plugin for batch processing and analysis, and a R package for statistical analysis. Reference: 2528 ## Some key features - Image import uses bioimage formats. - Construction of workflow in GUI by choosing filters / segmentation strategy for - Prefiltering - Segmentation - Postfiltering - Isolated nuclei could individually be inspected, deleted from list and subjected for detailed analysis. - Uses MCIB3D library as backend. - Basic usage is to segment nucleus, crop them to single nucleus objects, segment substructures within objects and measure their properties. - Optionally R can be connected to do detailed analysis of results. - Uses MongoDB to manage huge data set.

need a thumbnail
Description

Quote: *A GUI-based program which manually detects spots and places them into previously detected meshes. Currently the program runs from MATLAB only. *

need a thumbnail
Description

A collection for tracking microtubule dynamics, written in Python.

has function
Description

Rigid registration of time series in 3D. A video tutorial is available (be careful of sounds, the video automatically starts!): [Sample Drift Correction Following 4D Confocal Time-lapse Imaging](http://www.jove.com/video/51086/sample-drift-correction-following-4d-co…)

has function
Description

Normalize the orientation of the images of the Zebrafish embryos.

In the documentation webpage, the aim of the workflow is to normalize the orientation of the images of the Zebrafish embryos, find the point of injection of tumor cells and measure the distribution of Cy3 stained tumor foci.

ImageJ macro implementation of the Workflow described in Ghotra et al (2012). Note that currently only the angle and orientation normalization is implemented in this version.

Sample images are linked in the documentation webpage. 

has function
Description

A clear tutorial on how to write a MATLAB script to segment clustered cells.

The full script is downloadable near the bottom of the article. 

Description

A workflow template to analyze subcellular structures in fluorescence 2D/3D microscopy images based on a Fiji plugin **Squassh** is described in Rizek et al (2014).

The workflow employs detecting, segmenting, and quantifying subcellular structures. For segmentation, it accounts for the microscope optics and for uneven image background. Further analyses include both colocalization and shape analyses. However, it does not work directly for time-lapse data. A brief summary note can be found here.

Description

CellDetector can detect cells (or other objects) in microscopy images such as histopathology, fluorescence, phase contrast, bright field, etc. It uses a machine learning-based method where a cell model is learned from simple dot annotations on a few images for training and predict on test sets. The installation requires some efforts but the instruction is well explained. Training parameters should be tuned for different datasets, but the default settings could be a good starting point.

has function
Description

Very simple application that lets you load your time-lapse intensity data to generate the normalized FRAP recovery curve and perform exponential curve fitting.

Quote: The user can handle simultaneously large data sets of raw data, visualize fluorescence recovery curves, exclude low quality data, perform data normalization, extract quantitative parameters, perform batch analysis and save the resulting data and figures for further use. Our tool is implemented as a single-screen Graphical User Interface (GUI) and is highly interactive, as it permits parameterization and visual data quality assessment at various points during the analysis.

Description

Oufti (previously named MicrobeTracker) is a MATLAB application / suite of tools for analysing fluorescent spots inside microbes. MicrobeTracker can identify cell outlines and fluorescent foci, and generate plots and statistics based on positions and intensity (kymographs, histograms etc.) The MATLAB code is easy to modify and extend to add additional plots and statistics: see e.g. Lesterlin et al. (2014).

The Outfi Forum is quite active.

Description

In this human cytoplasm-nucleus translocation assay, learn how to load a previously calculated illumination correction function for two separate channels, measure protein content in the nucleus and cytoplasm, and calculate the ratio as a measure of translocation. This is a clumpy cell type, so studying the settings in primary object identification may be helpful for users interested in the more advanced options that module offers. More about these images can be found at the BBBC.

need a thumbnail
Description

Task

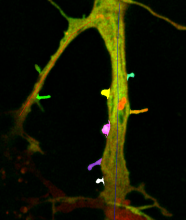
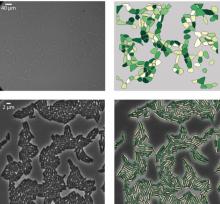
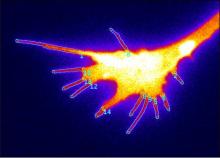
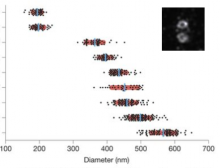
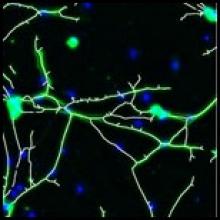
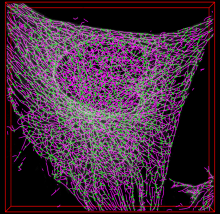
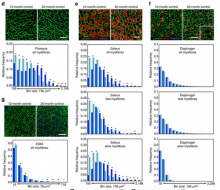
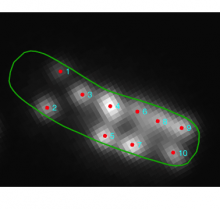
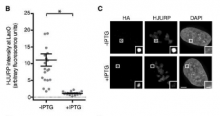
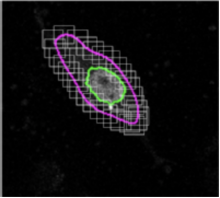
Quantify the length of microtubules (MT) and the MT average density per cell.

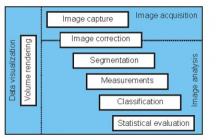
Workflow descriptions

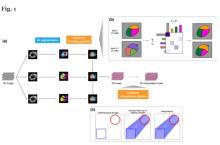
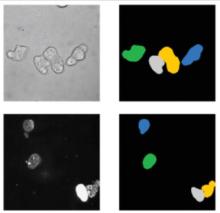
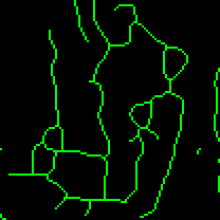
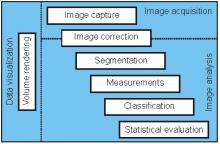
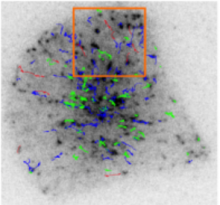
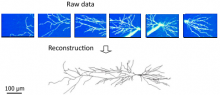
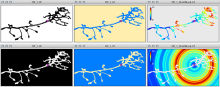
Simple two step workflow, allowing visual & manual correction of microtubule between the 2 steps. Batch measurement of microtubule lengths for multiple images is achieved by segmenting the MTs and then their skeletonizations. The number of pixels in the microtubule is proportional to their length, so the length can be estimated.

Script

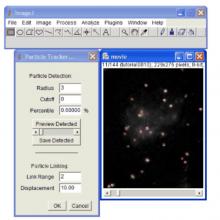
Workflow is written as an ImageJ macro (Fiji) with following steps:

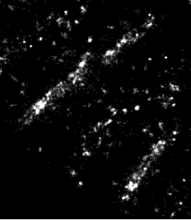
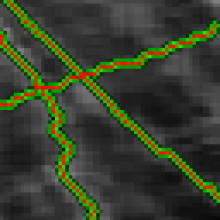
1. The enhancement of tubular structure by computing eigenvalues of the hessian matrix on a Gaussian filtered version of the image ( sigma 1 pixel), as implemented in the tubeness plugin.

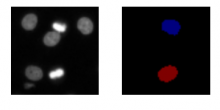
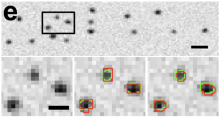
2. The tubules were then thresholded , and structures containing less than 3 pixels were discarded.

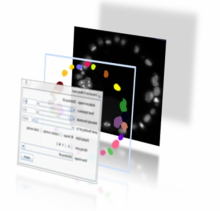
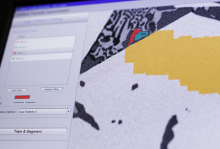
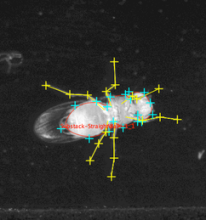
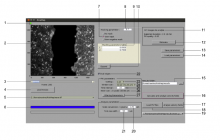
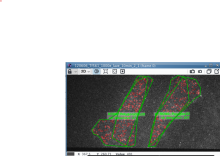
3. If needed, a visual check and correction of segmented microtubule is then performed.

4. After correction, segmented MTs were then reduced to a 1-pixel thick line using the skeletonize plugin of Fiji. The length of the skeletonized microtubules was then directly proportional to their length.

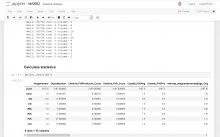
5. Data were grouped by condition and converted back to micrometers units under Matlab for the statistical tests.

Pitfalls

Commented but not that general without editing some fields in the macros.

Sample Data

Sample data and workflow (see above URL) can be accessed by - login: biii - password Biii!

Misc

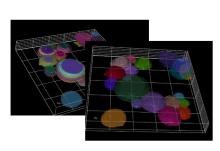
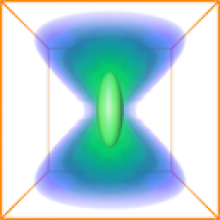
3D version also available here. Use of components Skeletonize and Tubeness Filter

need a thumbnail
Description

Tracking of focal adhesions includes a number of challenges:

  1. Detection of focal adhesion regions in areas of highly variable background
  2. Separation of "clumped" adhesions in different objects.
  3. Dynamics: Focal adhesions dynamically, grow, shrink, change their shape, they can fuse with neighboring adhesions or one adhesion can be split into multiple children.

Würflinger et al (2011) describe how to detect focal adhesion objects and how to track them over time. Interestingly, tracking results are fed back to segmentation to improve separation of clumped adhesions.

The authors implemented the workflow in Matlab, but do not provide a ready-to-use script.

Description

Generation of Kymographs using 2D+t images. In the generated kymographs, objects can be tracked and the results are visualized.

has function
Description

Simple workflow description for ImageJ, step-by-step description for delineating focal adhesions, count and characterize their positions.  

Measurement of dynamics is not involved.

Description

This macro is meant to segment the cells of a multicellular tissue. It is written for images showing highly contrasted and uniformly stained cell membranes. The geometry of the cells and their organization is automatically extracted and exported to an ImageJ results table. This includes: Cell area, major, minor fitted ellipse radii + major axis orientation and number of neighbors of the cells. Manual correction of the automatic segmentation is supported (merge split cells, split merged cells).

Sample image data is available in the documentation page. 

Description
<p>Particle detection is based on "Analyze Particles" in ImageJ. It probably could also be used in spot detection, not limited to centromere. &gt;This macro is described in Bodor et al. (2012). The macro recognizes centromere or kinetochore foci in Delta Vision or TIFF images and determines their centroid position. Fluorescent intensities are then measured for each centromere by placing a small box around the centroid position of the centromere. The peak intensity value within the box is corrected for local background by subtraction of the minimum pixel value. This process results in an accurate measurement of large numbers of centromere or kinetochore-specific signals. Following papers uses CRaQ (picked up, maybe more): - [Fachinetti et al. (2017)](https://www.cell.com/developmental-cell/pdf/S1534-5807(16)30909-1.pdf), Developmental Cell 40, 104–113, - [Guo et al. (2017)](https://www.nature.com/articles/ncomms15775) Nature Communications volume 8, Article number: 15775 (2017) doi:10.1038/ncomms15775 - [Lgosdon et. al. (2015)](http://jcb.rupress.org/content/208/5/521) J Cell Biol Mar 2015, 208 (5) 521-531; DOI: 10.1083/jcb.201412011 - [Bodor et al. (2014)](https://www.ncbi.nlm.nih.gov/pmc/articles/PMC4091408/), eLife. 2014; 3: e02137</p>
has function
Description

The Huygens Software Suite consists of different image processing packages with functionalities that include deconvolution, interactive analysis, and volume visualization of 2D-3D multi-channel and time series images from fluorescence microscopes such as widefield, confocal, multi-photon, spinning disk, Array Detector, STED, and Light Sheet

Description

Deconvolution software

has function
Image restoration with AutoQuant
Description

Acquiarium is for carrying out the common pipeline of many spatial cell studies using fluorescence microscopy. It addresses image capture, raw image correction, image segmentation, quantification of segmented objects and their spatial arrangement, volume rendering, and statistical evaluation. It is focused on quantification of spatial properties of many objects and their mutual spatial relations in a collection of many 3D images. It can be used for analysis of a collection of 2D images or time lapse series of 2D or 3D images as well. It has a modular design and is extensible via plug-ins. It is a stand-alone, easy to install application written in C++ language. The GUI is written using cross-platform wxWidgets library.

Functionalities
Description

An ImageJ macro for correcting frame drift occurred during image acquisition.

It often happens that you have an image sequence that shows problematic drifting of image frame and at the same time you have some landmarks that could be used for correcting the drift. This ImageJ macro allows you to Manually track the landmark using ImageJ Manual Tracking Plugin. Using the coordinates recorded in the Result window, each frame is shifted back so that the landmark stays in a single place.

Description

‘’’Squassh’’’ is a tool for 2D and 3D segmentation and quantification of subcellular shapes in fluorescence microscopy images. It provides globally optimal detection and segmentation of objects with constant internal intensity distribution, followed by object-based colocalization analysis. The segmentation computed by Region Competition can optionally correct for the PSF of the microscope, hence providing optimally deconvolved segmentations. Part of the mosaic suite

Description

Image segmentation based on the MOSAIC Discrete region competition algorithm. 

Description

Easy-to-use, computationally efficient, two- and three-dimensional, feature point-tracking tool for the automated detection and analysis of particle trajectories as recorded by video imaging in cell biology. 


The tracking process requires no apriori mathematical modelling of the motion, it is self-initialising, it discriminates spurious detections, and it can handle temporary occlusion as well as particle appearance and disappearance from the image region. 


The plugin is well suited for video imaging in cell biology relying on low-intensity fluorescence microscopy. It allows the user to visualize and analyze the detected particles and found trajectories in various ways:

  • Preview and save detected particles for separate analysis
  • Global non progressive view on all trajectories
  • Focused progressive view on individually selected trajectory
  • Focused progressive view on trajectories in an area of interest

It also allows the user to find trajectories from uploaded particles position and information text files and then to plot particles parameters vs. time - along a trajectory

Description

This ImageJ plugin creates high resolution PSF images by averaging many bead im- ages as well as exploiting the assumption that the point spread function is rotationally symmetric with respect to the axial axis (z-direction).

Description

This plugin can be used for inferring spatial interactions between patterns of spot-like objects in images or between coordinates read from a file. 

Description

CellTracker software is a platform for tracking nuclear and cytoplasmic fluorescence intensities from live cell microscopy time series data.


Requires visual C++

Description

Histogram-based background subtractor for ImageJ.

The implemented algorithm is based on the assumption that, compared to the background region, object (foreground) regions are small. The plugin builds local histograms and assumes the most occuring intensity to be part of the background.

Description

Three different methods for correcting fluorescence bleaching. 1. Simple (framewise ratio based) 2. Exponential (curve fitting with exponential decay model) 3. Histogram matching (register histogram shape. with 16 bit, it takes long time... it should be improved).

has function
Description

The track manager enables the use of DSP-like trackProcessors. This can affect the display of tracks, selection in time or by ROIs, and also compute some views like the overlaid and animated local flow graph, polar graph.

has function
Description

A TrackProcessor that allows the user to monitor, visualize, and export, the intensity profile of tracks in time lapse sequences of 2D images.

has function
need a thumbnail
Description

This segmentation method performs a N-class thresholding based on a K-Means classification of the image histogram, then extracts objects in a bottom-up manner using user-defined minimum and maximum object sizes. Very useful to detect clustered objects in fluorescence microscopy.

need a thumbnail
Description
  • Counts the number of 3D objects in a stack.
  • quantifies for each found object the following parameters:
    • 3D intensity related measurement (with possible redirection to an image with the actual intensity value to be measured, for example for two channels measurements)
    • Volume and shape factors measurements, surface etc...
  • generates results representations such as:
    • Objects' map;
    • Surface voxels' map;
    • Centroids' map;
    • Centres of masses' map.

As ImageJ's “Analyze Particles” function, 3D-OC also has a “redirect to” option, allowing one image to be taken as a mask to quantify intensity related parameters on a second image. But unlike the Analyze particle, it include a thresholding option, meaning that you can start from a gray level  stack, not necessarily a binary mask.

To use it, first set the list of measurements by editing 3D OC Options. Both (3D Object counter and 3D OC Options are now in the default Fiji "Analyze" menu.

need a thumbnail
Description

Add some noise with customizable characteristics (Gaussian noise, Poisson noise, salt & pepper, etc.) to a sequence. ICY plugin.

need a thumbnail
Description

An ImageJ plugin for evaluate intra-nuclear 3D cross-distances between fluorescent spots in multi-channel images ![image](http://bigwww.epfl.ch/sage/soft/spotdistance/meta/splash.png)

has function
need a thumbnail
Description

Identify objects (as nuclei) within an image without needing the assistance of another cellular feature (as cell). 

CellProfiler
Description

Volocity Visualization is designed to provide rapid, interactive, high resolution volume rendering of multi-channel 3D and 4D data sets. This Volocity product puts you in control of the way that you view your 3D data, offering a choice of rendering methods so that you can achieve the best results.  A range of file formats can be imported from  wide field and confocal microscopes, and snapshots and movies can be created quickly and easily to share and publish.

has function
Description

quote:

MeasureObjectIntensityDistribution measures the spatial distribution of intensities within each object.

Old Name: MeasureObjectRadialDistribution

Description

Colocalizer block.

Description

The Sholl technique is used to describe neuronal arbors. This plugin can perform Sholl directly on 2D and 3D grayscale images of isolated neurons. Its internal algorithm to collect data is based upon how Sholl analysis is done by hand — it creates a series of concentric shells (circles or spheres) around the focus of a neuronal arbor, and counts how many times connected voxels defining the arbor intersect the sampling shells. The major advantages of this plugin over other implementations are:

sholl analysis
Description

This plugin permit to measure the signal spread of a molecule with respect to the cell area.

Description

An ImageJ plugin for manually tracking objects by mouse clicking. 

This plugin is bundled with Fiji. 


has function
Description

This plugins allows debleaching of time sequences of fluorescence images.

has function
need a thumbnail
Description

TrackMate provides the tools to perform single particle tracking (SPT). SPT is an image analysis challenge where the goal is to segment and follow over time some labeled, spot-like structures. Each spot is segmented in multiple frames and its trajectory is reconstructed by assigning it an identity over these frames, in the shape of a track. These tracks can then be either visualized or yield further analysis results such as velocity, total displacement, diffusion characteristics, division events, etc...