Image analysis

Synonyms
General image analysis
Description

Fiji plugin to segment oocyte and zona pellucida contours from transmitted light images and extract hundreds of morphological features to describe numerically the oocyte. Segmentation is based on trained neural networks (U-Net) that were trained on both mouse and human oocytes (in prophase and meiosis I) acquired in different conditions. They are freely avaialable on the github repository and can be retrained if necessary. Oocytor also have options to extract hundreds of morphological/intensity features to characterize manually the oocyte (eg perimeter, texture...). These features can also be used in machine learning pipeline for automatic phenotyping.

Description

The BioVoxxel Toolbox is a suite which contains plugins and some macros dealing with image filtering, image segmentation and binary image processing and analysis. The following plugins are hosted here:

  • Extended Particle Analyzer
  • Binary Feature Extractor
  • Speckle Inspector
  • Watershed Irregular Features
  • EDM Binary Operations
  • Filter Check
  • Pseudo flat-field correction
  • Convoluted Background Subtraction
  • 2D Particle Distribution (Distribution_Analysis)
  • Cluster Indicator
  • SSIDC Cluster Indicator
  • Gaussian weighted Median filter
  • Adaptive Filter
  • Enhance True Color Contrast
  • Mode and Differential Limited Mean Binarization
  • Basic Recursive Filter
has topic
Description

MATLAB app to characterize nanoparticles imaged with super-resolution microscopy. nanoFeatures will read text and csv files from the NIKON and ONI microscopes and from the ThunderSTORM Fiji plugin, then cluster the localizations and filter by size and sphericity and finally output nanoparticle features like size, aspect ratio, and number of localizations per cluster (total and for each channel).

GUI first tab to browse and input files, select input type and check extra filters if needed.

Introduction to 3D Analysis with 3D ImageJ Suite

The 3D ImageJ Suite is a set of algorithms and tools (mostly ImageJ plugins) developed since 2010, originally for 3D analysis of fluorescence microscopy. Since then, the plugins have been widely used and cited more than 200 times in biological journals. In this presentation we will give a general introduction to the tools available in the 3D ImageJ Suite : filtering, 3D segmentation for spots and nuclei, and 3D analysis. A graphical interface to manage 3D objects, the 3DManager, was also developed and will be presented.

GPU Accelerated Image Processing with CLIJ2

The NEUBIAS Academy at home about CLIJ2 gives an introduction to accelerated image processing using Graphics Processing Units (GPUs) in ImageJ/Fiji. Core concepts are explained as well as usage of the tools with the ImageJ Macro recorder and auto-completion in Fijis script editor. Furthermore, an outlook is provided of how the CLIJ project will develop in the coming years to provide long-term maintained access to GPU-acceleration in the Bio-Image Analysis context.

Image Analysis of Biological Data using CellProfiler

After the session you will be able to built your own CellProfiler pipeline, including:

  • Image data import
  • Object segmentation (e.g. detect nuclei in an image) using the modules "IdentifyPrimaryObjects" and "IdentifySecondaryObjects"
  • Object feature measurements (e.g. measure size, shape and intensity of cells)
  • Measurements export to a spreadsheet
  • Creating and saving quality control images
Description

Fractal is a framework to process high-content imaging data at scale and prepare it for interactive visualization. Fractal provides distributed workflows that convert TBs of image data into OME-Zarr files. The platform then processes the 3D image data by applying tasks like illumination correction, maximum intensity projection, 3D segmentation using cellpose and measurements using napari workflows. The pyramidal OME-Zarr files enable interactive visualization in the napari viewer.

need a thumbnail

Fractal: A framework for processing OME-Zarr high content imaging data

Fractal is a framework to process high-content imaging data at scale and prepare it for interactive visualization. Fractal provides distributed workflows that convert TBs of image data into OME-Zarr files. The platform then processes the 3D image data by applying tasks like illumination correction, maximum intensity projection, 3D segmentation using cellpose and measurements using napari workflows. The pyramidal OME-Zarr files enable interactive visualization in the napari viewer.
These slides are from an early demo of Fractal in November 2022

Description

MiNA is a simplified workflow for analyzing mitochondrial morphology using fluorescence images or 3D stacks in Fiji. The workflow makes use of ImageJ Ops3D ViewerSkeletonize (2D/3D)Analyze Skeleton, and Ridge Detection. In short, the tool estimates mitochondrial footprint (or volume) from a binarized copy of the image as well as the lengths of mitochondrial structures using a topological skeleton. The values are reported in a table and overlays (or a 3D rendering) are generated to assess the accuracy of the analysis.

example skeleton image (from https://imagej.net/plugins/mina#processing-pipeline-and-usage)
Description


Relate is a correlative software package optimised to work with EM, EDS, EBSD, & AFM data and images.  It provides the tools you need to correlate data from different microscopes, visualise multi-layered data in 2D and 3D, and conduct correlative analyses.

  • Combining data from different imaging modalities (e.g. AFM, EDS & EBSD)

  • Interactive display of multi-layer correlated data

  • Analytical tools for metadata interrogation

  • Documented workflows and processes

Correlate

  • Import data from AZtec using the H5oina file format
  • Import AFM data
  • Correlate both sets of data using intuitive image overlays and image matching tools
  • Produce combined multimodal datasets

Visualise

  • 2D display of multi-layered data
  • 3D visualisation of topography combined with AFM material properties, EM images, and EDS & EBSD map overlays
  • Customisation of colour palettes, data overlays, image rendering options, and document display
  • Export images and animations

Analyse

  • Generate profile (cross section) views of multimodal data
  • Measure and quantify data across multiple layers
  • Analyse areas via data thresholding using amount of x-ray counts, phase maps, height, or other material properties.
  • Select an extensive range of measurement parameters
  • Export analytical data to text or CSV files
Relate analysis workflow example

MIA

Description

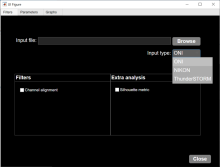
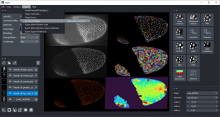
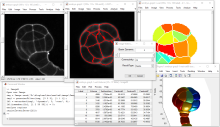
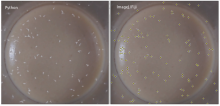
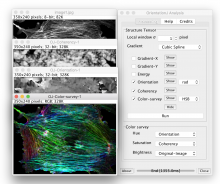
ModularImageAnalysis (MIA) is an ImageJ plugin which provides a modular framework for assembling image and object analysis workflows. Detected objects can be transformed, filtered, measured and related. Analysis workflows are batch-enabled by default, allowing easy processing of high-content datasets.

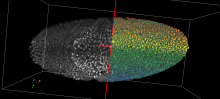
MIA is designed for “out-of-the-box” compatibility with spatially-calibrated 5D images, yielding measurements in both pixel and physical units.  Functionality can be extended both internally, via integration with SciJava’s scripting interface, and externally, with Java modules that extend the MIA framework. Both have full access to all objects and images in the analysis workspace.

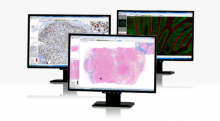
Workflows are, by default, compatible with batch processing multiple files within a single folder. Thanks to Bio-Formats, MIA has native support for multi-series image formats such as Leica .lif and Nikon .nd2.

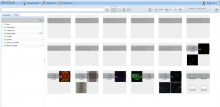
Workflows can be automated from initial image loading through processing, object detection, measurement extraction, visualisation, and data exporting. MIA includes near 200 modules integrated with key ImageJ plugins such as Bio-Formats, TrackMate and Weka Trainable Segmentation.

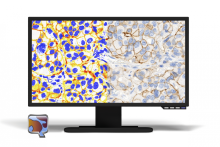
Module(s) can be turned on/off dynamically in response to factors such as availability of images and objects, user inputs and measurement-based filters. Switches can also be added to “processing view” for easy workflow control.

MIA is developed in the Wolfson Bioimaging Facility at the University of Bristol.

Description

ClearMap is a toolbox for the analysis and registration of volumetric data from cleared tissues.

It was initially developed to map brain activity at cellular resolution in whole mouse brains using immediate early gene expression. It has since then been extended as a tool for the qunatification of whole mouse brain vascualtur networks at capilary resolution.

It is composed of sevral specialized modules or scripts: tubemap, cellmap, WobblyStitcher.

ClearMap has been designed to analyze O(TB) 3d datasets obtained via light sheet microscopy from iDISCO+ cleared tissue samples immunolabeled for proteins. The ClearMap tools may also be useful for data obtained with other types of microscopes, types of markers, clearing techniques, as well as other species, organs, or samples.

ClearMap SCreenshot
Description

The napari-pyclesperanto-assistant is a yet experimental napari plugin for building GPU-accelerated image processing workflows targeting life-sciences and bio-image analysis. It is part of the clEsperanto project. It uses pyclesperanto and pyopencl as backend for processing images.

has function
Description

Phindr3D is a comprehensive shallow-learning framework for automated quantitative phenotyping of three-dimensional (3D) high content screening image data using unsupervised data-driven voxel-based feature learning, which enables computationally facile classification, clustering and data visualization.

Please see our GitHub page and the original publication for details.

Description

This tool allows to analyze morphological characteristics of complex roots. While for young roots the root system architecture can be analyzed automatically, this is often not possible for more developed roots. The tool is inspired by the Sholl analysis used in neuronal studies. The tool creates a binary mask and the Euclidean Distance Transform from the input image. It then allows to draw concentric circles around a base point and to extract measures on or within the circles. Instead of circles, which present the distance from the base point, horizontal lines can be used, which present the distance in the soil from the base-line. The following features are currently implemented:

  • The area of the root per distance/depth.
  • The number of border pixel per distance/depth, giving an idea of the surface in contact with the soil.
  • The maximum radius per distance/depth of a root, measured at the crossing points with the circles or lines.
  • The number of crossings of roots with the circles or lines.
  • The maximum distance to the left and the right from the vertical axis at crossing points with the circles or lines.
Concentric circles on the mask of a root, created by the Analyze Complex Roots Tool
Description

Quote:

LaRoME = Label + Region Of Interest + Measure

Label image (aka Count Masks): An image in which pixels of an object have all the same value. Each object has a unique value.

Measurement image: An image in which pixels of an object have all the same value, corresponding to a measurement (Area, Angle, Mean...)

has function
Description

The ImageM application proposes an integrated user interface that facilitates the processing and the analysis of multi-dimensional images within the Matlab environment. It provides a user-friendly visualization of multi-dimensional images, a collection of image processing algorithms and methods for analysis of images, the management of spatial calibration, and facilities for the analysis of multi-variate images. Its graphical user interface is largely inspired from the open source software "ImageJ". ImageM can also be run on the open source alternative software to Matlab, Octave.

ImageM is freely distributed on GitHub: https://github.com/mattools/ImageM.

Processing of a 3D image with the ImageM sotfware
Description

Epina ImageLab is a Microsoft Windows-based multisensor imaging tool for processing and analyzing hyperspectral images. It is a modular system consisting of a basic engine, a graphical user interface, a chemometrics toolbox and optional user-supplied modules. It supports the most important spectroscopic imaging techniques, such as UV/Vis, infrared, Raman, THz, optical emission/absorption, and mass spectrometry. On top of that Epina ImageLab enables the user to merge hyperspectral images with maps of physical properties and conventional high-resolution color photos. 

need a thumbnail
Description

QuickFit 3 is a data evaluation software for FCS Fluorescence Correlation Spectroscopy and imagingFCS (imFCS) measurements, developed in the group B040 (Prof. Jörg Langowski) at the German Cancer Research Center (DKFZ). Actually QuickFit 3 itself is a project manager and all functionality is added as plugins. A set of tested plugins for FCS, imagingFCS and some microscopy-related image processing tasks is supplied together with the software.

has function
Description

OligoMacro Toolset, is an ImageJ macro-toolset aimed at isolating oligodendrocytes from wide-field images, tracking isolated cells, characterizing processes morphology along time, outputting numerical data and plotting them. It takes benefit of ImageJ built-in functions to process images and extract data, and relies on the R software in order to generate graphs.

need a thumbnail
Description

Protein array is used to analyze protein expressions by screening simultaneously several protein-molecule interactions such as protein-protein and protein-DNA interactions. In most cases, the detection of interactions leads to an image containing numerous lines of spots that will be analyzed by comparing tables of intensity values. To describe the observed different patterns of expression, users generally show histograms with the original associated images [1]. The “Protein Array Analyzer” gives a friendly way to exploit this type of analysis, thus allowing quantification, image modeling and comparative analysis of patterns.

The Protein Array Analyzer, which was programmed in ImageJ’s macro language, is an extention of the Dot Blot Analyzer, [2], [3] a graphically interfaced tool that greatly simplifying analysis of dot arrays.

Description

Fiji plugin for detecting, tracking and quantifying filopodia

Description

CellProfiler Analyst (CPA) allows interactive exploration and analysis of data, particularly from high-throughput, image-based experiments. Included is a supervised machine learning system which can be trained to recognize complicated and subtle phenotypes, for automatic scoring of millions of cells. CPA provides tools for exploring and analyzing multidimensional data, particularly data from high-throughput, image-based experiments analyzed by its companion image analysis software, CellProfiler.

CPA
Description

The Binary Pattern Dictionary Learning (BPDL) package is suitable for image analysis on a set/sequence of images to determine an atlas of a compact region. In particular, the application can be maping gene activation accross many samples, brain activations in a time domain, etc.

Atlas
Description

ROI measurement plug-in for Icy.

has function
need a thumbnail
Description

This workflow describes a semi-automatic image segmentation procedure for 3D reconstructions of the coronary arterial tree, after which how different morphometric features are automatically extracted, including vessel lumen diameter of the three main coronaries.

Description

The macro generates orthogonal projections from bead images along the lateral and axial dimensions which are displayed using a customized look-up-table to color code intensities. A Gaussian curve is fit to the intensity profile of a fluorescent bead image and full-with-at-half-maximum (FWHM) values are extracted, and listed next to theoretical values for comparison. 

Description

NanoJ-SQUIRREL (Super-resolution Quantitative Image Rating and Reporting of Error Locations) is a software package designed for assessing and mapping errors and artefacts within super-resolution images. This is achieved through quantitative comparison with a reference image of the same structure (typically a widefield, TIRF or confocal image). SQUIRREL produces quantitative maps of image quality and resolution as well as global image quality metrics.

has function
SQUIRREL
Description

InspectJ is a free ImageJ/FIJI tool to inspect digital image integrity.

InspectJ_v2 is a newer version for advanced users. It applies additional features like histogram equalization and gamma correction for improved image inspections.

need a thumbnail
Description

AutoPilot is the open source project that hosts the general algorithm for fast and robust assessment of local image quality, an automated computational method for image-based mapping of the three-dimensional light-sheet geometry inside a fluorescently labeled biological specimen, and a general algorithm for data-driven optimization of the system state of light-sheet microscopes capable of multi-color imaging with multiple illumination and detection arms.

has function
Description

Maxima finding algorithm implemented in Python recreated from implementation in Fiji(ImageJ)

This is a re-implementation of the java plugin written by Michael Schmid and Wayne Rasband for ImageJ. The original java code source can be found in: https://imagej.nih.gov/ij/developer/source/ij/plugin/filter/MaximumFinder.java.html 

This implementation remains faithful to the original implementation but is not 100% optimised. The java version is faster but this could be alleviated by compiling c code for parts of the code. This script is simply to provide the functionality of the ImageJ find maxima algorithm to individuals writing pure python script.

The algorithm works as follows:

The first stage in the maxima finding algorithm is to find the local maxima. This involves processing the image with a 3x3 neighbourhood maximum filter. Once filtered this image is compared back to the original, where the pixels are the same value represents the locations of the local maxima. Typically there are far too many local maxima to be meaningful so the goal is then to merge and prune this maxima using some kind of measure of quality. In the case of algorithm a single parameter is used, the noise tolerance (Prominence). If a maxima is close to another then the maxima will be merged or removed based on the below criteria.

Starting with the brightest maxima and working down the intensities:

  • Expand out (‘flood fill’) from each maxima location. Neighbouring pixels within a noise tolerance (notl) of the maxima are scanned until the region within tolerance is exhausted.
    • If the pixels are equal to the maxima, mark this as equal.
    • If a greater maxima is met, ignore the active maxima.
    • If the pixels are less than maxima, but greater than maxima minus the noise tolerance, mark as listed.
    • Mark all ‘listed’ pixels 'processed' if they are included within a valid peak region, otherwise reset them.
    • From the regions containing a peak, calculate the best pixel to be considered as maxima based on minimum distance calculation with all those maxima considered equal.
       

For a video detailing how this algorithm works please see:

https://youtu.be/f9vXOMKOlaY

Or for examples of it being used in practise, please see:

https://youtu.be/9wvPsEzRWzI


find maxima comparison.
Description

This script includes a rough feature detection and then fine 2D Gaussian algorithm to fit Gaussians within detected regions. This macro is unique because the ImageJ/Fiji curve fitting API only supports 1-D curve. I get around this by linearising the equation. This implementation is for isotropic (spherical) or anistropic (longer in x/y) diagonally covariant Gaussians but not fully covariant Gaussians (anisotropic and rotated). 

Description

SimpleITK provides a simplified interface to ITK in a variety of languages. A user can either download pre-built binaries, if they are available for the desired platform and language, or SimpleITK can be built from the source code. Currently, Python binaries are available on Microsoft Windows, GNU Linux and Mac OS X. C# and Java binaries are available for Windows. We are also working towards supporting R packaging.

need a thumbnail
Description

Bisque (Bio-Image Semantic Query User Environment) : Store, visualize, organize and analyze images in the cloud. It also allow to run workflows using a set of deployed tools, such as CellProfiler, RootTipMultin Nuclear Tracker, Microtubule tracker etc...

Bisque was developed for the exchange and exploration of biological images.

The Bisque system supports several areas useful for imaging researchers from image capture to image analsysis and querying. The bisque system is centered around a database of images and metadata. Search and comparison of datasets by image data and content is supported. Novel semantic analyses are integrated into the system allowing high level semantic queries and comparison of image content.

  • Bisque is free and open-source
  • Flexible textual and graphical annotations
  • Cloud scalability: PBs of images, millions of annotations
  • Distributed storage: local, iRODS, S3
  • Integrated image analysis, high-throughput with Condor
  • Analysis in MATLAB, Python, Java+ImageJ
  • 100+ biological image formats
  • Very large 5D images (100+ GB)
has topic
bisque screenshot
Description

CaPTk is a software platform for analysis of radiographic cancer images, currently focusing on brain, breast, and lung cancer. CaPTk integrates advanced, validated tools performing various aspects of medical image analysis, that have been developed in the context of active clinical research studies and collaborations toward addressing real clinical needs. With emphasis given in its use as a very lightweight and efficient viewer, and with no prerequisites for substantial computational background, CaPTk aims to facilitate the swift translation of advanced computational algorithms into routine clinical quantification, analysis, decision making, and reporting workflow. Its long-term goal is providing widely used technology that leverages the value of advanced imaging analytics in cancer prediction, diagnosis and prognosis, as well as in better understanding the biological mechanisms of cancer development.

CaPTk
Description

Image analysis tools to be used within Galaxy

has function
Galaxy imaging workflow
Description
HyphaTrackerWorkflow
HyphaTracker Workflow

HyphaTracker propose a workflow for time-resolved analysis of conidia germination. Each part of this workflow can also be used independnatly , as a toolbox. It has been tested on bright-field microscopic images of conidial germination. Its purpose is mainly to identify the germlings and to remove crossing hyphae, and measure the dynamics of their growth.

hyphatracker
Description

Kymograph generation under ImageJ:

one simple solution, plot a line (ROI line) on the first frame, where you want to generate the kymograph.

Use

Image  / Stacks  / Reslice

It will generate a new image were Y dimension is the time, and X the position on the line you have drawn.

need a thumbnail
Description

The MIPAV (Medical Image Processing, Analysis, and Visualization) application enables quantitative analysis and visualization of medical images of numerous modalities such as PET, MRI, CT, or microscopy. Using MIPAV's standard user-interface and analysis tools, researchers at remote sites (via the internet) can easily share research data and analyses, thereby enhancing their ability to research, diagnose, monitor, and treat medical disorders.

Description

A software toolkit for computational morphometry of biomedical images, CMTK comprises a set of command line tools and a back-end general-purpose library for processing and I/O.

The command line tools primarily provide the following functionality: registration (affine and nonrigid; single and multi-channel; pairwise and groupwise), image correction (MR bias field estimation; interleaved image artifact correction; EPI unwarping), processing (filters; combination of segmentations via voting and STAPLE; shape-based averaging), statistics (t-tests; general linear model).

null
Description

Software for analysis, visualization, simulation, and acquisition  of data from spectroscopy and fluorescence microscopy.

  • Fluorescence Correlation Spectroscopy (FCS)
  • Fluorescence Lifetime Imaging (FLIM) and Phasor plots
  • Förster Resonance Energy Transfer (FRET)
  • Generalized Polarization (GP) and Spectral Phasors
  • Number and Brightness (N&B)
  • Photon Counting Histogram (PCH)
  • Raster and Spatio-temporal Image Correlation Spectroscopy (RICS and STICS)
  • Single Particle and Modulation Tracking (SPT, MT)
  • Image Mean Square Displacement (iMSD)
  • Pair correlation function (pCF)
has function
Description

EBImage provides general purpose functionality for image processing and analysis. In the context of (high-throughput) microscopy-based cellular assays, EBImage offers tools to segment cells and extract quantitative cellular descriptors. This allows the automation of such tasks using the R programming language and facilitates the use of other tools in the R environment for signal processing, statistical modeling, machine learning and visualization with image data.

EBImage is available through the Bioconductor software project (www.bioconductor.org). Strengths Lightweight Suitable for automated, scripted analyses All functions are documented with examples Modular links to R and Bioconductor software, notably imageHTS and cellHTS2 Community support via the Bioconductor mailing list Reproducible (image) analysis using the Sweave report-writing system

EBImage
Description

Measures wound-healing assay videos, 

 For each video, the velocity and the order parameter are analyzed in time and space to extract quantitative parameters characterizing the cell motility phenotype. The different conditions (videos) can then be classified according to these parameters.

AveMAP
Description

WND-CHARM is a multi-purpose image classifier that can be applied to a wide variety of image classification tasks without modifications or fine-tuning, and yet provides classification accuracy comparable to state-of-the-art task-specific image classifiers. WND-CHARM can extract up to ~3,000 generic image descriptors (features) including polynomial decompositions, high contrast features, pixel statistics, and textures. These features are derived from the raw image, transforms of the image, and compound transforms of the image (transforms of transforms). The features are filtered and weighted depending on their effectiveness in discriminating between a set of predefined image classes (the training set). These features are then used to classify test images based on their similarity to the training classes. This classifier was tested on a wide variety of imaging problems including biological and medical image classification using several imaging modalities, face recognition, and other pattern recognition tasks. WND-CHARM is an acronym that stands for "Weighted Neighbor Distance using Compound Hierarchy of Algorithms Representing Morphology."

Generated features
Description

SOAX is an open source software tool to extract the centerlines, junctions and filament lengths of biopolymer networks in 2D and 3D images. It facilitates quantitative, reproducible and objective analysis of the image data. The underlying method of SOAX uses multiple Stretching Open Active Contours (SOACs) that are automatically initialized at image intensity ridges and then stretch along the centerlines of filaments in the network. SOACs can merge, stop at junctions, and reconfigure with others to allow smooth crossing at junctions of filaments.

SOAX provides 3D visualization for exploring image data and visually checking results against the image. Quantitative analysis functions based on extracted networks are also implemented in SOAX, including spatial distribution, orientation, and curvature of filamentous structures. SOAX also provides interactive manual editing to further improve the extraction results, which can be saved in a file for archiving or further analysis. Useful for microtubules or actin filaments.

Observation: Depending on the operating system, the installation may or may not require Boost C++, ITK and VTK libraries. Windows has a standalone executable application without the need of those. 

snapshot microtubules soax
Description

BioImageXD is a free open source software package for analyzing, processing and visualizing multi-dimensional microscopy images. It's a collaborative project, designed and developed by microscopists, cell biologists and software engineers from the Universities of Jyväskylä and Turku in Finland, Max Planck Institute CBG in Dresden, Germany and collaborators worldwide. BioImageXD was published in the July 2012 issue of Nature Methods.

Screen capture of BioImageXD
Description

Advanced Cell Classifier is a data analyzer program to evaluate cell-based high-content screens and tissue section images developed at the Biological Research Centre, Szeged and FIMM, Helsinki (formerly at ETH Zurich). The basic aim is to provide a very accurate analysis with minimal user interaction using advanced machine learning methods.

Advanced Cell Classifier
Description

The ImageJFX Project aims to create a new user interface for the software ImageJ in order to ease scientific image analysis. While keeping the core components of ImageJ, ImageJFX brings scientists closer to their goal by making the interface clearer for beginners and more practical for advanced users.

ImageJFX screen Capture
Description

SIMcheck is an ImageJ plugin suite for assessing the quality and reliability of Structured Illumination Microscopy (SIM) data. The quality of the raw data, the quality of the reconstruction and the calibration of the microscope can be tested. 

has function
Simcheck screenschot
Description

The jicbioimage Python package makes it easy to explore microscopy data in a programmatic fashion (python).

Exploring images via coding means that the exploratory work becomes recorded and reproducible.

Furthermore, it makes it easier to convert the exploratory work into (semi) automated analysis work flows.

Features:

  • Built in functionality for working with microscopy data
  • Automatic generation of audit trails
  • Python integration Works with Python 2.7, 3.3 and 3.4
Description

arivis Vision4D is a modular software for working with multi-channel 2D, 3D and 4D images of almost unlimited size independent of available RAM. Many imaging systems, such as high speed confocal, Light Sheet/ SPIM and 2 Photon systems, can produce a huge amount of multi-channel data, which arivis Vision4D handles without constraints. Terabyte ready arivis Vision4D main functionality: Easy import of most image formats from microsopes as well as biological formats High performance interactive 3D / 4D rendering on standard PCs and laptops with 3D Graphics Support Intuitive tools for stitching and alignment to create large multi-dimensional image stacks Immediate 2D, 3D and 4D visualization, annotation and analysis regardless of image size Creation, import, and export of 4D Iso-surfaces Powerful Analysis Pipeline for 3D /4D image analysis (cell segmentation, tracking, annotation, quantitative measurement and statistics, etc) Semi-automatic/manual segmentation and tracking with interactive Track Editor Easy design and export of 3D / 4D High Resolution Movies Seamless integration of custom workflows via Matlab API and Python scripting Data sharing for collaboration A user friendly software, easy to learn and use for any life scientist

need a thumbnail
Description

ThunderSTORM is an open-source, interactive, and modular plug-in for ImageJ designed for automated processing, analysis, and visualization of data acquired by single molecule localization microscopy methods such as PALM and STORM. Our philosophy in developing ThunderSTORM has been to offer an extensive collection of processing and post-processing methods so that users can easily adapt the process of analysis to their data.

need a thumbnail
Description

Calculate the Fourier ring correlation (FRC). The FRC can be used as a resolution criterion for super resolution microscopy. The Plugin can display a plot of the FRC curve, along with the LOESS smoothed version of the curve. Finally it displays the threshold method used and the intersection of the FRC with the threshold, providing the FIRE number. It can be used on two open images or on pairs of images in batch mode. 2654 2655

need a thumbnail
Description

Quote:

The "Angiogenesis Analyzer" allows analysis of cellular networks. Typically, it can detect and analyze the pseudo vascular organization of endothelial cells cultured in gel medium

...a simple tool to quantify the ETFA (Endothelial Tube Formation Assay) experiment images by extracting characteristic information of the network.

The outputs are network feature parameters.

Sample images

http://image.bio.methods.free.fr/ij/ijmacro/Angiogenesis/HUVEC-Pseudo-Phase-Contrast.tif.zip

http://image.bio.methods.free.fr/ij/ijmacro/Angiogenesis/HUVEC-Fluo.tif.zip

Source code

https://imagej.nih.gov/ij/macros/toolsets/Angiogenesis%20Analyzer.txt

has topic
has function
Description

## About TANGO software is an open-source software for Analysis of Nuclear Genome Organization. It is composed of an ImageJ plugin for batch processing and analysis, and a R package for statistical analysis. Reference: 2528 ## Some key features - Image import uses bioimage formats. - Construction of workflow in GUI by choosing filters / segmentation strategy for - Prefiltering - Segmentation - Postfiltering - Isolated nuclei could individually be inspected, deleted from list and subjected for detailed analysis. - Uses MCIB3D library as backend. - Basic usage is to segment nucleus, crop them to single nucleus objects, segment substructures within objects and measure their properties. - Optionally R can be connected to do detailed analysis of results. - Uses MongoDB to manage huge data set.

need a thumbnail
Description

Implementation of some image correlation spectroscopy tools

need a thumbnail
Description

An easy to use, image analysis software package that enables rapid exploration and interpretation of microscopy data.

PhenoBrowser
Description

A commercial image analysis software. It's interface allows to easily perform measurements and image analysis. Your actions can be recorded and a macro (in a basic script language) can then be created. Almost no knowledge in programming is needed. You can also use python. A SDK is also available to develop stand alone applications in c++. Additional modules allow to use specific operations (3D operators... Examples of available categories of operators : filtering, edge detection, mathematical morphology, segmentation, Frequency operations, mathematical/logical operations, measurements...

need a thumbnail
Description

IMOD is a set of image processing, modeling and display programs used for tomographic reconstruction and for 3D reconstruction of EM serial sections and optical sections. The package contains tools for assembling and aligning data within multiple types and sizes of image stacks, viewing 3-D data from any orientation, and modeling and display of the image files.

Included are two programs with graphical interface: 3dmod, for displaying and segmenting 2D images and 3D volumes; etomo, for reconstructing tomographic volumes from tilt series of images.

Processing can be distributed on multiple cores and executed in batch mode.

iMod

ITK

Description

ITK is an open-source, cross-platform system that provides developers with an extensive suite of software tools for image analysis.

Developed through extreme programming methodologies, ITK employs leading-edge algorithms for registering and segmenting multidimensional data. It is widely used and contributed in the medical imaging field.

Strengths

Highly optimized C++, well commented Consistently updated (new) algorithms many tools and softwares are built upon it connected with VTK Insight Journal (open code and sample data) Extensive list of examples & tutorials

Limitations

yet detached from the bioimage analysis world hard to use for end users without development skills

itk
Description

not available anymore in version 3.0 and up?

has function
need a thumbnail
Description

Plugins for 3D Image processing and Analyisis in ImageJ. Previously (?) known as 3D ImageJ Suite.

need a thumbnail
Description

This segmentation method performs a N-class thresholding based on a K-Means classification of the image histogram, then extracts objects in a bottom-up manner using user-defined minimum and maximum object sizes. Very useful to detect clustered objects in fluorescence microscopy.

need a thumbnail
Description

Plots an intensity profile of a given ROI.

Can plot mean over T or/and Z too.

has topic
has function
need a thumbnail
Description

The SSIM is an index measuring the structural similarity between two images. It is valued between -1 and 1. When two images are nearly identical, their SSIM is close to 1.

need a thumbnail
Description

The aim of this plugin is to characterise the orientation and isotropy properties of a region of interest (ROI) in an image, based on the evaluation of the gradient structure tensor in a local neighborhood. 

has topic
Description

When opening the Pannoramic Viewer you see all of your virtual slides in thumbnail view. Selecting one (or up to 10 at a time) the slide gets under the virtual objective of the virtual microscope. Here you can move and change the magnification of the slide quickly and easily using the mouse. Emphasizing 'quickly' is important considering the fact that the size of an average virtual slide can easily be more than 1 GB.


Main characteristics:

  • Seamless zooming and moving of the virtual slide
  • Bookmarking (annotating) on the spot, i.e. defining the specific part of the sample by drawing; finding and reading of previously made bookmarks
  • Easy and precise measurements
  • Real-time changing of brightness, contrast and color bias
  • Fluorescent slide handling, separate channel view & pseudo-colorization
  • Slide uploading and downloading for teleconsultation
  • Synchronized viewing (moving and zooming) of multiple slides for comparison purposes
  • Publication quality image capture of displayed areas (.JPG, .BMP, .TIFF)
  • TIFF, MIRAX slide and Meta-XML export for Carl Zeiss AxioVision™ compatibility
  • Scanmap export for rescanning existing digital slides
  • Easily expandable functionality via the software modules
Description

A fork of PIL python package, with small collection of image import/export and image processing modules. See [Reference Documentation](http://pillow.readthedocs.org/en/latest/reference/index.html) for more details. Though this package mostly works in any platform, some of them are limited to Windows. This package is a part of [pythonxy](https://code.google.com/p/pythonxy/).

need a thumbnail
Description

DensitoQuant is a simple and fast, yet effective tool for IHC measurements. It measures the density of immunostain on the digital slides by distributing pixels to negative and 3 grades of positive classes by their RGB values. DensitoQuant is especially suitable for quick TMA evaluation. Analyzing a whole digital slide takes only a couple of minutes.

Description

This plugin provides some useful functions to work with complex-valued sequences.

It provides the base operation to deal with complex-valued sequences, such as real-part, imaginary-part, modulus and argument extraction, and conversion between Cartesian and polar representation.

has function
need a thumbnail
Description

A toolbox to chain image analysis processes.

has function
need a thumbnail