Visualisation

Re-occurs among biii.info tags (visualisation, rendering, viewer, classification, ...)

Synonyms
Plotting
Description

VTK is an open-source software system for image processing, 3D graphics, volume rendering and visualization. VTK includes many advanced algorithms (e.g., surface reconstruction, implicit modeling, decimation) and rendering techniques (e.g., hardware-accelerated volume rendering, LOD control).

VTK is used by academicians for teaching and research; by government research institutions such as Los Alamos National Lab in the US or CINECA in Italy; and by many commercial firms who use VTK to build or extend products.

The origin of VTK is with the textbook "The Visualization Toolkit, an Object-Oriented Approach to 3D Graphics" originally published by Prentice Hall and now published by Kitware, Inc. (Third Edition ISBN 1-930934-07-6). VTK has grown (since its initial release in 1994) to a world-wide user base in the commercial, academic, and research communities.

Description

TissUUmaps is a browser-based tool for fast visualization and exploration of millions of data points overlaying a tissue sample. TissUUmaps can be used as a web service or locally in your computer, and allows users to share regions of interest and local statistics.

Description

ELEPHANT is a platform for 3D cell tracking, based on incremental and interactive deep learning.
It implements a client-server architecture. The server is built as a web application that serves deep learning-based algorithms. The client application is implemented by extending Mastodon, providing a user interface for annotation, proofreading and visualization.

from https://elephant-track.github.io/#/v0.5/?id=_5-proofreading
Description

Fractal is a framework to process high-content imaging data at scale and prepare it for interactive visualization. Fractal provides distributed workflows that convert TBs of image data into OME-Zarr files. The platform then processes the 3D image data by applying tasks like illumination correction, maximum intensity projection, 3D segmentation using cellpose and measurements using napari workflows. The pyramidal OME-Zarr files enable interactive visualization in the napari viewer.

need a thumbnail
Description


Relate is a correlative software package optimised to work with EM, EDS, EBSD, & AFM data and images.  It provides the tools you need to correlate data from different microscopes, visualise multi-layered data in 2D and 3D, and conduct correlative analyses.

  • Combining data from different imaging modalities (e.g. AFM, EDS & EBSD)

  • Interactive display of multi-layer correlated data

  • Analytical tools for metadata interrogation

  • Documented workflows and processes

Correlate

  • Import data from AZtec using the H5oina file format
  • Import AFM data
  • Correlate both sets of data using intuitive image overlays and image matching tools
  • Produce combined multimodal datasets

Visualise

  • 2D display of multi-layered data
  • 3D visualisation of topography combined with AFM material properties, EM images, and EDS & EBSD map overlays
  • Customisation of colour palettes, data overlays, image rendering options, and document display
  • Export images and animations

Analyse

  • Generate profile (cross section) views of multimodal data
  • Measure and quantify data across multiple layers
  • Analyse areas via data thresholding using amount of x-ray counts, phase maps, height, or other material properties.
  • Select an extensive range of measurement parameters
  • Export analytical data to text or CSV files
Relate analysis workflow example
Description

SMLM is a mature but still growing field, which still lacks efficient and user-friendly analysis and visualization software platform adapted for both users and developers. We here introduce PoCA, a powerful open-source software platform dedicated to the visualization and analysis of 2D and 3D point-cloud data. PoCA allows manipulating large datasets, and integrates a plugin architecture, a native batch analysis engine and a Python code interpreter, facilitating both the analysis of data and the integration of new methods.

Visualization, segmentation and exploration of 3D SMLM data
Description

Correlia is an open-source ImageJ/FIJI plug-in for the registration of 2D multi-modal microscopy data-sets. The software is developed at ProVIS - Centre for Correlative Microscopy and is specifically designed for the needs of chemical microscopy involving various micrographs as well as chemical maps at different resolutions and field-of-views.

Correlia
Description

ClearMap is a toolbox for the analysis and registration of volumetric data from cleared tissues.

It was initially developed to map brain activity at cellular resolution in whole mouse brains using immediate early gene expression. It has since then been extended as a tool for the qunatification of whole mouse brain vascualtur networks at capilary resolution.

It is composed of sevral specialized modules or scripts: tubemap, cellmap, WobblyStitcher.

ClearMap has been designed to analyze O(TB) 3d datasets obtained via light sheet microscopy from iDISCO+ cleared tissue samples immunolabeled for proteins. The ClearMap tools may also be useful for data obtained with other types of microscopes, types of markers, clearing techniques, as well as other species, organs, or samples.

ClearMap SCreenshot
Description

A collection of Java tools and HTTP services (APIs) for rendering transformed image tiles that includes:

The basic concept is to render images (tiles) based on transformation files, without having to store the big generated image from an alignment of tiles (mosaicking).

Description

Phindr3D is a comprehensive shallow-learning framework for automated quantitative phenotyping of three-dimensional (3D) high content screening image data using unsupervised data-driven voxel-based feature learning, which enables computationally facile classification, clustering and data visualization.

Please see our GitHub page and the original publication for details.

Viv

Description

Viv is a JavaScript library providing utilities for rendering primary imaging data. Viv supports WebGL-based multi-channel rendering of both pyramidal and non-pyramidal images. The rendering components of Viv are provided as Deck.gl layers, facilitating image composition with existing layers and updating rendering properties within a reactive paradigm.

Rendering a pyramidal, multiplexed immunofluorescence OME-TIFF image of a human kidney using additive blending to render four image channels into a single RGB image in the client.
Description

KNIME workflow to visualize a dataset described by multiple quantitative features (ex: a list of samples or cells, each described with multiple morphological features) as a 3D cloud of points (each point corresponding to one sample/cell) as well as a line plot (1 line per sample/cell).

For the 3D plot, the workflow uses Principal Component Analysis (PCA) for dimensionality reduction, ie it simplifies the information for each sample from n-features to 3 pseudo-features which are used as x,y,z-coordinates for each sample. The original features should cover similar value range, to make sure the PCA is not biased towards the large values features. One option is to normalize the values (min/max or Z-score). 

Also make sure that the resulting PCA represents a decent % of the original data variance (at least 70%). Otherwise the PCA plot will not be representative of the original data-distribution. The % is shown in the title of the PCA plot.

The workflow is interactive and so selecting in one panel of the figure will highlight in the other panel too.

It was originally published for the visualization of phenotypic kidney features in zebrafish, but the workflow is generic by design and can be reused for any quantitative feature set. 

KNIME-Workflow
Description

MoBIE (Multimodal Big Image Data Exploration) is a framework for sharing and interactive browsing of multimodal big image data. The MoBIE Fiji viewer is based on BigDataViewer and enables browsing of MoBIE datasets. 

It is also called Platybrowser, and uses the n5 format.

Mobie
Description

The Morphonet Python API provide an easy interface to interact directly with the MorphoNet server. Very useful to upload, download your dataset and superimpose on it any quantitative and quantitative informations.

Description

MorphoNet is a novel concept of web-based morphodynamic browser to visualise and interact with complex datasets, with applications in research and teaching. 

MorphoNet offers a comprehensive palette of interactions to explore the structure, dynamics and variability of biological shapes and its connection to genetic expressions. 

By handling a broad range of natural or simulated morphological data, it fills a gap which has until now limited the quantitative understanding of morphodynamics and its genetic underpinnings by contributing to the creation of ever-growing morphological atlases.

Description

Summary

napari is a fast, interactive, multi-dimensional image viewer for Python. It’s designed for browsing, annotating, and analyzing large multi-dimensional images. It’s built on top of Qt (for the GUI), vispy (for performant GPU-based rendering), and the scientific Python stack (e.g. numpyscipy). It includes critical viewer features out-of-the-box, such as support for large multi-dimensional data, and layering and annotation. By integrating closely with the Python ecosystem, napari can be easily coupled to leading machine learning and image analysis tools (e.g. scikit-imagescikit-learnTensorFlowPyTorch), enabling more user-friendly automated analysis.

Installation

  • The installation procedure for Silicon Mac (M1 Processor, arm64 ) requires some tricks. As of Oct 2021, this procedure by Peter Sobolewski works but:
    • For installing pyqt5, use a slightly different command `brew install PyQt@5` to install PyQt5.  


Description

Wolfram Mathematica (usually termed Mathematica) is a modern technical computing system spanning most areas of technical computing — including neural networksmachine learningimage processinggeometrydata sciencevisualizations, and others. The system is used in many technical, scientific, engineering, mathematical, and computing fields.

Description

Dragonfly is a software platform for the intuitive inspection of multi-scale multi-modality image data. Its user-friendly experience translates into powerful quantitative findings with high-impact visuals, driven by nuanced easy-to-learn controls.

For segmentation: It provides an engine fior machine Learning, Watershed and superpixel methods, support histological data .

It offers a 3D viewer, and python scripting capacities .

It is free for reserach use, but not for commercial usage.

DragonFly
Description

Web based viewer developped for google for very big data: 

Neuroglancer is a WebGL-based viewer for volumetric data. It is capable of displaying arbitrary (non axis-aligned) cross-sectional views of volumetric data, as well as 3-D meshes and line-segment based models (skeletons). The segmentation has to be done before loading the dataset, it is not done Inside the viewer.

This is not an official Google product.

It has among other the nice feature of beeing able to generate url for sharing a specific view.

Note that the only supported browser for now are 

  • Chrome >= 51
  • Firefox >= 46


Neuroglancer
Description

FPBioimage is a volumetric visualization tool which runs in all modern web browsers. Try the tool yourself at our example site here.

has function
Description

The PYthon Microscopy Environment is an open-source package providing image acquisition and data analysis functionality for a number of microscopy applications, but with a particular emphasis on single molecule localisation microscopy (PALM/STORM/PAINT etc ...). The package is multi platform, running on Windows, Linux, and OSX.

It comes with 3 main modules:

  • PYMEAcquire - Instrument control and simulation
  • dh5view - Image Data Analysis and Viewing
  • VisGUI - Visualising Localization Data Sets

Visualization of 3D images with Matlab

Submitted by Perrine on Mon, 04/08/2019 - 13:58

In this session we will use a 3D multichannel reconstruction of zebrafish larva to explore the visualization capabilities of Matlab. We will start from extracting and inspecting single slices and will continue with combining multiple channels, finally generating a surface rendering for visual colocalization analysis.During the process we will review methods for manipulating multidimensional arrays, including resizing, reshaping and conditional selection.

Description

CellProfiler Analyst (CPA) allows interactive exploration and analysis of data, particularly from high-throughput, image-based experiments. Included is a supervised machine learning system which can be trained to recognize complicated and subtle phenotypes, for automatic scoring of millions of cells. CPA provides tools for exploring and analyzing multidimensional data, particularly data from high-throughput, image-based experiments analyzed by its companion image analysis software, CellProfiler.

CPA
Description

The Image Data Explorer is a Shiny app that allows the interactive visualization of images and ROIs associated with data points shown in a scatter plot. It is useful for exploring the relationships between images/ROIs and associated data represented in tabular format. Additional functionalities include data annotation, dimensionality reduction and classification and feature selection.

has function
Description

This suite provides plugins to enhance 3D capabilities of ImageJ.

  • 3D Filters (mean, median, max, min, tophat, max local, …) and edge and symmetry filter
  • 3D Segmentation (iterative thresholding, spots segmentation, watershed, …)
    • 3D hysteresis thresholding with two thresholds (see 2D hysteresis for explanation).
    • 3D simple segmentation with thresholding to label 3D objects (similar to 3D objects counter).
    • 3D iterative thresholding (find optimal threshold for each object).
    • 3D spot segmentation with various local threshold estimations.
    • 3D Maxima Finder (with noise parameter)
    • 3D seeds-based watershed with automatic local maxima detection for seeds.
  • 3D Mathematical Morphology tools (fill holes, binary closing, distance map, …)
  • 3D RoiManager (3D display and analysis of 3D objects)
  • 3D Analysis (Geometrical measurements, Mesh measurements, Convex hull, …)
    • 3D Geometrical measurements (volume, surface, …) for each labelled object.
    • 3D Centroid, to compute centroids of labelled objects.
    • 3D Intensity measurements (mean, integrated density, …) in a opened image for each labelled object.
    • 3D Shape measurements (compactness, elongation, …) for each labelled object.
    • 3D Mesh Measurements after triangulation (see 3D Viewer for surface mesh computation).
    • 3D fitting by an ellipsoid and main direction computation (details here).
    • 3D convex hull (see http://rsbweb.nih.gov/ij/plugins/3d-convex-hull/index.html).
    • 3D Radial Distance Area Ratio (RDAR)
    • 3D Density, to compute density of dots, based on closest distance analysis (details here).
  • 3D MereoTopology (Relationship between objects)
  • 3D Tools (Drawing ellipsoids and lines, cropping, …)
    • Drawing 3D line
    • Drawing 3D ellipsoids in any direction
    • Drawing in stacks as volumes
    • Drawing in 3D viewer as surfaces
need a thumbnail
Description

Spimagine is a python package to interactively visualize and process time lapsed volumetric data as generated with modern light sheet microscopes (hence the Spim part). The package provides a generic 3D+t data viewer and makes use of GPU acceleration via OpenCL. If provides further an image processor interface for the GPU accelerated denoising and deconvolution methods of gputools.

It is only for display (no analysis). The only drawback: it does not handle multichannel time lapse 3D data (only one channel at a time).

has function
Spimagine
Description

It is an interactive front-end visualization for registration software based on Elasix (VTK/ITK)

has topic
need a thumbnail
Description

"The Microscope Image Analysis Toolbox MiToBo is an extension for the widely used image processing application ImageJ and its new release ImageJ 2.0.
MiToBo ships with a set of operators ready to be used as plugins in ImageJ. They focus on the analysis of biomedical images acquired by various types of microscopes."

Description

shinyHTM is an open source, web-based tool for data exploration, image visualization and normalization of High Throughput Microscopy data. Within shinyHTM the user is guided through a linear workflow which follows the following best practices:

  • Inspect the numerical data through plotting
  • Measurements are linked to raw images
  • Perform quality control to exclude images with aberrations or where image analysis failed
  • Perform a reproducible data analysis
  • Normalize data and report statistical significance

Image visualization relies on Fiji/ImageJ, along with its wealth of analytical tools.

shinyHTM can be used to analyze image features obtained with CellProfiler, ImageJ or any other bioimage analysis software. The output of analysis is a publication-ready scoring of the data.

shinyHTM is based on the R shiny package.

shinyHTM
Description

The Topology ToolKit (TTK) is an open-source library and software collection for topological data analysis in scientific visualization.

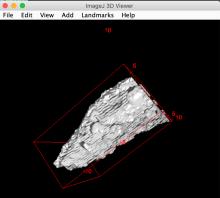
TTK can handle scalar data defined either on regular grids or triangulations, either in 2D or in 3D. It provides a substantial collection of generic, efficient and robust implementations of key algorithms in topological data analysis. It includes:
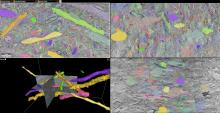
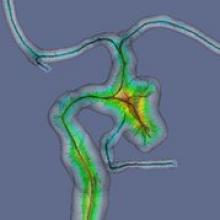
 · For scalar data: critical points, integral lines, persistence diagrams, persistence curves, merge trees, contour trees, Morse-Smale complexes, topological simplification;
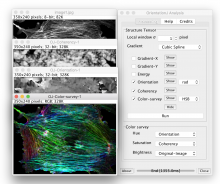
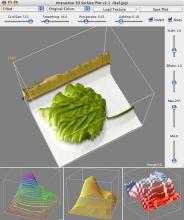
 · For bivariate scalar data: fibers, fiber surfaces, continuous scatterplots, Jacobi sets, Reeb spaces;
 · For uncertain scalar data: mandatory critical points;
 · For time-varying scalar data: critical point tracking;
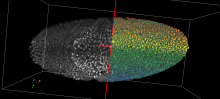
 · For high-dimensional / point cloud data: dimension reduction;
 · and more!


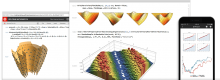
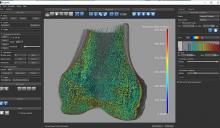
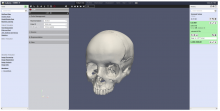
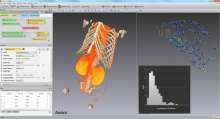
TTK makes topological data analysis accessible to end users thanks to easy-to-use plugins for the visualization front end ParaView. Thanks to ParaView, TTK supports a variety of input data formats.
 

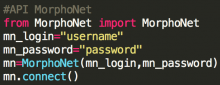
TTK is written in C++ but comes with a variety of bindings (VTK/C++, Python) and standalone command-line programs. It is modular and easy to extend. We have specifically developed it such that you can easily write your own data analysis tools as TTK modules.

has topic
ttk
Description

ParaView is an open-source, multi-platform data analysis and visualization application. ParaView users can quickly build visualizations to analyze their data using qualitative and quantitative techniques. The data exploration can be done interactively in 3D or programmatically using ParaView’s batch processing capabilities.

ParaView was developed to analyze extremely large datasets using distributed memory computing resources. It can be run on supercomputers to analyze datasets of petascale size as well as on laptops for smaller data, has become an integral tool in many national laboratories, universities and industry, and has won several awards related to high performance computation.

paraviewbloodcells
Description

Python is a programming language.

Python 2.7.0 was released on July 3rd, 2010.

Python 2.7 is scheduled to be the last major version in the 2.x series before it moves into an extended maintenance period. This release contains many of the features that were first released in Python 3.1.

 A bugfix release, 2.7.16, is currently available. Its use is recommended.

need a thumbnail
Description

Matplotlib is a comprehensive library for creating static, animated, and interactive visualizations in Python.

need a thumbnail
Description

This note presents the design of a scalable software package named ImagePy for analysing biological images. Our contribution is concentrated on facilitating extensibility and interoperability of the software through decoupling the data model from the user interface. Especially with assistance from the Python ecosystem, this software framework makes modern computer algorithms easier to be applied in bioimage analysis.

Description

This ParaViewWeb Docker container is used by the Galaxy Project.  Paraview is an VTK based visualization server, for 3D.

ParaViewWeb in Galaxy
Description

Drishti (from Sanskrit  word for "vision" or "insight") is a multi-platform, open-source volume-exploration and presentation tool. Written for visualizing tomography data, electron-microscopy data and the like.

Drishti
Description

An R package for the (3D) visualisation and analysis of biological image data, especially tracings of single neurons. nat is the core package of a wider suite of neuroanatomy tools introduced at http://jefferislab.github.io.

has function
Description

vmtk is a collection of libraries and tools for 3D reconstruction, geometric analysis, mesh generation and surface data analysis for image-based modeling of blood vessels.

vmtk is composed of

  • C++ classes (VTK and ITK -based algorithms)
  • Python classes (high-level functionality - each class is a script)
  • PypeS - Python pipeable scripts, a framework which enables vmtk scripts to interact with each other


Description

Facade API on top of JOGL (http://jogamp.org/jogl/www/) offering a simple interface for creating OpenGL contexts/windows, GLSL shader programs, and textures. Use it in your favourite JVM-based language.

has function
Description

scenery is a scenegraphing and rendering library. It allows you to quickly create high-quality 3D visualisations based on mesh data. scenery contains both a OpenGL 4.1 and Vulkan renderer. The rendering pipelines of both renderers are configurable using YAML files, so it's easy to switch between e.g. Forward Shading and Deferred Shading, as well as stereo rendering. Rendering pipelines can be switched on-the-fly.

Both renderers support rendering to head-mounted VR goggles like the HTC Vive or Oculus Rift via OpenVR/SteamVR.

has function
Description

The Multiview Reconstruction software package enables users to register, fuse, deconvolve and view multiview microscopy images. The software is designed for lightsheet fluorescence microscopy (LSFM), but is applicable to any form of three or higher dimensional imaging modalities like confocal timeseries or multicolor stacks. 

need a thumbnail
Description

The BigDataViewer is a re-slicing browser for terabyte-sized multi-view image sequences. BigDataViewer was developed with multi-view light-sheet microscopy data in mind and integrates well with Fiji's SPIMage processing pipeline.

Description

The BigStitcher is a software package that allows simple and efficient alignment of multi-tile and multi-angle image datasets, for example acquired by lightsheet, widefield or confocal microscopes. The software supports images of almost arbitrary size ranging from very small images up to volumes in the range of many terabytes, which are for example produced when acquiring cleared tissue samples with lightsheet microscopy.

Description

Microscopy Image Browser (MIB) is a high-performance Matlab-based software package for advanced image processing, segmentation and visualization of multi-dimensional (2D-4D) light and electron microscopy datasets.

MIB is a freely available, user-friendly software for effective image processing of multidimensional datasets that improves and facilitates the full utilization of acquired data and enables quantitative analysis of morphological features. Its open-source environment enables fine tuning and possibility of adding new plug-ins to customize the program for specific needs of any research project.

MIB
Description

This plugin achieves easy creation of image figures for publications, reports, projects.

  • Easy-to-design interactive figure layout.

  • Visually assign image content to panels.

  • High-quality image scaling and rotation.

  • Easy and consistent panel labels and scale bars.

  • Each panel has it's original datasource's properties and tracks achieved image processing.

  • Save and re-open editable figures.

  • Export as standard image formats with textual description of each panel history.

Compared to Make montage, the plugin adds more flexibility to montage creation: Easy-to-design interactive figure layout. Visually assign image content to panels. High-quality image scaling and rotation. Easy and consistent panel labels and scale bars. Each panel has it's original data source's properties and tracks achieved image processing. Save and re-open editable figures. Export as standard image formats with textual description of each panel history. 

has topic
has function
FigureJ
Description

Vaa3D is a handy, fast, and versatile 3D/4D/5D Image Visualization and Analysis System for Bioimages and Surface Objects. It also provides many unique functions that you may not find in other software. It is Open Source, and supports a very simple and powerful plugin interface and thus can be extended and enhanced easily.

Vaa3D is cross-platform (Mac, Linux, and Windows). This software suite is powerful for visualizing large- or massive-scale (giga-voxels and even tera-voxels) 3D image stacks and various surface data. Vaa3D is also a container of powerful modules for 3D image analysis (cell segmentation, neuron tracing, brain registration, annotation, quantitative measurement and statistics, etc) and data management. This makes Vaa3D suitable for various bioimage informatics applications, and a nice platform to develop new 3D image analysis algorithms for high-throughput processing. In short, Vaa3D streamlines the workflow of visualization-assisted analysis.

Vaa3D can render 5D (spatial-temporal) data directly in 3D volume-rendering mode; it supports convenient and interactive local and global 3D views at different scales... it comes with a number of plugins and toolboxes. Importantly, you can now write your own plugins to take advantage of the Vaa3D platform, possibly within minutes!


Vaa3D_logo
Description

WormGUIDES Atlas is an interactive 4D portrayal of neural development in C. elegans. It will ultimately contain nuclear positions for every cell in the embryo, identified and tracked from the 2 cell stage until hatching. Single-cell and subcellular information, including neural outgrowth dynamics for each cell as well as cell function, gene expression, the adult neural connectome and related literature will be collated for each cell from public sources and also integrated with the atlas model. WormGUIDES Atlas integrates tools for exploratory data analyses and insight sharing. Navigation is linked between 3D and lineage tree views. In both contexts, community single cell information can be accessed with a click, creating live web queries that summarize knowledge about a cell. In many cases this information can be used to control cell color, creating customized interactive visualizations. A user's insights can be annotated directly into the embryo model with a note-taking interface that attaches each annotation to a cell or other point in space and time. These multi-dimensionally located notes can then be ordered into a (chrono)logical story sequence that explains developmental events as they unfold in the embryo. Annotations can be saved and shared with collaborators or the community.

WormGuides screenshot
Description

QuantCenter is the framework for 3DHISTECH image analysis applications. with the goal of helping the pathologists to diagnose in an easier way. QuantCenter, is optimized for whole slide quantification. It has a linkable algorithm concept that tries to provide an easy-to-use and logical workflow. The user has different quantification modules that he or she could link one after other to fine-tune or to speed up the analysis.

QuantCenter logo
Description

Image-processing algorithms developed at the MOSAIC Group for fluorescence microscopy. Tools included:

  • 2D/3D single-particle tracking tool which can be used to track bright spots in 2D/3D movies over time.
  • Optimal filament segmentation of 2D images. 
  • Curvature filters for image filtering, denoising, and restoration. 
  • Image naturalization for image enhancement based on gradient statistics of natural-scence images. 
  • Tool for automatically send and distribute jobs on clusters and get back the results.
  • Multi-region image segmentation of 2D and 3D images without needing to know the number of regions beforehand. 
  • Squassh for globally optimal segmentation of piecewise constant regions in 2D and 3D images and for object-based co-localization analysis. 
  • Tool for inferring spatial interactions between patterns of objects in images or between coordinates read from a file.
  • Tool for robust, histogram-based background subtraction well suited to correct for inhomogeneous illumination artifacts.
  • A tool to estimate the Point-Spread Function of the microscopy out of 2D fluorescence images.
  • A tool to measure the 3D Point-Spread Function of a confocal microscope from an image stack.
  • Addition of synthetic Poisson-distributed noise to an image in order to simulate shot noise of various signal-to-noise ratios. 
  • Convolution of an image with a Bessel function in order to simulate imaging with a microscope. 
  • A utility to detect bright spots in images and estimate their center. 
  • A utility to create manual segmentations to be used as ground truth to test and benchmark automatic segmentation algorithms.
  • A tool for replacing one color in an image with another color.
has topic
Description

ThunderSTORM is an open-source, interactive, and modular plug-in for ImageJ designed for automated processing, analysis, and visualization of data acquired by single molecule localization microscopy methods such as PALM and STORM. Our philosophy in developing ThunderSTORM has been to offer an extensive collection of processing and post-processing methods so that users can easily adapt the process of analysis to their data.

need a thumbnail
Description

## About TANGO software is an open-source software for Analysis of Nuclear Genome Organization. It is composed of an ImageJ plugin for batch processing and analysis, and a R package for statistical analysis. Reference: 2528 ## Some key features - Image import uses bioimage formats. - Construction of workflow in GUI by choosing filters / segmentation strategy for - Prefiltering - Segmentation - Postfiltering - Isolated nuclei could individually be inspected, deleted from list and subjected for detailed analysis. - Uses MCIB3D library as backend. - Basic usage is to segment nucleus, crop them to single nucleus objects, segment substructures within objects and measure their properties. - Optionally R can be connected to do detailed analysis of results. - Uses MongoDB to manage huge data set.

need a thumbnail
Description

**Collaborative Annotation Toolkit for Massive Amounts of Image Data** CATMAID is a Collaborative Annotation Toolkit for Massive Amounts of Image Data. It is designed to navigate, share and collaboratively annotate massive image data sets of biological specimens. The interface is inspired by GoogleMaps, with which it shares basic navigation concepts, enhanced to allow the exploration of 3D biological image data acquired by optical or physical sectioning microscopy techniques. The interface enables seamless sharing of regions of interest through bookmarks and synchronized navigation through multiple registered data sets. With massive biological image data sets it is unrealistic to create a sustainable centralized repository. A unique feature of CATMAID is its partially decentralized architecture where the presented image data can reside on any Internet accessible server and yet can be easily cross-referenced in the central database. In this way no image data are duplicated and the data producers retain full control over their images. CATMAID is intended to serve as data sharing platform for biologists using high-resolution imaging techniques to probe large specimens. Any high-throughput, high-content imaging project such as gene expression pattern screens would benefit from the interface for data sharing and annotation.

CATMAID
Description

Amira is 3D visualization and analysis software for life sciences.
 

" Amira software is a powerful, multifaceted 3D platform for visualizing, manipulating, and understanding life sciences data from computed tomography, microscopy, MRI, and many other imaging modalities. 
With incredible speed and flexibility, Amira software enables advanced 3D imaging workflows for specialists in research areas ranging from molecular and cellular biology to neuroscience and bioengineering. "

has topic
Amira's interface
Description

**Python(x,y)** is a free scientific and engineering development software for numerical computations, data analysis and data visualization based on Python programming language, Qt graphical user interfaces and Spyder interactive scientific development environment. Many python libraries related to numerical calculation are packaged, so you do not need to search and install them individually. Included libraries are listed **[here](https://code.google.com/p/pythonxy/wiki/StandardPlugins).**

has function
need a thumbnail
Description

u-track is a multiple-particle tracking Matlab software that is designed to (1) track dense particle fields, (2) close gaps in particle trajectories resulting from detection failure, and (3) capture particle merging and splitting events resulting from occlusion or genuine aggregation and dissociation events. Its core is based on formulating correspondence problems as linear assignment problems and searching for a globally optimal solution.

Data can be read using bio-format and interfaced with OMero data base.

It comes as a standalone software, but can be used as a library, which is according to the authors the most widely used version of it.

  • Version 2.2 adds parallel processing functionality for multi-movie datasets when using the GUI.
  • Version 2.1 enables the analysis of movies stored on an OMERO server
  • Version 2.0 includes two new tracking applications: microtubule plus-end tracking (previously distributed as plusTipTracker) and nuclei tracking
  • A third optional processing step has been added to the analysis workflow, track analysis, with two methods: motion analysis and microtubule plus-end classification

For more information, please see Jaqaman et al., Nature Methods 5, pp. 695-702 (2008). Besides basic particle tracking, the software supports the features described in Applegate et al. J. Struct. Biol. 176(2):168-84. 2011 for tracking microtubule plus end markers; and in Ng et al. J. Cell Biol. 199(3):545-63. 2012 for tracking fluorescently-labeled cell nuclei.


Description

Imaris is a software for data visualization, analysis, segmentation and interpretation of 3D and 4D microscopy images. It performs interactive volume rendering that lets users freely navigate even very large datasets (hundreds of GB). It performs both manual and automated detection and tracking of biological “objects” such as cells, nuclei, vesicles, neurons, and many more. ImarisSpots for example is a tool to detect “spherical objects” and track them in time series. Besides the automated detection it gives the user the ability to manually delete and place new spots in 3D space. ImarisCell is a tool to detect nuclei, cell boundaries and vesicles and track these through time. ImarisFilament is a module that lets users trace neurons and detect spines. For any detected object Imaris computes a large set of statistics values such as volume, surface area, maximum intensity of first channel, number of vesicles per cell etc. These values can be exported to Excel and statistics software packages. The measurements can also be analyzed directly within ImarisVantage which is a statistics tool that provides the link back to the 3D objects and the original image data. Strengths: - good visualization - user friendly interface - reads most microscopy file formats - image analysis workflows are very easy to apply - interactive editing of objects to correct errors during automatic detection - large data visualization (hundreds of GB)

has topic
null
Description

PALMsiever is a MATLAB-based application that allows the filtering (sieving) and analysis of localization-microscopy data. It provides the ability to render the data using different visualization algorithms and perform simple measurements on the point-localization data. It is extensible using simple MATLAB scripts and a number of plugins is already provided with the software itself, including a clustering algorithm and 3D rendering.

Strengths: intuitive, easy navigation through the point-localization data

Limitations: no multi-color

has function
PalmSiever logo
Description

This plugin provides a painter to visualize 2D flows. 2D Flows are couples of two sequences, one for the horizontal displacements, the other for the vertical displacements. This plugin provides a painter that draws flow arrows on top of another sequence.

need a thumbnail
Description

Track Processor to color tracks in the Track Manager

Description

3D reslicing and threshold-enabled 3D visualization.

has topic
has function
Description

A TrackProcessor that allows the user to monitor, visualize, and export, the intensity profile of tracks in time lapse sequences of 2D images.

has function
need a thumbnail
Description

Plugin designed to allow easy semi-automatic tracing of neurons or other filament-like structures (e.g., microtubules, blood vessels) through either 2D images or 3D image stacks. Data can be imported and exported in SWC files for interaction with other software, or details of the traces can be exported as CSV files for analysis in spreadsheets or statistical software.

This plugin is included in Fiji by default.

Description

Displays a live tool tip on the current focused ROI in an image.

The tooltip displays the following informations about the ROI:
– position and size.
– number of interior points and contour points.
– perimeter, area, surface area, volume.
– min, max, mean intensity.

This plugin is a daemon plugin, that means plugin is automatically loaded when Icy starts.

has function
need a thumbnail
Description

The aim of this plugin is to characterise the orientation and isotropy properties of a region of interest (ROI) in an image, based on the evaluation of the gradient structure tensor in a local neighborhood. 

has topic
Description

This plugin simulates color blindness. 
It is based on http://quarkphysics.ca/phys1/light/u-light.htm

has function
Description

When opening the Pannoramic Viewer you see all of your virtual slides in thumbnail view. Selecting one (or up to 10 at a time) the slide gets under the virtual objective of the virtual microscope. Here you can move and change the magnification of the slide quickly and easily using the mouse. Emphasizing 'quickly' is important considering the fact that the size of an average virtual slide can easily be more than 1 GB.


Main characteristics:

  • Seamless zooming and moving of the virtual slide
  • Bookmarking (annotating) on the spot, i.e. defining the specific part of the sample by drawing; finding and reading of previously made bookmarks
  • Easy and precise measurements
  • Real-time changing of brightness, contrast and color bias
  • Fluorescent slide handling, separate channel view & pseudo-colorization
  • Slide uploading and downloading for teleconsultation
  • Synchronized viewing (moving and zooming) of multiple slides for comparison purposes
  • Publication quality image capture of displayed areas (.JPG, .BMP, .TIFF)
  • TIFF, MIRAX slide and Meta-XML export for Carl Zeiss AxioVision™ compatibility
  • Scanmap export for rescanning existing digital slides
  • Easily expandable functionality via the software modules
Description

The 3D Rotation plug-in allows you to record a 360 degree rotation of the current focused 3D VTK viewer about the vertical screen axis.

The 'angle step' parameter indicates the deviation in degrees between two consecutive snapshots. Increasing the angle will increase rotation speed (up to a point where it might look like jumping more than rotating) and reduce the final movie length.

need a thumbnail
Description

3D viewer provides hardware-accelerated 3D visualization of image stacks as volumes, surfaces and orthoslices.

has function
Description

This plugin allows the creation of custom animations for 3D viewing. It will generate a new sequence that can be edited in Icy, and saved.

The animation is based on key framing, as in most of 3D rendering software projects.

has topic
has function
Description

Layer for the 3D Viewer, allowing the user to move the camera in a more intuitive way.

has function
need a thumbnail
Description

a dynamic version of the Reslice command.

Bundled with Fiji.

has function
Description

Tutorial explaining how to display a JFreeChart graph in Icy.

has function
need a thumbnail
Description

An example of a very simple overlay.

has function
need a thumbnail
Description

This plugin can display a 2D flow as a color-coded sequence, following the Middlebury color code.

has function
need a thumbnail