Analysis

Description

The BioVoxxel Toolbox is a suite which contains plugins and some macros dealing with image filtering, image segmentation and binary image processing and analysis. The following plugins are hosted here:

  • Extended Particle Analyzer
  • Binary Feature Extractor
  • Speckle Inspector
  • Watershed Irregular Features
  • EDM Binary Operations
  • Filter Check
  • Pseudo flat-field correction
  • Convoluted Background Subtraction
  • 2D Particle Distribution (Distribution_Analysis)
  • Cluster Indicator
  • SSIDC Cluster Indicator
  • Gaussian weighted Median filter
  • Adaptive Filter
  • Enhance True Color Contrast
  • Mode and Differential Limited Mean Binarization
  • Basic Recursive Filter
has topic
Description

MATLAB app to characterize nanoparticles imaged with super-resolution microscopy. nanoFeatures will read text and csv files from the NIKON and ONI microscopes and from the ThunderSTORM Fiji plugin, then cluster the localizations and filter by size and sphericity and finally output nanoparticle features like size, aspect ratio, and number of localizations per cluster (total and for each channel).

GUI first tab to browse and input files, select input type and check extra filters if needed.
Description

btrack is a Python library for multi object tracking, used to reconstruct trajectories in crowded fields. btrack implemented a residual U-Net model coupledd with a classification CNN to allow accurate instance segmentation of the cell nuclei. To track the cells over time and through cell divisions, btrack developed a Bayesian cell tracking methodology that uses input features from the images to enable the retrieval of multi-generational lineage information from a corpus of thousands of hours of live-cell imaging data.

need a thumbnail
Description

The Incucyte® Base Analysis Software provides a guided interface and purpose-built tools, which include the process of acquiring, viewing, analyzing and sharing images of living cells.

need a thumbnail
Description

Junction Mapper is a semi-automated software (Java Desktop application) for analysing data from images of cells in close proximity to each other in monolayers. The focus of Junction Mapper is to measure the morphology of cell boundaries, define single junctions and quantify the length, area and intensity of the staining of different proteins localised at cell-cell contacts. The output are various unique parameters that assess the contacting interface between cells and up to two junctional markers.

junction mapper
Description

SMLM is a mature but still growing field, which still lacks efficient and user-friendly analysis and visualization software platform adapted for both users and developers. We here introduce PoCA, a powerful open-source software platform dedicated to the visualization and analysis of 2D and 3D point-cloud data. PoCA allows manipulating large datasets, and integrates a plugin architecture, a native batch analysis engine and a Python code interpreter, facilitating both the analysis of data and the integration of new methods.

Visualization, segmentation and exploration of 3D SMLM data
Description

Machine Learning made easy

APEER ML provides an easy way to train your own machine learning
models and segment your microscopy images. No expertise or coding required.

APEER

Description

Phindr3D is a comprehensive shallow-learning framework for automated quantitative phenotyping of three-dimensional (3D) high content screening image data using unsupervised data-driven voxel-based feature learning, which enables computationally facile classification, clustering and data visualization.

Please see our GitHub page and the original publication for details.

Description

Histology Topography Cytometry Analysis Toolbox (histoCAT) is a package to visualize and analyse multiplexed image cytometry data interactively. It can also export data in.fcs data for further analysis using  a specialized cytometry sofwtare such as Flowjo. 

It can be run as a compiled standalone or from matlab.

Description

ASAP allows to automatically detect, classify and quantify structures acquired by super resolution microscopy. 

Description

The goal of mamut2r is to imports data coming from .xml files generated with the Fiji MaMuT plugin for lineage and tracking of biological objects. {mamut2r} also allows to create lineage plots.

has function
need a thumbnail
Description

AssayScope is an intuitive application dedicated to large scale image processing and data analysis. It is meant for histology, cell culture (2D, 3D, 2D+t) and phenotypic analysis. 

need a thumbnail
Description

"The Microscope Image Analysis Toolbox MiToBo is an extension for the widely used image processing application ImageJ and its new release ImageJ 2.0.
MiToBo ships with a set of operators ready to be used as plugins in ImageJ. They focus on the analysis of biomedical images acquired by various types of microscopes."

Description

The Topology ToolKit (TTK) is an open-source library and software collection for topological data analysis in scientific visualization.

TTK can handle scalar data defined either on regular grids or triangulations, either in 2D or in 3D. It provides a substantial collection of generic, efficient and robust implementations of key algorithms in topological data analysis. It includes:
 · For scalar data: critical points, integral lines, persistence diagrams, persistence curves, merge trees, contour trees, Morse-Smale complexes, topological simplification;
 · For bivariate scalar data: fibers, fiber surfaces, continuous scatterplots, Jacobi sets, Reeb spaces;
 · For uncertain scalar data: mandatory critical points;
 · For time-varying scalar data: critical point tracking;
 · For high-dimensional / point cloud data: dimension reduction;
 · and more!


TTK makes topological data analysis accessible to end users thanks to easy-to-use plugins for the visualization front end ParaView. Thanks to ParaView, TTK supports a variety of input data formats.
 

TTK is written in C++ but comes with a variety of bindings (VTK/C++, Python) and standalone command-line programs. It is modular and easy to extend. We have specifically developed it such that you can easily write your own data analysis tools as TTK modules.

has topic
ttk
Description

NeuroMorph is a toolset designed to import, analyze, and visualize mesh models in Blender. It has been developed specifically for the morphological analysis of 3D objects derived from serial electron microscopy images of brain tissue, but much of its functionality can be applied to any 3D mesh. These mesh objects can be generated by any 3D image segmentation software, such as ilastik or Fiji

Description

Scikit-learn (sklearn) is a python library used for machine learning. sklearn contains simple and efficient tools for data mining and data analysis. Modules and functions include those for classification, regression, clustering, dimensionality reduction, model selection and data preprocessing. Many people have contributed to sklearn (list of authors)

has topic
scikit-learn logo.
Description

FoCuS-point is stand-alone software for TCSPC correlation and analysis. FoCuS-point utilizes advanced time-correlated single-photon counting (TCSPC) correlation algorithms along with time-gated filtering and innovative data visualization. The software has been designed to be highly user-friendly and is tailored to handle batches of data with tools designed to process files in bulk. FoCuS-point also includes advanced diffusion curve fitting algorithms which allow the parameters of the correlation functions and thus the kinetics of diffusion to be established quickly and efficiently.

Description

FoCuS-scan is software for processing and analysis of large-scale scanning fluorescence correlation spectroscopy (FCS) data. FoCuS-scan can correlate data acquired on conventional turn-key confocal systems and in the form of xt image carpets.

Description

This notebook uses the rOMERO-gateway and EBImage to process an Image associated to the paper 'Timing of gene expression in a cell-fate decision system'.

The Image "Pos22" is taken from the dataset idr0040-aymoz-singlecell/experimentA/YDA306_AGA1y_PRM1r_Mating. It is a timelapse Image with 42 timepoints separated by 5 minutes. This Image is used to fit a model for the growth of the yeast cells. The notebook does not replicate any of the analysis of the above mentioned paper.

Its purpose is mainly to demonstrate the use of Jupyter, rOMERO-gateway and EBimage.


What it does:

  • For each time point of one movie:
    • Read the image for this time point  from the IDR
    • Threshold the images and count the cells using EBimage functions
  • Fit an exponential model to the count of cells against time to get a coefficient of grow (exponential factor)


has function
Description

This is a Jupyter notebook demonstrating the run of a code from IDR data sets by loading a CellProfiler Pipeline 

The example here is applied on real data set, but does not correspond to a biological question. It aims to demonstrate how to create a jupyter notebook to process online plates hosted in the IDR.

It reads the plate images from the IDR.

It loads the CellProfiler Pipeline and replace the reading modules used to read local files from this defaults pipeline by module allowing to read data remotely accessible.

It creates a CSV file and displays it in the notebook.

It makes some plot with Matplotlib.


jupyter
Description

This workflow can be ran with data from 3D-SIM showing the centrosomes in order to compare the distribution of diameters of rings (or toroids) of different proteins from the centrioles or the peri centriolar material. It aims to reproduce the results of the Nature Cell Biology Paper Subdiffraction imaging of centrosomes reveals higher-order organizational features of pericentriolar material  from the same data set but with a different analysis method.

It is slightly different from the methods described in the paper itself, where the method was to work on a maximum intensity projection of a 3D-SIM stack, and then to fit circle to the centrioles to estimate the diameters of the toroids.

In this workflow, the images are read from the IDR , then process by thresholding (Maximum entropy auto thresholding with Image J), and processed by Analyze Particles  with different measurement sets, including the bouding box. Then the analysis of diameters and the statistical test are performed using R. All the code and data sets are available, and in the case of this paper have shown a layered organisation of the proteins.

Combined view from Figure 1 Lawo et al.
Description

Python is a programming language.

Python 2.7.0 was released on July 3rd, 2010.

Python 2.7 is scheduled to be the last major version in the 2.x series before it moves into an extended maintenance period. This release contains many of the features that were first released in Python 3.1.

 A bugfix release, 2.7.16, is currently available. Its use is recommended.

need a thumbnail
Description

This note presents the design of a scalable software package named ImagePy for analysing biological images. Our contribution is concentrated on facilitating extensibility and interoperability of the software through decoupling the data model from the user interface. Especially with assistance from the Python ecosystem, this software framework makes modern computer algorithms easier to be applied in bioimage analysis.

Description

Bioconductor provides tools for the analysis and comprehension of high-throughput genomic data. Bioconductor uses the R statistical programming language, and is open source and open development. It has two releases each year, 1560 software packages, and an active user community. Bioconductor is also available as an AMI (Amazon Machine Image) and a series of Docker images.

has function
Description

This R package implements the NBLAST neuron similarity algorithm described in a preprint available at http://dx.doi.org/10.1101/006346. In addition to basic pairwise comparison, the package implements search of databases of neurons. There is also suport for all x all comparison for a group of neurons. This can produce a distance matrix suitable for hierarchical clustering, which is also implemented in the package.

has topic
has function
Description

An R package for the (3D) visualisation and analysis of biological image data, especially tracings of single neurons. nat is the core package of a wider suite of neuroanatomy tools introduced at http://jefferislab.github.io.

has function
Description

WND-CHARM is a multi-purpose image classifier that can be applied to a wide variety of image classification tasks without modifications or fine-tuning, and yet provides classification accuracy comparable to state-of-the-art task-specific image classifiers. WND-CHARM can extract up to ~3,000 generic image descriptors (features) including polynomial decompositions, high contrast features, pixel statistics, and textures. These features are derived from the raw image, transforms of the image, and compound transforms of the image (transforms of transforms). The features are filtered and weighted depending on their effectiveness in discriminating between a set of predefined image classes (the training set). These features are then used to classify test images based on their similarity to the training classes. This classifier was tested on a wide variety of imaging problems including biological and medical image classification using several imaging modalities, face recognition, and other pattern recognition tasks. WND-CHARM is an acronym that stands for "Weighted Neighbor Distance using Compound Hierarchy of Algorithms Representing Morphology."

Generated features
Description

WormGUIDES Atlas is an interactive 4D portrayal of neural development in C. elegans. It will ultimately contain nuclear positions for every cell in the embryo, identified and tracked from the 2 cell stage until hatching. Single-cell and subcellular information, including neural outgrowth dynamics for each cell as well as cell function, gene expression, the adult neural connectome and related literature will be collated for each cell from public sources and also integrated with the atlas model. WormGUIDES Atlas integrates tools for exploratory data analyses and insight sharing. Navigation is linked between 3D and lineage tree views. In both contexts, community single cell information can be accessed with a click, creating live web queries that summarize knowledge about a cell. In many cases this information can be used to control cell color, creating customized interactive visualizations. A user's insights can be annotated directly into the embryo model with a note-taking interface that attaches each annotation to a cell or other point in space and time. These multi-dimensionally located notes can then be ordered into a (chrono)logical story sequence that explains developmental events as they unfold in the embryo. Annotations can be saved and shared with collaborators or the community.

WormGuides screenshot
Description

GelBandFitter is a user-friendly software specific for analysis of protein gels and estimation of relative protein content. Using non-linear regression methods to fit mathematical functions to densitometry profiles, it is able to estimate content from protein bands that partially overlap. The software is available either as Matlab code (Optimization toolbox required) or a Windows executable. Reference: Mitov, M. I., Greaser, M. L., & Campbell, K. S. (2009). GelBandFitter – A computer program for analysis of closely spaced electrophoretic and immunoblotted bands. Electrophoresis, 30(5), 848–851. http://doi.org/10.1002/elps.200800583

has topic
has function
GelBandFitter screenshot
Description

ADAPT is capable of rapid, automated analysis of migration and membrane protrusions, together with associated
fluorescently labeled proteins, across multiple cells. ADAPT can detect and morphologically profile filopodia.

ADAPT (Automated Detection and Analysis of ProTrusions) is a plug-in developed for the ImageJ/Fiji platform to automatically detect and analyse cell migration and morphodynamics. The program provides whole-cell analysis of multiple cells, while also returning data on individual membrane protrusion events. The plug-in accepts as input one or two image stacks and outputs a variety of data. ADAPT may also be run in batch mode.


has function
ADAPT logo
Description

QuantCenter is the framework for 3DHISTECH image analysis applications. with the goal of helping the pathologists to diagnose in an easier way. QuantCenter, is optimized for whole slide quantification. It has a linkable algorithm concept that tries to provide an easy-to-use and logical workflow. The user has different quantification modules that he or she could link one after other to fine-tune or to speed up the analysis.

QuantCenter logo
Description

Free-D is a three-dimensional (3D) reconstruction and modeling software. It allows to generate, process and analyze 3D point and surface models from stacks of 2D images. Free-D is an integrated software, offering in a single graphical user interface all the functionalities required for 3D modeling. It runs on Linux, Windows, and MacOS. Free-D is developed by the Modeling and Digital Imaging team of the Institut Jean-Pierre Bourgin, INRA Versailles, France.

Description

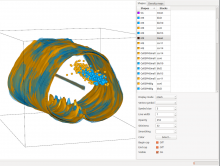
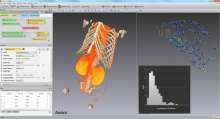
Free-D (http://free-d.versailles.inra.fr/) is a 3D reconstruction and modeling software. It is multiplatform, free (but not open source) tool for academic research and teaching.

Here is how to proceed, using Free-D:

1. Segmentation:

* load (a collection of) individual 3d stacks

* (optional for serial sections) perform a 2D registration to align image slices

* segment/reconstruct 3D contours using snakes

* segment 3D spots

2. Construct average cell:

* normalize the contours to compute a average cell, by registering/warping 3D contours/surfaces

3. Quantification:

* project each individual cell to the average one

* build density maps to analyze (cartography)

A few notes for current software version (till 10/2016):

* input file format: tiff (not able to import bioformats)

* currently results are saved in customized format, but there is an exportor to convert this format into fiji readable one

* import already generated contours is on the software's TODO list

need a thumbnail
Description

This is an ImageJ plugin to analyze bacterial cells. It provides a user-friendly interface and a powerful suite of detection, analysis and data presentation tools. It works with individual phase or fluorescence images as well as stacks, hyperstacks, and folders of any of these types. Even large image sets are analyzed rapidly generating raw tabular data that can either be saved or copied as is, or have additional statistical analysis performed and graphically represented directly from within MicrobeJ, making it an all-in-one image analysis solution.

need a thumbnail
Description

This imageJ/Fiji plugin provides an analysis of the granulometry inside an image by mathematical morphology. It has sevral option for the structuring element to be used, and the size domain to be tested. The output will be both a curve of the remaining content of the image against the growing size of the structuring element, and the corresponding results table that could be then exported. It can deal with grayscale images directly, no need to segment the image first. This plugin can then be used to compare different texture based on some statistical analysis of the produced curve (for exemple comparison of the geometrical means to discriminate 2 textures). It is macro recordable as well. Programming Language: java Processes: successive erosion, dilation, closing or opening -> ANALYSIS User skills: Life Scientist, developers, analysts

has topic
granulometry
Description

Localization-based super-resolution techniques open the door to unprecedented analysis of molecular organization. This task often involves complex image processing adapted to the specific topology and quality of the image to be analyzed. SR-Tesseler is an open-source segmentation software using Voronoï tessellation constructed from the coordinates of localized molecules. It allows precise, robust and automatic quantification of protein organization at different scales, from the cellular level down to clusters of a few fluorescent markers. SR-Tesseler is insensitive to cell shape, molecular organization, background and noise, allowing comparing efficiently different biological conditions in a non-biased manner, and perform quantifications on various proteins and cell types. SR-Tesseler software comes with a very simple and intuitive graphical user interface, providing direct visual feedback of the results and is freely available under GPLv3 license.

Density map of a neuron extracted from the Voronoï diagram
Description

An easy to use, image analysis software package that enables rapid exploration and interpretation of microscopy data.

PhenoBrowser
Description

Image processing library for Python >The scikit-image SciKit (toolkit for SciPy) extends scipy.ndimage to provide a versatile set of image processing routines. It is written in the Python language. This SciKit is developed by the SciPy community. All contributions are most welcome!

has function
Scikit logo
Description

The original paper describes a method to analyze mitochondrial morphology in 2D and 3D.

Description

Amira is 3D visualization and analysis software for life sciences.
 

" Amira software is a powerful, multifaceted 3D platform for visualizing, manipulating, and understanding life sciences data from computed tomography, microscopy, MRI, and many other imaging modalities. 
With incredible speed and flexibility, Amira software enables advanced 3D imaging workflows for specialists in research areas ranging from molecular and cellular biology to neuroscience and bioengineering. "

has topic
Amira's interface
Description

**Python(x,y)** is a free scientific and engineering development software for numerical computations, data analysis and data visualization based on Python programming language, Qt graphical user interfaces and Spyder interactive scientific development environment. Many python libraries related to numerical calculation are packaged, so you do not need to search and install them individually. Included libraries are listed **[here](https://code.google.com/p/pythonxy/wiki/StandardPlugins).**

has function
need a thumbnail
Description

PALMsiever is a MATLAB-based application that allows the filtering (sieving) and analysis of localization-microscopy data. It provides the ability to render the data using different visualization algorithms and perform simple measurements on the point-localization data. It is extensible using simple MATLAB scripts and a number of plugins is already provided with the software itself, including a clustering algorithm and 3D rendering.

Strengths: intuitive, easy navigation through the point-localization data

Limitations: no multi-color

has function
PalmSiever logo
Description

TrackProcessor for the TrackManager plugin that allows importing/exporting tracks. Input and output files are in the .xml format used for the ISBI'2012 Particle Tracking Challenge. Tracks are loaded/exported in/from the TrackManager plugin

has function