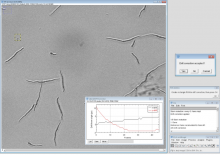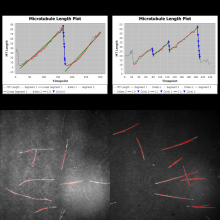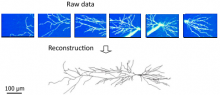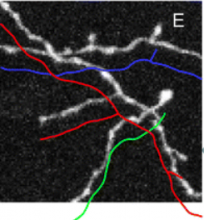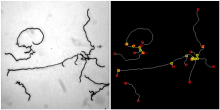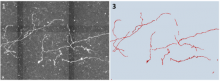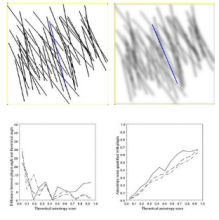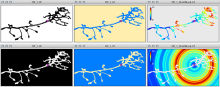
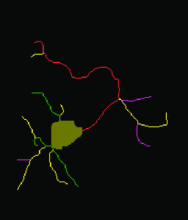

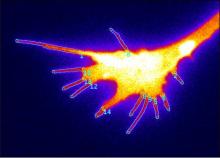
Analysis of filopodia dynamics
ImageJ & R, for advanced analysts. Slides, Scripts, Reproduction of results & deconstruction. Segmentation of filopodia (thin filamentous structure) and analysis of their shape and movements to characterize phenotypes.
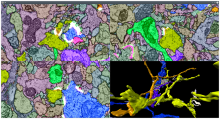
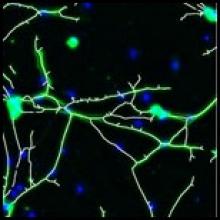
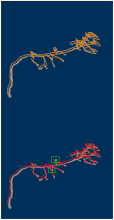
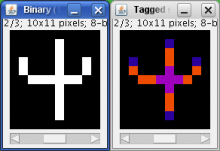
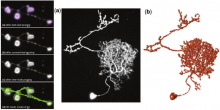
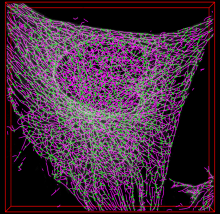
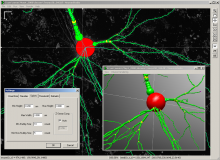
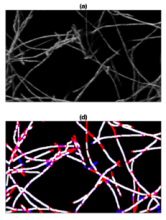
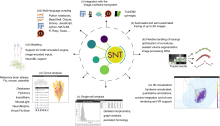
Filament tracing operations are image analysis operations in which there is an image of a filamentous structure (it may be a tree-like structure, a filament network or a agglomeration of single 'stick-like' filaments) as input and outputs data that represent the filament, most commonly a skeleton representation of the filaments and their diameters or surfaces.
ImageJ & R, for advanced analysts. Slides, Scripts, Reproduction of results & deconstruction. Segmentation of filopodia (thin filamentous structure) and analysis of their shape and movements to characterize phenotypes.
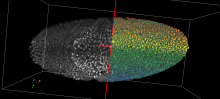
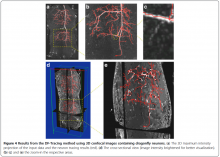
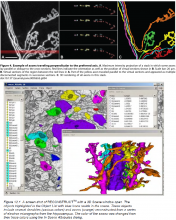
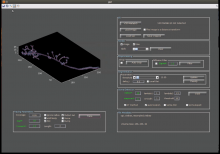
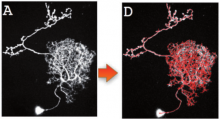
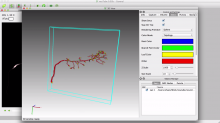
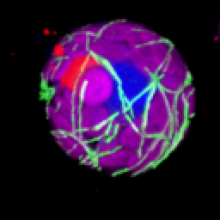
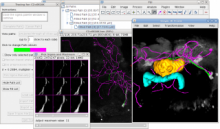
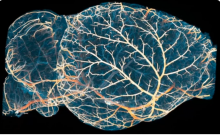
In this session, we will implement a simple ImageJ macro to segment and analyze the blood vessel network of a subcutaneous tumor. The analysis is fully performed in 3D, and possible strategies to extract statistics of the network geometry and interactively visualize the results are also discussed and implemented.