Image segmentation

Image segmentation is (one of) the (few) concept(s) on the border between Image (pre)processing (Image->Image) and Image analysis (Image->Data).

Description

Fiji plugin to segment oocyte and zona pellucida contours from transmitted light images and extract hundreds of morphological features to describe numerically the oocyte. Segmentation is based on trained neural networks (U-Net) that were trained on both mouse and human oocytes (in prophase and meiosis I) acquired in different conditions. They are freely avaialable on the github repository and can be retrained if necessary. Oocytor also have options to extract hundreds of morphological/intensity features to characterize manually the oocyte (eg perimeter, texture...). These features can also be used in machine learning pipeline for automatic phenotyping.

Description

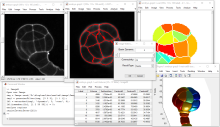
EPySeg is a package for segmenting 2D epithelial tissues. EPySeg also ships with a graphical user interface that allows for building, training and running deep learning models.

Training can be done with or without data augmentation (2D-xy and 3D-xyz data augmentation are supported). EPySeg relies on the segmentation_models library. EPySeg source code is available here. Cloud version available here.

has function
need a thumbnail
Description

ZeroCostDL4Mic: exploiting Google Colab to develop a free and open-source toolbox for Deep-Learning in microscopy

ZeroCostDL4Mic is a collection of self-explanatory Jupyter Notebooks for Google Colab that features an easy-to-use graphical user interface. They are meant to quickly get you started on learning to use deep-learning for microscopy. 

need a thumbnail
Description

Fractal is a framework to process high-content imaging data at scale and prepare it for interactive visualization. Fractal provides distributed workflows that convert TBs of image data into OME-Zarr files. The platform then processes the 3D image data by applying tasks like illumination correction, maximum intensity projection, 3D segmentation using cellpose and measurements using napari workflows. The pyramidal OME-Zarr files enable interactive visualization in the napari viewer.

need a thumbnail
Description


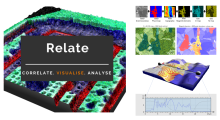
Relate is a correlative software package optimised to work with EM, EDS, EBSD, & AFM data and images.  It provides the tools you need to correlate data from different microscopes, visualise multi-layered data in 2D and 3D, and conduct correlative analyses.

  • Combining data from different imaging modalities (e.g. AFM, EDS & EBSD)

  • Interactive display of multi-layer correlated data

  • Analytical tools for metadata interrogation

  • Documented workflows and processes

Correlate

  • Import data from AZtec using the H5oina file format
  • Import AFM data
  • Correlate both sets of data using intuitive image overlays and image matching tools
  • Produce combined multimodal datasets

Visualise

  • 2D display of multi-layered data
  • 3D visualisation of topography combined with AFM material properties, EM images, and EDS & EBSD map overlays
  • Customisation of colour palettes, data overlays, image rendering options, and document display
  • Export images and animations

Analyse

  • Generate profile (cross section) views of multimodal data
  • Measure and quantify data across multiple layers
  • Analyse areas via data thresholding using amount of x-ray counts, phase maps, height, or other material properties.
  • Select an extensive range of measurement parameters
  • Export analytical data to text or CSV files
Relate analysis workflow example
Description

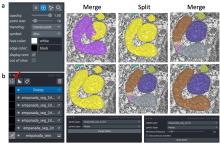
The empanada-napari plugin is built to democratize deep learning image segmentation for researchers in electron microscopy (EM). It ships with MitoNet, a generalist model for the instance segmentation of mitochondria. There are also tools to quickly build and annotate training datasets, train generic panoptic segmentation models, finetune existing models, and scalably run inference on 2D or 3D data. To make segmentation model training faster and more robust, CEM pre-trained weights are used by default. These weights were trained using an unsupervised learning algorithm on over 1.5 million EM images from hundreds of unique EM datasets making them remarkably general.

Empanada-napari

MIA

Description

ModularImageAnalysis (MIA) is an ImageJ plugin which provides a modular framework for assembling image and object analysis workflows. Detected objects can be transformed, filtered, measured and related. Analysis workflows are batch-enabled by default, allowing easy processing of high-content datasets.

MIA is designed for “out-of-the-box” compatibility with spatially-calibrated 5D images, yielding measurements in both pixel and physical units.  Functionality can be extended both internally, via integration with SciJava’s scripting interface, and externally, with Java modules that extend the MIA framework. Both have full access to all objects and images in the analysis workspace.

Workflows are, by default, compatible with batch processing multiple files within a single folder. Thanks to Bio-Formats, MIA has native support for multi-series image formats such as Leica .lif and Nikon .nd2.

Workflows can be automated from initial image loading through processing, object detection, measurement extraction, visualisation, and data exporting. MIA includes near 200 modules integrated with key ImageJ plugins such as Bio-Formats, TrackMate and Weka Trainable Segmentation.

Module(s) can be turned on/off dynamically in response to factors such as availability of images and objects, user inputs and measurement-based filters. Switches can also be added to “processing view” for easy workflow control.

MIA is developed in the Wolfson Bioimaging Facility at the University of Bristol.

Description

Machine Learning made easy

APEER ML provides an easy way to train your own machine learning
models and segment your microscopy images. No expertise or coding required.

APEER

Image Analysis Training Resources

Submitted by Perrine on Wed, 06/30/2021 - 14:15

This is a resource for image analysis training material, with a focus on research in the life sciences.

Currently, this resource is mainly meant to serve image analysis trainers, helping them to design courses. However, we might add more text (or videos) to the material such that it could also be used by students for self-directed study.

Description

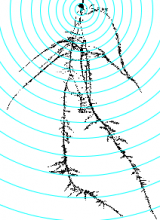
This tool allows to analyze morphological characteristics of complex roots. While for young roots the root system architecture can be analyzed automatically, this is often not possible for more developed roots. The tool is inspired by the Sholl analysis used in neuronal studies. The tool creates a binary mask and the Euclidean Distance Transform from the input image. It then allows to draw concentric circles around a base point and to extract measures on or within the circles. Instead of circles, which present the distance from the base point, horizontal lines can be used, which present the distance in the soil from the base-line. The following features are currently implemented:

  • The area of the root per distance/depth.
  • The number of border pixel per distance/depth, giving an idea of the surface in contact with the soil.
  • The maximum radius per distance/depth of a root, measured at the crossing points with the circles or lines.
  • The number of crossings of roots with the circles or lines.
  • The maximum distance to the left and the right from the vertical axis at crossing points with the circles or lines.
Concentric circles on the mask of a root, created by the Analyze Complex Roots Tool
Description

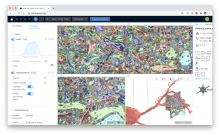
webKnossos is an open-source data sharing and annotation platform for tera-scale 2D and 3D image datasets.

The core features of webKnossos are:

  • fast 3D data streaming
  • share links to specific locations in the data
  • uniquely fast skeleton annotation (flight mode) and
  • efficient volume annotation
  • mesh rendering
  • collaboration and sharing tools

webKnossos facilitates image analysis workflows on multi-terabyte datasets, including visualization of raw and multi-modal microscopy data, distributed training data generation and proof-reading of automatic segmentation.

As a scientific resource, webknossos.org serves as a database for published image datasets including their annotations.


Description

The ImageM application proposes an integrated user interface that facilitates the processing and the analysis of multi-dimensional images within the Matlab environment. It provides a user-friendly visualization of multi-dimensional images, a collection of image processing algorithms and methods for analysis of images, the management of spatial calibration, and facilities for the analysis of multi-variate images. Its graphical user interface is largely inspired from the open source software "ImageJ". ImageM can also be run on the open source alternative software to Matlab, Octave.

ImageM is freely distributed on GitHub: https://github.com/mattools/ImageM.

Processing of a 3D image with the ImageM sotfware
Description

This is the ImageJ/Fiji plugin for StarDist, a cell/nuclei detection method for microscopy images with star-convex shape priors ( typically for Dapi like staining of nuclei). The plugin can be used to apply already trained models to new images.

Stardist
Description

VAST (Volume Annotation and Segmentation Tool) is a utility application for manual annotation of large EM stacks.

General labeling tool, used for a large variety of 3D data sets; electron-microscopic, multi-channel light-microscopic, and Micro-CT data sets as well as videos, and annotating arbitrary structures, regions and locations, depending on the user’s needs.

Description

Blood vessels tracing in 3D image from Tubeness filtering (user defined scale), 3D opening (radius set to 2), thresholding (user defined level) and 3D skeletonization.

need a thumbnail
Description

Starting from image stacks, the nuclear boundary as well as nuclear bodies are segmented. As output, NucleusJ automatically measures 15 parameters quantifying shape and size of nuclei as well as intra-nuclear objects and the positioning of the objects within the nuclear volume.

has function
Description

LBADSA is based on the fitting of the Young-Laplace equation to the image data to measure drops.

has function
Description

Dragonfly is a software platform for the intuitive inspection of multi-scale multi-modality image data. Its user-friendly experience translates into powerful quantitative findings with high-impact visuals, driven by nuanced easy-to-learn controls.

For segmentation: It provides an engine fior machine Learning, Watershed and superpixel methods, support histological data .

It offers a 3D viewer, and python scripting capacities .

It is free for reserach use, but not for commercial usage.

DragonFly
Description

This is an implementation of Mask R-CNN on Python 3, Keras, and TensorFlow. The model generates bounding boxes and segmentation masks for each instance of an object in the image. It's based on Feature Pyramid Network (FPN) and a ResNet101 backbone.

Description

NEUBIAS-WG5 workflow for nuclei segmentation using Mask-RCNN. The workflow uses Matterport Mask-RCNN. Keras implementation. The model was trained with Kaggle 2018 Data Science Bowl images.

has topic
need a thumbnail
Description

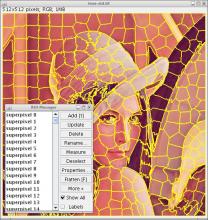
jSLIC superpixels - is a segmentation method for clustering similar regions - superpixels - in the given image which are usually used for other segmentation techniques. The only two parameters are average (initial) size of each superpixel and rigidity parameter in range (0,1)

has topic
has function
superpixels - ROI
Description

Collection of several basic standard image segmentation methods focusing on medical imaging. In particular, the key block/applications are (un)supervised image segmentation using superpixels, object centre detection and region growing with a shape prior. Besides the open-source code, there is also a few sample images.


has topic
has function
Description

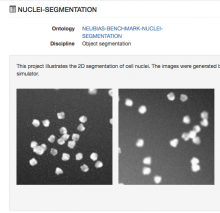
This workflow processes a group of images containing cells with discernible nuclei and segments the nuclei and outputs a binary mask that show where nuclei were detected. It was developed as a test workflow for Neubias BIAFLOWS Benchmarking tool.

has function
Description

The macro will segment nuclei and separate clustered nuclei in a 3D image using a distance transform watershed. As a result an index-mask image is written for each input image.

need a thumbnail
Description

This suite provides plugins to enhance 3D capabilities of ImageJ.

  • 3D Filters (mean, median, max, min, tophat, max local, …) and edge and symmetry filter
  • 3D Segmentation (iterative thresholding, spots segmentation, watershed, …)
    • 3D hysteresis thresholding with two thresholds (see 2D hysteresis for explanation).
    • 3D simple segmentation with thresholding to label 3D objects (similar to 3D objects counter).
    • 3D iterative thresholding (find optimal threshold for each object).
    • 3D spot segmentation with various local threshold estimations.
    • 3D Maxima Finder (with noise parameter)
    • 3D seeds-based watershed with automatic local maxima detection for seeds.
  • 3D Mathematical Morphology tools (fill holes, binary closing, distance map, …)
  • 3D RoiManager (3D display and analysis of 3D objects)
  • 3D Analysis (Geometrical measurements, Mesh measurements, Convex hull, …)
    • 3D Geometrical measurements (volume, surface, …) for each labelled object.
    • 3D Centroid, to compute centroids of labelled objects.
    • 3D Intensity measurements (mean, integrated density, …) in a opened image for each labelled object.
    • 3D Shape measurements (compactness, elongation, …) for each labelled object.
    • 3D Mesh Measurements after triangulation (see 3D Viewer for surface mesh computation).
    • 3D fitting by an ellipsoid and main direction computation (details here).
    • 3D convex hull (see http://rsbweb.nih.gov/ij/plugins/3d-convex-hull/index.html).
    • 3D Radial Distance Area Ratio (RDAR)
    • 3D Density, to compute density of dots, based on closest distance analysis (details here).
  • 3D MereoTopology (Relationship between objects)
  • 3D Tools (Drawing ellipsoids and lines, cropping, …)
    • Drawing 3D line
    • Drawing 3D ellipsoids in any direction
    • Drawing in stacks as volumes
    • Drawing in 3D viewer as surfaces
need a thumbnail
Description

The macro will segment nuclei and separate clustered nuclei using a binary watershed. As a result an index-mask image is written for each input image.

need a thumbnail

video tutorial on 3D vessel segmentation of synchrotron phase contrast tomography

Submitted by czhang on Tue, 01/29/2019 - 20:32

In this tutorial video, a coronary arterial tree is used as the demo example to show in detail how the semi-automatic segmentation workflow, Carving from the open-source image analysis software ilastik, can be used. Tips on how and why a preprocessing is done, as well as parameter settings are provided.

Description

TEM ExosomeAnalyzer is a program for automatic and semi-automatic detection of extracellular vesicles (EVs), such as exosomes, or similar objects in 2D images from transmission electron microscopy (TEM). The program detects the EVs, finds their boundaries, and reports information about their size and shape.

The software has been developed in terms of project MUNI/M/1050/2013 and supported by Grant Agency of Masaryk University.

The EVs are detected based on the shape and edge contrast criteria. The exact shapes of the EVs are then segmented using a watershed-based approach.

With proper parameter settings, even images with EVs both lighter and darked than the background, or containing artifacts or precipitated stain can be processed. If the fully-automatic processing fails to produce the correct results, the program can be used semi-automatically, letting the user adjust the detection seeds during the intermediate steps, or even draw the whole segmentation manually.

screen capture from exosomeAnalyzer
Description

There are many methods in bio-imaging that can be parametrized. This gives more flexibility
to the user as long as tools provide easy support for tuning parameters. On the other hand, the
datasets of interest constantly grow which creates the need to process them in bulk. Again,
this requires proper tool support, if biologist is going to be able to organize such bulk
processing in an ad-hoc manner without the help of a programmer. Finally, new image
analysis algorithms are being constantly created and updated. Yet, lots of work is necessary to
extend a prototype implementation into product for the users. Therefore, there is a growing
need for software with a graphical user interface (GUI) that makes the process of image
analysis easier to perform and at the same time allows for high throughput analysis of raw
data using batch processing and novel algorithms. Main program in this area are written in
Java, but Python grow in bioinformatics and will be nice to allow easy wrap algorithm written
in this language.
Here we present PartSeg, a comprehensive software package implementing several image
processing algorithms that can be used for analysis of microscopic 3D images. Its user
interface has been crafted to speed up workflow of processing datasets in bulk and to allow
for easy modification of algorithm’s parameters. In PartSeg we also include the first public
implementation of Multi-scale Opening algorithm descibed in [1]. PartSeg allows for
segmentation in 3D based on finding connected components. The segmentation results can be
corrected manually to adjust for high noise in the data. Then, it is possible to calculate some
standard statistics like volume, mass, diameter and their user-defined combinations for the
results of the segmentation. Finally, it is possible to superimpose segmented structures using
weighted PCA method. Conclusions: PartSeg is a comprehensive and flexible software
dedicated to help biologists in processing, segmentation, visualization and the analysis of the
large microscopic 3D image data. PartSeg provides well established algorithms in an easy-touse,
intuitive, user-friendly toolbox without sacrificing their power and flexibility.


Examples include Chromosome territory analysis.

PartSeg
Description

AssayScope is an intuitive application dedicated to large scale image processing and data analysis. It is meant for histology, cell culture (2D, 3D, 2D+t) and phenotypic analysis. 

need a thumbnail
Description

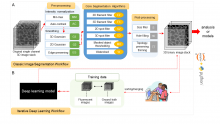
The Allen Cell Structure Segmenter is a Python-based open source toolkit developed at the Allen Institute for Cell Science for 3D segmentation of intracellular structures in fluorescence microscope images.

It consists of two complementary elements:

  1. Classic image segmentation workflows for 20 distinct intracellular structure localization patterns. A visual “lookup table” is outlining the modular algorithmic steps for each segmentation workflow. This provides an intuitive guide for selection or construction of new segmentation workflows for a user’s particular segmentation task. 
  2. Human-in-the-loop iterative deep learning segmentation workflow trained on ground truth manually curated data from the images segmented with the segmentation workflow. Importantly, this module was not released yet.


The Allen Cell Structure Segmenter Overview
Description

Labkit is an open-source tool to segment truly large image data using sparse training data. It has an intuitive and responsive user interface based on Big Data Viewer, allowing users to conveniently browse and annotate even terabyte sized image volumes.

Update site: Labkit

has topic
need a thumbnail
Description

SimpleITK provides a simplified interface to ITK in a variety of languages. A user can either download pre-built binaries, if they are available for the desired platform and language, or SimpleITK can be built from the source code. Currently, Python binaries are available on Microsoft Windows, GNU Linux and Mac OS X. C# and Java binaries are available for Windows. We are also working towards supporting R packaging.

need a thumbnail
Description

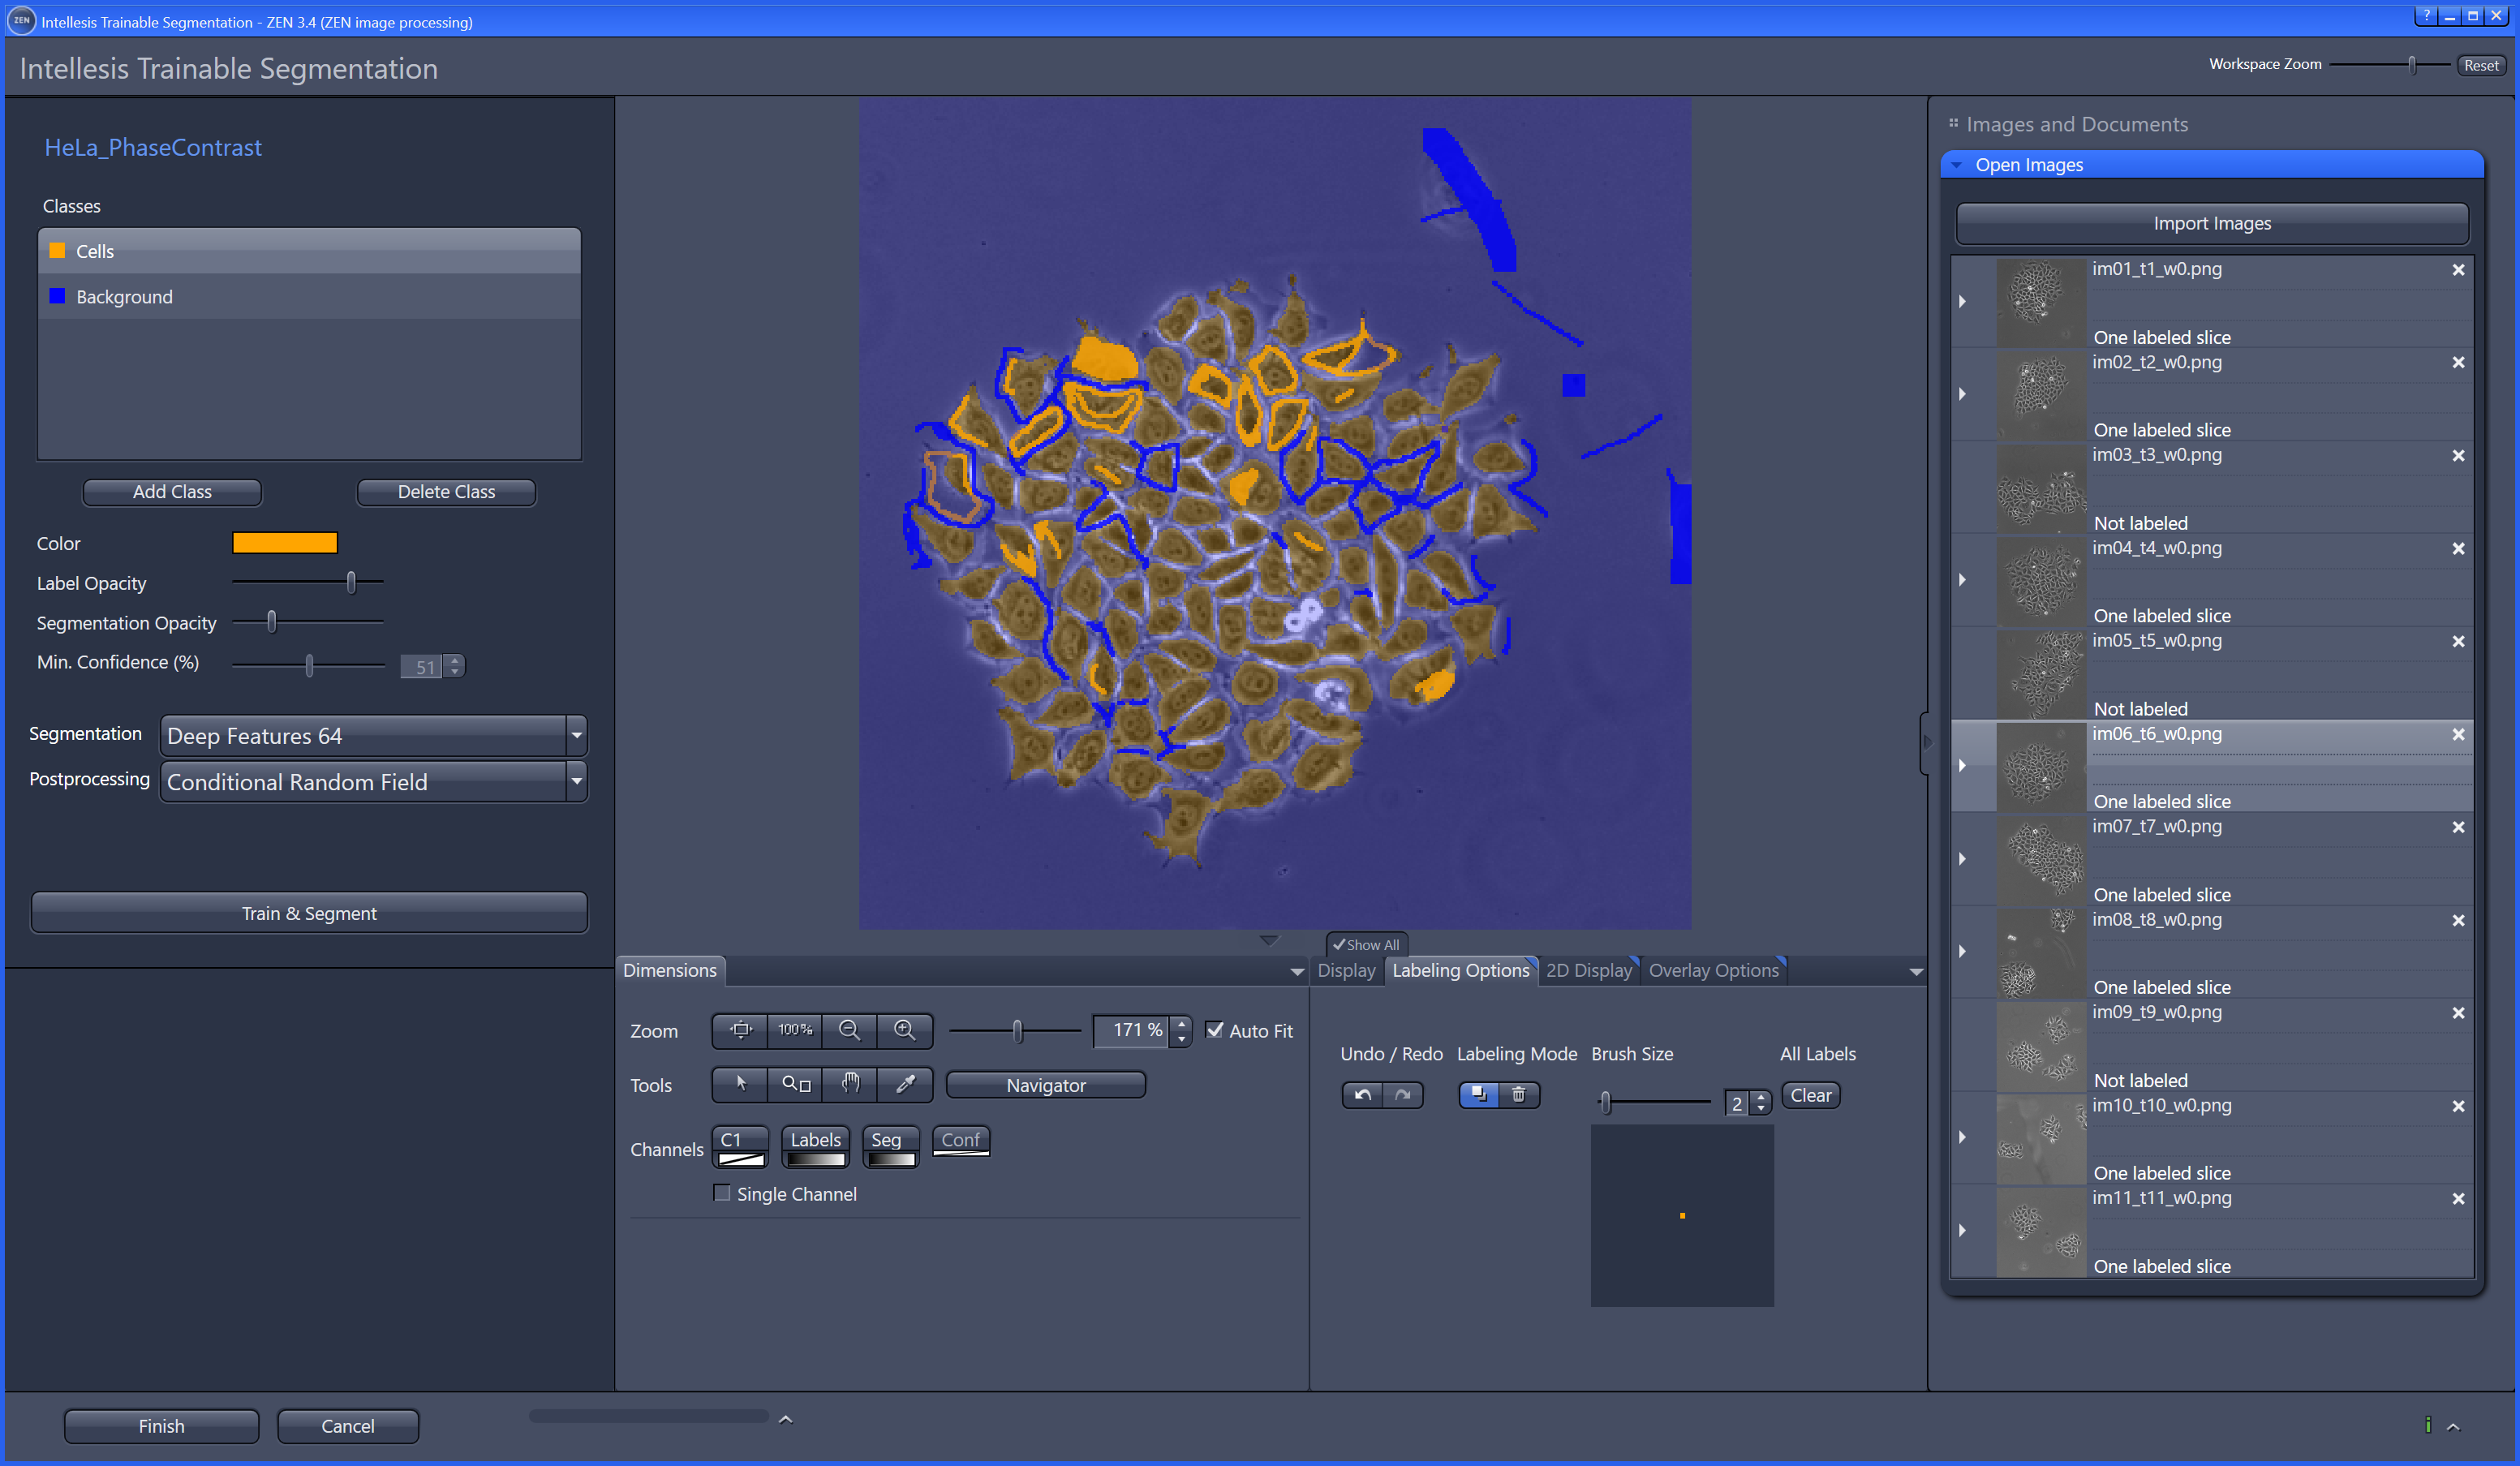
ZEN and APEER – Open Ecosystem for integrated Machine-Learning Workflows

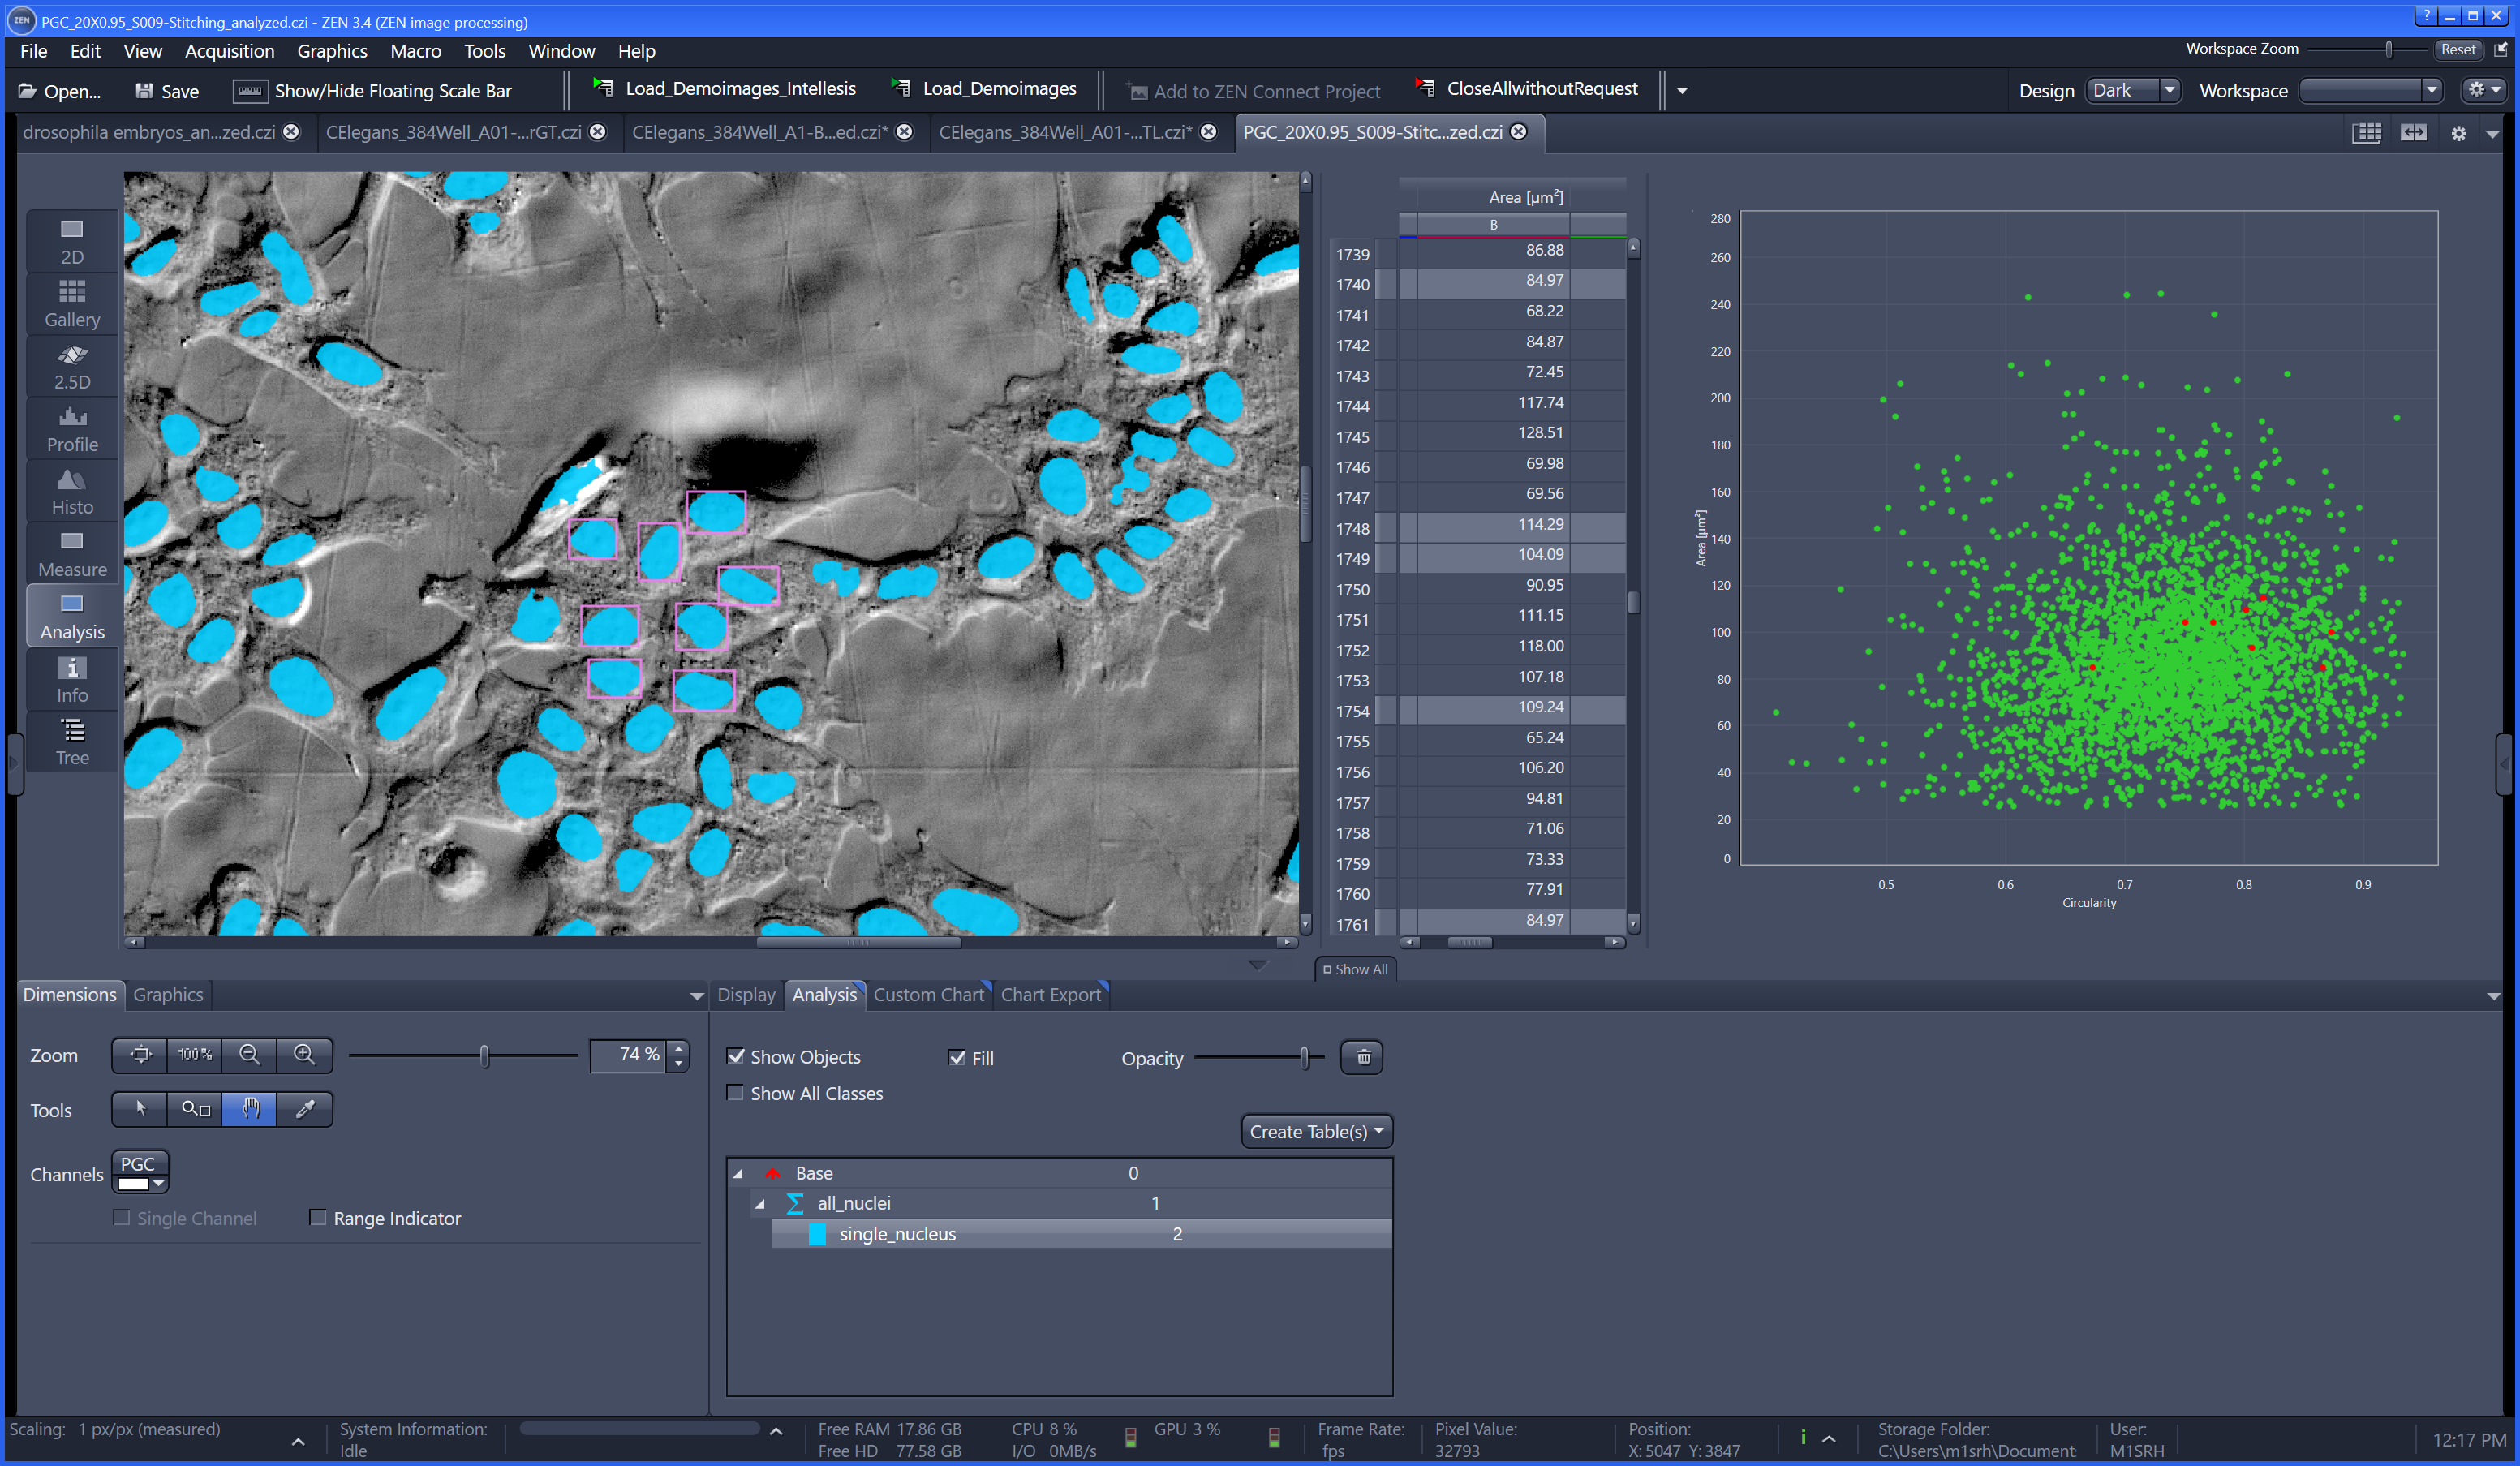
Open ecosystem for integrated machine-learning workflows to train and use machine-learning models for image processing and image analysis inside the ZEN software or on the APEER cloud-based platform

Highlights ZEN

  • Simple User Interface for Labeling and Training
  • Engineered Features Sets and Deep Feature Extraction + Random Forrest for Semantic Segmentation
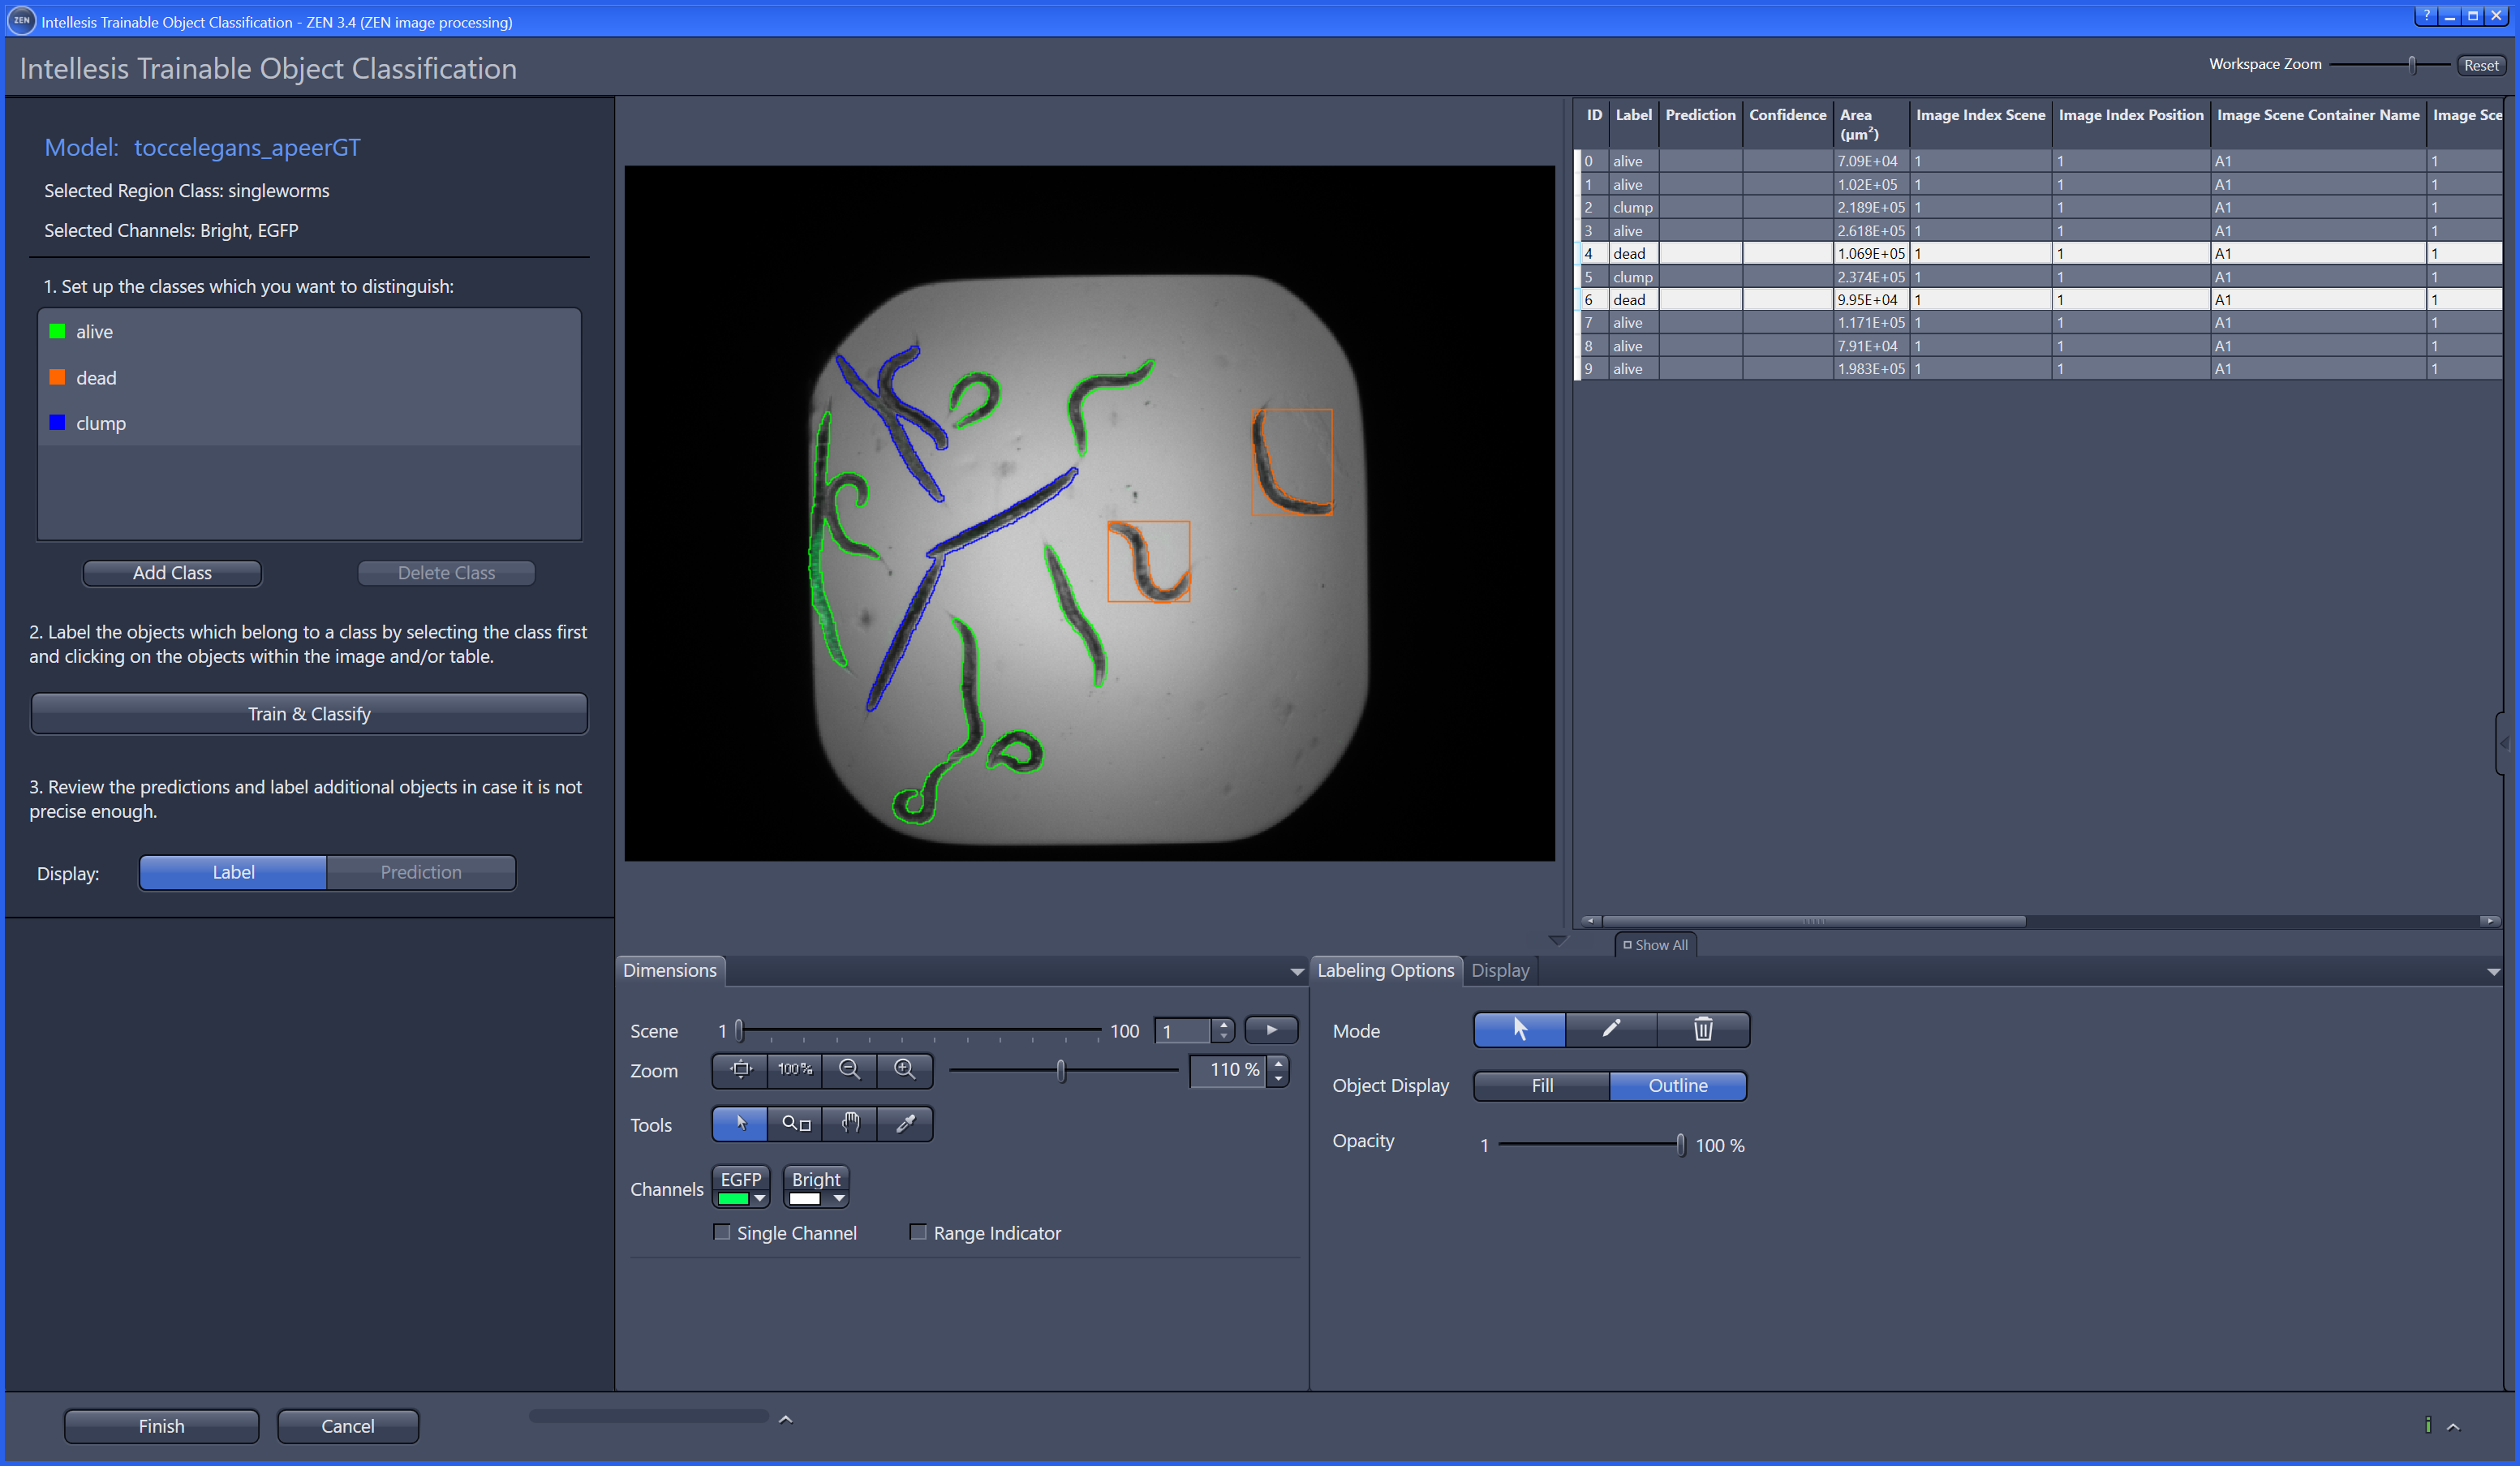
  • Object Classification workflows
  • Probability Thresholds and Conditional Random Fields
  • Import your own trained models as *.czann files (see: czmodel · PyPI)
  • Import "AIModel Containes" from arivis AI for advanced Instance Segmentation
  • Integration into ZEN Measurement Framework
  • Support for Multi-dimensional Datasets and Tile Images
  • open and standardized format to store trained models
ZEN Intellesis Segmentation

ZEN Intellesis Segmentation - Training UI

ZEN Intellesis - Pretrained Networks

ZEN Intellesis Segmentation - Use Deep Neural Networks

Intellesis Object Classification

ZEN Object Classification

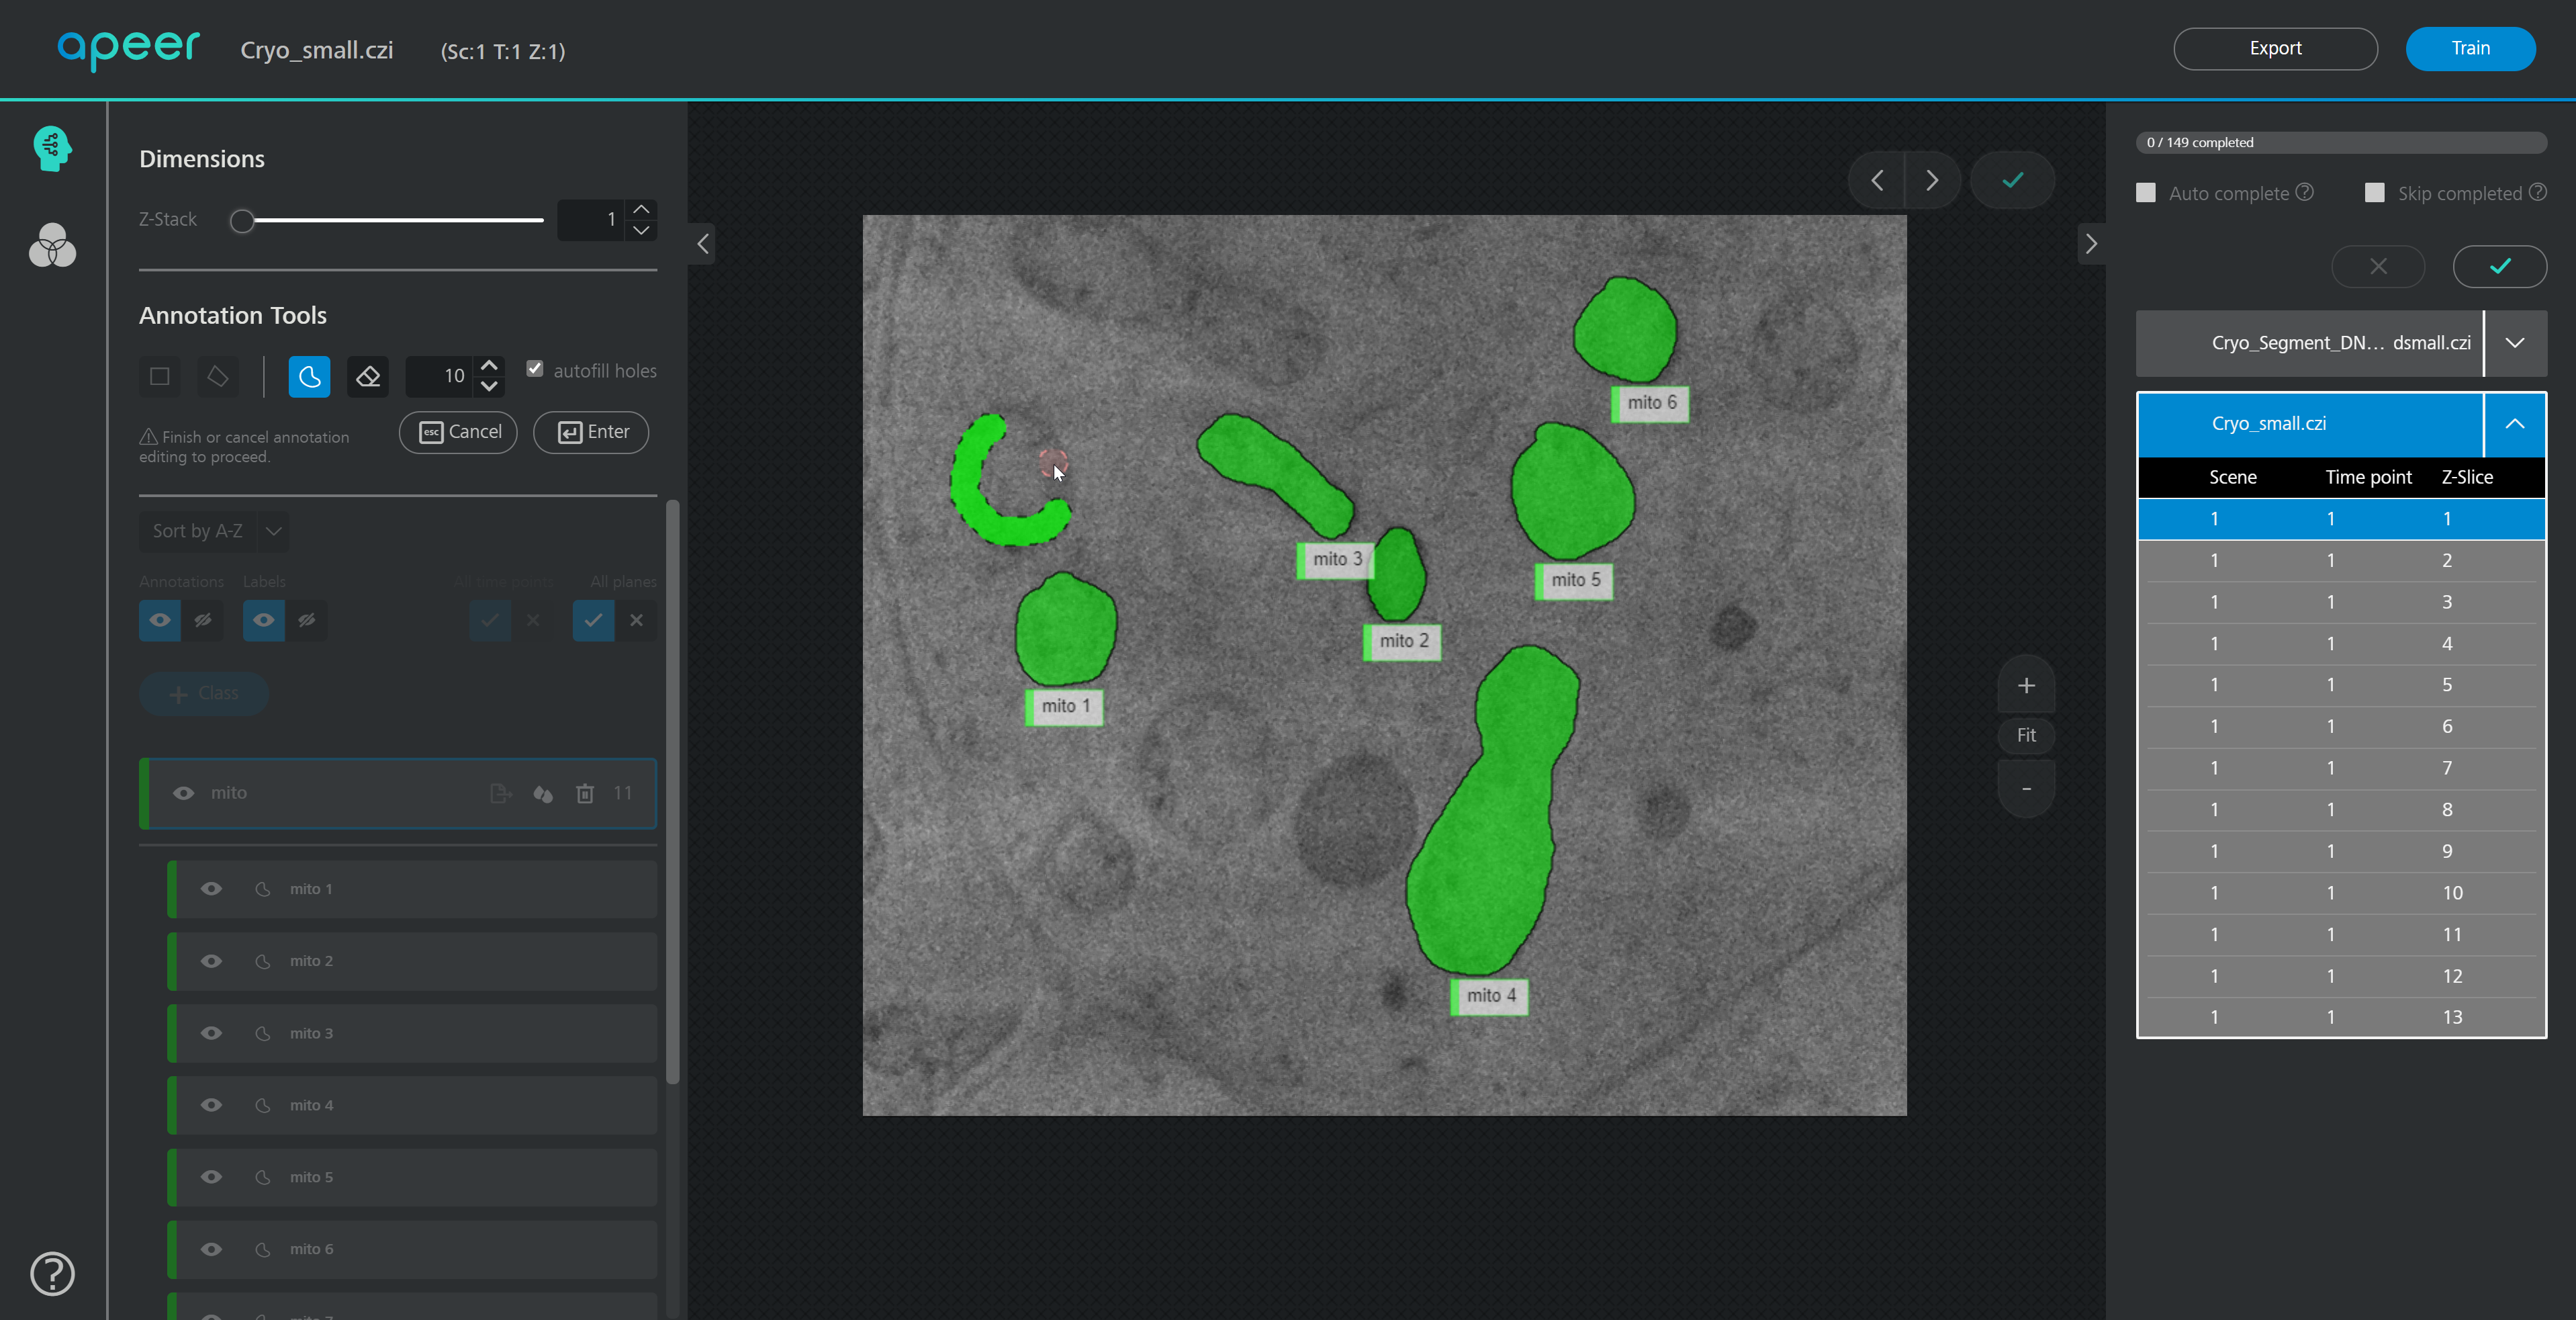
Highlights Aarivis AI

  • Web-based tool to label datasets to train Deep Neural Networks
  • Fully automated hyper-parameter tuning
  • Export of trained models for semantic segmentation and AIModelContainer for Instance Segmentation
Annotation Tool

APEER Annotation Tool

Description

Quantitative Criterion Acquisition Network (QCA Net) performs instance segmentation of 3D fluorescence microscopic images. QCA Net consists of Nuclear Segmentation Network (NSN) that learned nuclear segmentation task and Nuclear Detection Network (NDN) that learned nuclear identification task. QCA Net performs instance segmentation of the time-series 3D fluorescence microscopic images at each time point, and the quantitative criteria for mouse development are extracted from the acquired time-series segmentation image. The detailed information on this program is described in our manuscript posted on bioRxiv.

has function
Description

This note presents the design of a scalable software package named ImagePy for analysing biological images. Our contribution is concentrated on facilitating extensibility and interoperability of the software through decoupling the data model from the user interface. Especially with assistance from the Python ecosystem, this software framework makes modern computer algorithms easier to be applied in bioimage analysis.

Description

It implements the template matching function from the OpenCV library. The java interface of OpenCV was done through the javacv library. It is quite similar as the existing template matching plugin but runs much faster and users could choose among six matching methods: 

1.Squared difference

2.Normalized squared difference

3.Cross-correlation

4.Normalized cross-correlation

5.Correlation coefficient

6.Normalized correlation coefficient

The detailed algorithms could be found here.

The cvMatch_Template will search a specific object (image pattern) over an image of interest by the user-specified method. 

Description

Neuroconductor is an open-source platform for rapid testing and dissemination of reproducible computational imaging software, specialized in brain medical imaging (MRI, fMRI, DTI, etc...) but that could be used on a wider range of images. The goals of the project are to:

  • provide a centralized repository of R software dedicated to image analysis;
  • disseminate quickly software updates;
  • educate a large, diverse community of scientists using detailed tutorials and short courses;
  • ensure quality via automatic and manual quality controls; and
  • promote reproducibility of image data analysis.


Based on the programming language R, Neuroconductor starts with 68 inter-operable packages that cover multiple areas of imaging including visualization, data processing and storage, and statistical inference. Neuroconductor accepts new R package submissions, which are subject to a formal review and continuous automated testing.

has function
Description

CaPTk is a software platform for analysis of radiographic cancer images, currently focusing on brain, breast, and lung cancer. CaPTk integrates advanced, validated tools performing various aspects of medical image analysis, that have been developed in the context of active clinical research studies and collaborations toward addressing real clinical needs. With emphasis given in its use as a very lightweight and efficient viewer, and with no prerequisites for substantial computational background, CaPTk aims to facilitate the swift translation of advanced computational algorithms into routine clinical quantification, analysis, decision making, and reporting workflow. Its long-term goal is providing widely used technology that leverages the value of advanced imaging analytics in cancer prediction, diagnosis and prognosis, as well as in better understanding the biological mechanisms of cancer development.

CaPTk
Description

NiftyNet is a TensorFlow-based open-source convolutional neural networks (CNNs) platform for research in medical image analysis and image-guided therapy. NiftyNet’s modular structure is designed for sharing networks and pre-trained models. Using this modular structure you can:

  • Get started with established pre-trained networks using built-in tools;
  • Adapt existing networks to your imaging data;
  • Quickly build new solutions to your own image analysis problems.
Description
HyphaTrackerWorkflow
HyphaTracker Workflow

HyphaTracker propose a workflow for time-resolved analysis of conidia germination. Each part of this workflow can also be used independnatly , as a toolbox. It has been tested on bright-field microscopic images of conidial germination. Its purpose is mainly to identify the germlings and to remove crossing hyphae, and measure the dynamics of their growth.

hyphatracker
Description

LimeSeg: A coarsed-grained lipid membrane simulation for 3D image segmentation

Download instruction:

There is no download but you can easily install this plugin via ImageJ update site. If you reallu need to download the jar file, access the file in the update site repository (Link)

has function
Description

"An open source machine learning framework for everyone "

TensorFlow™ is an open source software library for high performance numerical computation. Its flexible architecture allows easy deployment of computation across a variety of platforms (CPUs, GPUs, TPUs), and from desktops to clusters of servers to mobile and edge devices. Originally developed by researchers and engineers from the Google Brain team within Google’s AI organization, it comes with strong support for machine learning and deep learning and the flexible numerical computation core is used across many other scientific domains.

has topic
TensorFlow
Description

The MIPAV (Medical Image Processing, Analysis, and Visualization) application enables quantitative analysis and visualization of medical images of numerous modalities such as PET, MRI, CT, or microscopy. Using MIPAV's standard user-interface and analysis tools, researchers at remote sites (via the internet) can easily share research data and analyses, thereby enhancing their ability to research, diagnose, monitor, and treat medical disorders.

Description

Multicut workflow for large connectomics data. Using luigi for pipelining and caching processing steps. Most of the computations are done out-of-core using hdf5 as backend and implementations from nifty