Java

Description

This plugin achieves easy creation of image figures for publications, reports, projects.

  • Easy-to-design interactive figure layout.

  • Visually assign image content to panels.

  • High-quality image scaling and rotation.

  • Easy and consistent panel labels and scale bars.

  • Each panel has it's original datasource's properties and tracks achieved image processing.

  • Save and re-open editable figures.

  • Export as standard image formats with textual description of each panel history.

Compared to Make montage, the plugin adds more flexibility to montage creation: Easy-to-design interactive figure layout. Visually assign image content to panels. High-quality image scaling and rotation. Easy and consistent panel labels and scale bars. Each panel has it's original data source's properties and tracks achieved image processing. Save and re-open editable figures. Export as standard image formats with textual description of each panel history. 

has topic
has function
FigureJ
Description

hIPNAT (hIPNAT: Image Processing for NeuroAnatomy and Tree-like structures) is a set of tools for the analysis of images of neurons and other tree-like morphologies. It is written for ImageJ, the de facto standard in scientific image processing. It is available through the ImageJ Neuroanatomy update site.

need a thumbnail
Description

Summary

QuimP is software for tracking cellular shape changes and dynamic distributions of fluorescent reporters at the cell membrane. QuimP's unique selling point is the possibility to aggregate data from many cells in form of spatio-temporal maps of dynamic events, independently of cell size and shape. QuimP has been successfully applied to address a wide range of problems related to cell movement in many different cell types. 

Introduction

In transmembrane signalling the cell membrane plays a fundamental role in localising intracellular signalling components to specific sites of action, for example to reorganise the actomyosin cortex during cell polarisation and locomotion. The localisation of different components can be directly or indirectly visualised using fluorescence microscopy, for high-throughput screening commonly in 2D. A quantitative understanding demands segmentation and tracking of whole cells and fluorescence signals associated with the moving cell boundary, for example those associated with actin polymerisation at the cell front of locomoting cells. As regards segmentation, a wide range of methods can be used (threshold based, region growing, active contours or level sets) to obtain closed cell contours, which then are used to sample fluorescence adjacent to the cell edge in a straightforward manner. The most critical step however is cell edge tracking, which links points on contours at time t to corresponding points at t+1. Optical flow methods have been employed, but usually fail to meet the requirement that total fluorescence must not change. QuimP uses a method (ECMM, electrostatic contour migration method (Tyson et al., 2010) which has been shown to outperform traditional level set methods. ECMM minimises the sum of path lengths connecting all pairs of points, equivalent to minimising the energy required for cell deformation. The original segmentation based on an active contour method and outline tracking algorithms have been described in (Dormann et al., 2002; Tyson et al., 2010; Tyson et al., 2014).

Screenshot
Description

The Sprout Morphology plugin measures sprout number, length, width and cell density of endothelial cell (EC) sprouts grown in a bead sprouting assay. It optionally includes measuring the coverage of these sprouts with pericytes included in the assay, as well as the endothelial cell/pericyte ratio.

graphical abstract
Description

Spot detector detects and counts spots, based on wavelet transform.

- Detects spots in noisy images 2D/3D.
- Depending on objective, spots can be nuclei, nucleus or cell
- Versatile input: sequence or batch of file.
- Detects spot in specific band/channel.
- Multi band labeling: automaticaly creates ROIs from one band and count in the same or an other band.
- Filters detection by size.
- Sort detection by ROIs
- Output data in XLS Excel files: number of detection by ROIs, and each detection location and size.
- Outputs withness image with ROIs and detection painted on it.
- Outputs binary detection image.
- Displays detections
- Displays tags

logo spot detector
Description

WormGUIDES Atlas is an interactive 4D portrayal of neural development in C. elegans. It will ultimately contain nuclear positions for every cell in the embryo, identified and tracked from the 2 cell stage until hatching. Single-cell and subcellular information, including neural outgrowth dynamics for each cell as well as cell function, gene expression, the adult neural connectome and related literature will be collated for each cell from public sources and also integrated with the atlas model. WormGUIDES Atlas integrates tools for exploratory data analyses and insight sharing. Navigation is linked between 3D and lineage tree views. In both contexts, community single cell information can be accessed with a click, creating live web queries that summarize knowledge about a cell. In many cases this information can be used to control cell color, creating customized interactive visualizations. A user's insights can be annotated directly into the embryo model with a note-taking interface that attaches each annotation to a cell or other point in space and time. These multi-dimensionally located notes can then be ordered into a (chrono)logical story sequence that explains developmental events as they unfold in the embryo. Annotations can be saved and shared with collaborators or the community.

WormGuides screenshot
Description

Bio Image Analysis tool from REF

logo ImageJ
Description

SRRF is a high-performance analytical approach for Live-cell Super-Resolution Microscopy, provided as a fast GPU-enabled ImageJ plugin. SRRF is capable of extracting high-fidelity super-resolution information from TIRF, widefield and confocals using conventional fluorophores such as GFP. SRRF is capable of live-cell imaging over timescales ranging from minutes to hours.

Comparison TIRF - SRRF
Description

CellProfiler is free, open-source software for quantitative analysis of biological images.

CellProfiler is designed to enable biologists without training in computer vision or programming to quantitatively measure cell or whole-organism phenotypes from thousands of images automatically. The researcher creates an analysis pipeline from modules that find cells and cell compartments, measure features of those cells to form a rich, quantitative dataset that characterizes the imaged site in all of its heterogeneity. CellProfiler is structured so that the most general and successful methods and strategies are the ones that are automatically suggested, but the user can override these defaults and pull from many of the basic algorithms and techniques of image analysis to solve harder problems. CellProfiler is extensible through plugins written in Python or for ImageJ. Strengths: Cells, Neurons, C. Elegans, 2D Fluorescent images, high-throughput screening, phenotype classification, multiple stains/site, interoperability, extensibility, machine learning, segmentation Limitations: largely limited to 2D, not well suited to manually-guided analysis or content review, image size limitations

Description

QuPath is open source software for Quantitative Pathology. QuPath has been developed as a research tool at Queen's University Belfast.

QuPath
Description

This is a Java content-based image retrieval software components. It can be runned independantly or connected to a Cytomine server. Content-based image retrieval (CBIR), also known as query by image content (QBIC) and content-based visual information retrieval (CBVIR) is the application of computer vision techniques to the image retrieval problem, that is, the problem of searching for digital images in large databases. Content-based" means that the search algorithm analyzes the contents of the image rather than the metadata such as keywords, tags, or descriptions associated with the image. The term "content" in this context might refer to colors, shapes, textures, or any other information that can be derived from the image itself. The CBIRetrieval library is: Incremental: You can add new images all over the time. Scalable: Run as many server as you want. Client performs search on all servers. Flexible: Run as a simple app (command line) or use the JAR in your own JVM app/server (java import) Opensource/Free: Apache 2.0 CBIRetrieval is a java library for CBIR, CBIRest is a server with a REST HTTP API with CBIRetrieval embedded. If you want to connect a software/webapp with a CBIR engine, you should use CBIRest. This is a fast multi-threaded and noSQL implementation of the algorithm published in: Incremental Indexing and Distributed Image Search using Shared Randomized Vocabularies Marée, Raphaël; Denis, Philippe; Wehenkel, Louis; Geurts, Pierre,in ACM Proceedings MIR 2010 (2010, March). It was applied on histology images and radiology images.

need a thumbnail
Description

SIMcheck is an ImageJ plugin suite for assessing the quality and reliability of Structured Illumination Microscopy (SIM) data. The quality of the raw data, the quality of the reconstruction and the calibration of the microscope can be tested. 

has function
Simcheck screenschot
Description

Automatic registration in 2D or 3D based on detection or binary mask. Takes images with detections already done on it.

logo autofinder
Description

A resident function in ImageJ, located in the menu as [Process > Binary > Voronoi].

Quote from the ImageJ reference page:

Splits the image by lines of points having equal distance to the borders of the two nearest particles. Thus, the Voronoi cell of each particle includes all points that are nearer to this particle than any other particle. When particles are single points, this process is a Voronoi tessellation (also known as Dirichlet tessellation). The output type (Overwrite, 8-bit, 16-bit or 32-bit) of this command can be set in the [Process > Binary > Options...] dialog box. In the output, the value inside the Voronoi cells is zero; the pixel values of the dividing lines between the cells are equal to the distance between the two nearest particles. This is similar to a medial axis transform of the background, but there are no lines in inner holes of particles.


Description

XuvTools (pronounced “ex-you-vee-tools”) is a fully automated 3D stitching software for biomedical image data, typically confocal microscopy images. XuvTools runs on Microsoft Windows XP and Vista, Linux and Apple Mac computers. It supports 32 and 64bit operating systems (with 64bit highly preferred). XuvTools is free and open source software (see Licensing), so you can start using it immediately. Go to Downloads and give it a try. The goal of XuvTools is to provide tools, that combine multiple microscopic recordings to obtain a larger field of view (“stitching”) and a higher dynamic range (“HDR” recombination), or better resolution (multi view reconstruction), and to make these tools publicly available.

need a thumbnail
Description

This software is designed for the rapid semi-automatic detection and quantification of synaptic protein puncta from 2D immunofluorescence images generated by confocal laser scanning microscopy.

need a thumbnail
Description

SuReSim (Super Resolution Simulation) is an open-source simulation software for Single Molecule Localization Microscopy (SMLM). The workflow of the SuReSim algorithm starts from a ground truth structure and lets the user choose to either directly simulate 3D localizations or to create simulated *.tiff-stacks that the user can analyze with any given SMLM reconstruction software. A 3D structure of any geometry, either taken from electron microscopy, designed de-novo from assumptions or known structural facts, is fluorophore-labeled in silico. A defined set of parameters is used to calculate and visualize the 3D localizations of the corresponding labels. The software package is accompanied with a library of model structures that can be imported and simulated. Users manual with tutorial provided.

SureSim screenshot
Description

ThunderSTORM is an open-source, interactive, and modular plug-in for ImageJ designed for automated processing, analysis, and visualization of data acquired by single molecule localization microscopy methods such as PALM and STORM. Our philosophy in developing ThunderSTORM has been to offer an extensive collection of processing and post-processing methods so that users can easily adapt the process of analysis to their data.

need a thumbnail
Description

This is an ImageJ plugin to analyze bacterial cells. It provides a user-friendly interface and a powerful suite of detection, analysis and data presentation tools. It works with individual phase or fluorescence images as well as stacks, hyperstacks, and folders of any of these types. Even large image sets are analyzed rapidly generating raw tabular data that can either be saved or copied as is, or have additional statistical analysis performed and graphically represented directly from within MicrobeJ, making it an all-in-one image analysis solution.

need a thumbnail
Description

An easy-to-use plugin that provides SR-SIM reconstructions for a wide range of SR-SIM platforms directly within ImageJ. For research groups developing their own implementations of super-resolution structured illumination microscopy, fairSIM takes away the hurdle of generating yet another implementation of the reconstruction algorithm. For users of commercial microscopes, it offers an additional, in-depth analysis option for their data independent of specific operating systems. As a modular, open-source solution, fairSIM can easily be adapted, automated and extended as the field of SR-SIM progresses. 2662


has function
from FairSIM documentation
Description

MorphoLibJ is a library of plugin for ImageJ with functionalities for image processing such as filtering, reconstructing, segmenting, etc... Tools are based on Mathematical morphology with more rigorous mathematical approach than in the standard tools of ImageJ in particular for surface (or perimeter) measurements which are usually based on voxel counting.  

http://imagej.net/MorphoLibJ#Measurements

Among the features:

Morphological operations :  Dilation, Erosion, Opening,  Closing , Top hat (white and black), Morphological gradient (aka Beucher Gradient), Morphological Laplacian, Morphological reconstruction, Maxima/Minima , Extended Maxima/Minima -Watershed (classic or controlled) -Image overlay -Image labelling -Geodesic diameter -Region Adjacency Graph -Granulometry curves, morphological image analysis.


several steps of morphological segmentation of plant tissue using MorphoLibJ.
Description

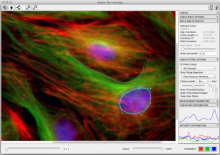
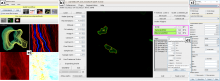
Cytomine is a rich internet application using modern web and distributed technologies (Grails, HTML/CSS/Javascript, Docker), databases (spatial SQL and NoSQL), and machine learning (tree-based approaches with random subwindows) to foster active and distributed collaboration and ease large-scale image exploitation.

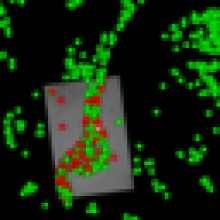
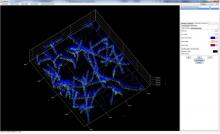
It provides remote and collaborative principles, rely on data models that allow to easily organize and semantically annotate imaging datasets in a standardized way (using user-defined ontologies associated to regions of interest), efficiently support high-resolution multi-gigapixel images (incl. major digital scanner image formats), and provide mechanisms to readily proofread and share image quantifications produced by any image recognition algorithms.

By emphasizing collaborative principles, the aim of Cytomine is to accelerate scientific progress and to significantly promote image data accessibility and reusability. Cytomine allows to break common practices in this domain where imaging datasets, quantification results, and associated knowledge are still often stored and analyzed within the restricted circle of a specific laboratory.

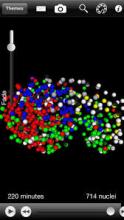
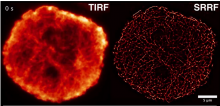
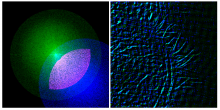
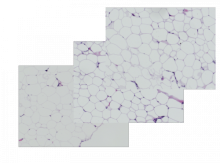
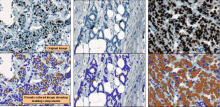
This software is e.g. being used by life scientists in to help them better evaluate drug treatments or understand biological processes directly from whole-slide tissue images (digital histology), by pathologists to share and ease their diagnosis, and by teachers and students for pathology training purposes. It is also used in various microscopy applications.

Cytomine can be used as a stand-alone application (e.g. on a laptop) or on larger servers for collaborative works.

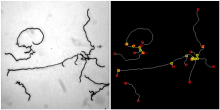
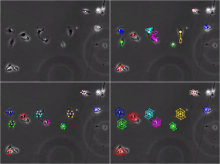
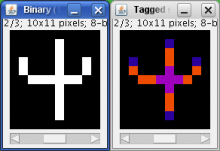
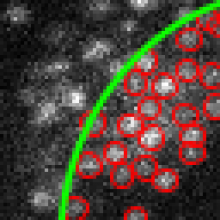
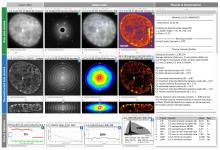
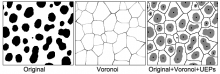
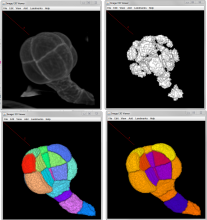
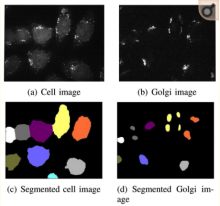
Cytomine implements object classification, image segmentation, content-based image retrieval, object counting, and interest point detection algorithms using machine learning.

cytomine logo
Description

This workflow will batch process a directory of images: - comets should be horizontally oriented, tails to the right. Additional preprocessing is required if the gel does not match with this orientation (Rotate images, Using ImageJ/Transform Image or TransformJ plugin for example). Then using the plugin:

  1. Uneven background correction
  2. Automatic detection of comet shapes with outliers detection
  3. Automatic detection of the heads of comets (brightest region or profile analysis)
  4. Statistical values of tails, heads and Olive moments.
  • Manual correction is available.
  • Does live analysis with Micro-Manager
Description

Adiposoft is an automated Open Source software for the analysis of adipose tissue cellularity in histological sections.

Example data can be found on the plugin description page in ImageJ wiki (download link). There is also a link to a MATLAB version of the workflow.

has topic
Description

A Java Package for Geometrical Image Transformation, works up to 5D.

  • Affine
  • Crop
  • Embed
  • Matrix
  • Mirror
  • Rotate
  • Scale
  • Translate
  • Turn
Description

Manual Tracking GUI. Many shortcut keys, and after being experienced, manual tracking can efficiently done. Post-editing capability to delete segments, merge and splitting tracks is quite useful.

has function
Description

Fluorescence spectroscopy by image correlation is a technique that allows analysing and characterizing the different molecular dynamics from a sequence of fluorescence images. Many image correlation techniques have been developed for different applications but in particular to study the mechanisms of cell adhesion during migration. These techniques can be used with most imaging modalities: e.g. fluorescence widefield, confocal microscopy, TIRFM. They allow to obtain information such as the density in molecules, diffusion coefficients, the presence of several populations, or the direction and speed of a movement corresponding to active transport when spatial and temporal correlations are taken into account (STICS: Spatio-Temporal Image Correlation Spectroscopy).

This plugin is based on ICS_tools plugin by Fitz Elliott, available here.

Some bugs have been removed, ROI does not need to be squared, fitting is weighted in order to give more weight to the smaller lags (temporal or spatial)

Exemple of use on sample data [fluorescent beads](http://biii.info/node/2577 "Beads") - Select an ROI, start by ICS to get the right PSF size - Then run TICS and select diffusion, or diffusion plus flow model. Remove the first line (autocorrelation) which corresponds to the noise autocorrelation before fitting.

interface
Description

HDF5 is a data format for storing extremely large and complex data collections. This Fiji/ImageJ HDF5 plugin saves and loads 2D - 5D datasets with flexible options.

In Fiji, the plugin is downloadable via update site "HDF5".

Description

ImageJ plugin to analyze changes in vessel diameters, described in Fernández er al (2014). More specifically the paper describes the measurement of isolated retinal arterioles (ca 50 micrometer diameter) but can be used for diameter measurements of similar vessel structures.

Description

A workflow template to analyze subcellular structures in fluorescence 2D/3D microscopy images based on a Fiji plugin **Squassh** is described in Rizek et al (2014).

The workflow employs detecting, segmenting, and quantifying subcellular structures. For segmentation, it accounts for the microscope optics and for uneven image background. Further analyses include both colocalization and shape analyses. However, it does not work directly for time-lapse data. A brief summary note can be found here.

Description

The ImageJ pligin, called PixFRET, allows a simple and rapid determination of channel bleed-through parameters and the display of normalized FRET images. see 2521


Input data type: 

Stacks with 2 channels (controls for bleed-through calculation) or 3 channels (FRET calculation)

Output data type: 

One Image with FRET values and One image with normalized FRET values

Description

Quantification of HER2 immunohistochemistry.

ImmunoMembrane is an ImageJ plugin for assessing HER2 immunohistochemistry, described in [bib]2472[/bib]. It is important to read the URL documentation and original paper to understand how to use the plugin appropriately.

There is web service available. Users can upload image data to process them and get cell membrane to be segmented: Web ImmunoMembrane

Note also that the pixel size is not read automatically from the image, but rather the source image scale should be entered into the dialog box - and the image rescaled accordingly prior to analysis. This scale value is the inverse of the value normally found for pixel width and pixel height under Image -> Properties... (i.e. pixel width & height are given in microns per pixel; the dialog box asks for pixels per micron).

has topic
Description

CellX is an open-source software package of workflow template for cell segmentation, intensity quantification, and cell tracking on a variety of microscopy images with distinguishable cell boundary.

Installation and step-by-step usage details are described in Mayer et al (2013). 

After users provide a few annotations of cell sizes and cell boundary profiles, it tries to match boundary profile pattern on cells thus provide segmentation and further tracking. It works the best on cells without extreme shapes and with a rather homogeneous boundary pattern. It may not work well on images with cells of sizes only a few pixels. Its output comprises control images for visual validation, text files for post-processing statistics, and MATLAB objects for advanced subsequent analysis.

Description

The Fiji distribution of ImageJ comes with several manual tracking tools, two of which are particularly useful:

* _Plugins->Tracking->Manual Tracking_

* _Plugins->Tracking->Manual tracking with TrackMate_ (TrackMate is an advanced automatic tracking tool, with the option for manual editing of tracks)

The _Manual Tracking_ plugin is quick to use, intuitive and produces easy-to-understand output. TrackMate has the advantage that automatic detection and linkage can be combined with manual input.

Update sites

MtrackJ (see the component page here) can be installed via Fiji update sites. It has many shortcut keys enabled so for manually tracking many data, it will become quite efficient as you get used to the short-cut key operation.

Pre-processing

Pre-processing steps before manual tracking might include:

* denoising and/or deconvolution

* flicker and photobleaching correction, e.g. using Fiji's _Image->Adjust->Bleach Correction_

* flat-field correction, and/or bandpass (ImageJ's _Process->FFT->Bandpass filter_) according to the size of the features of interest

has function
Description
QuickPALM is a set of programs to aid in the acquisition and image analysis of data in “photoactivated localization microscopy” (PALM) and “stochastic optical reconstruction microscopy” (STORM). QuickPALM features the associated QuickPALM ImageJ plugin, which enables PALM/STORM 2D/3D/4D particle detection and image reconstruction in ImageJ.
need a thumbnail
Description

Analyzing Ca2+ sparks

ImageJ plugin to detect and measure Ca2+ sparks in linescan images, described in Picht et. al. (2007). The algorithm is based on that described by Cheng et al. (1999). Care should be taken to ensure that detections belong to 'true' events, as without any additional background subtraction steps the algorithm is not appropriate for images in which the baseline fluorescence varies substantially.

Description

Simple spatial filters can be used to suppress noise in raw image data (i.e. by averaging intensities). The best choice of filter depends on the nature of the noise, but Gaussian filtering works well for Poisson noise (i.e. commonly observed photon-counting shot noise); whereas a median filter is ideal for salt-and-pepper noise. A larger filter radius leads to stronger noise suppression but more blurring. The URL above describes the simple 2D spatial filters available in ImageJ, but similar filters are available in most software. For 3D data, 3D versions of these filters work best (since there are more pixels to average within the same radius).

has function
need a thumbnail
Description

Analyzing ER, PR, and Ki-67 immunohistochemistry

ImmunoRatio is an ImageJ plugin to quantify haematoxylin and DAB-stained tissue sections by measuring the percentage of positively stained nuclear area (labeling index), described in [bib]2452[/bib].

Notes for use:

  • It is important to read the URL instructions and original paper to understand what is being measured. In particular, the primary measurement made is percentage of the total nuclear area, not the percentage of detected nuclei (the latter being the more common method of assessing e.g. Ki67). This may be further modified by the Result correction equation.
  • Ultimately ImmunoRatio relies on thresholding (color deconvolved [bib]2451[/bib]) images to define 'nucleus' vs 'non-nucleus' regions according to staining intensity. Therefore dark artefacts, such as tissue folds, are likely to cause errors.
  • The pixel size is not read automatically from the image, but rather the source image scale should be entered into the dialog box - and the image rescaled accordingly prior to analysis. This scale value is the inverse of the value normally found for pixel width and pixel height under Image -> Properties... (i.e. pixel width & height are given in microns per pixel; the dialog box asks for pixels per micron).

Web application: ImmunoRatio

Example Image: Sample ImmunoRatio results

References

  1. [2452] Tuominen VJRuotoistenmäki SViitanen AJumppanen MIsola J.  2010.  ImmunoRatio: a publicly available web application for quantitative image analysis of estrogen receptor (ER), progesterone receptor (PR), and Ki-67.. Breast Cancer Res. 12(4):R56.
  2. [2451] Ruifrok ACJohnston DA.  2001.  Quantification of histochemical staining by color deconvolution.. Anal Quant Cytol Histol. 23(4):291-9.
has topic
has function
Description

This macro and plugins suite for ImageJ (and Fiji) serves to measure the velocity of moving structures and visualize them, from image time series (2D over time).

The module can be installed in ImageJ as a Macro Menu and each function/component can be called separately. The full workflow consists in calling some, or all, the functions sequentially in order to get from the image preparation (e.g. filtering and visualization of tracks) to the production of the kymographs (time vs. distance plot) and their analysis (retrieving the velocities).

Here is the full workflow sequence:

  • Load image sequence
  • Crop and time-filter the image sequence ("Walking average" plugin)
  • Generate tracks by z-projection ("Stack difference" plugin)
  • Select tracks and restore them in the original stack.
  • execute plugin "multiple kymograph"
  • Analyse: select edges of moving tracks graphically and quantify movement in a table.

input: 8-bit, 16-bit stacks, 2D in time. Calibrated is better for meaningful velocity measurements.

ouput: the kymograph image, the velocity measurements tables.

Requires ImageJ version: 1.33.n minimum.

Example of applications:

  • velocity of moving objects/ structures with sharp edges, incl. the velocity of microtubules (and their plus ends),
  • the velocity of vesicles or particles along a 2D path
  • the velocity of migration of the edge of a cell or a multicellular group
  • retraction velocity of contractile bundles (e.g. actin fibers) or multicellular tissues after mechanical disruption (e.g. laser surgery)
Description

An exponential curve fitting library used for Fluorescence Lifetime Imaging (FLIM) and Spectral Lifetime Imaging (SLIM), available as:

Publications:

Description

Segmentation of Golgi.

Sample Images can be found here.

has function
Description
Quote The application Bio7 is an integrated development environment for ecological modelling and contains powerful tools for model creation, scientific image analysis and statistical analysis. The application itself is based on an RCP-Eclipse-Environment (Rich-Client-Platform) which offers a huge flexibility in configuration and extensibility because of its plug-in structure and the possibility of customization.
need a thumbnail
Description

BioImage Analysis Tool for all! Also check out ImageJ2

need a thumbnail

Icy

Description

Reproducing an experiment doesn’t stop at the bench when images are concerned. Icy is an open source bioimaging software package that aims to provide a framework for authors to share, and others to reproduce, research once the sample hits the microscope. Icy was released in April 2011 and is being developed at the Quantitative Image Analysis Unit at the Pasteur Institute in France by Jean-Christophe Olivo-Marin and his team. The goal is to provide standardized software architecture, with a visual programming framework and online repository of plugins and protocols, brought together with sophisticated content-management and communication systems for such extended reproducible research. Icy provides intuitive user interfaces for graphical protocol development for image acquisition, analysis and storage that are easy to use for biologists and developers alike. Developers should find that Icy’s ‘EzPlug’ API library, versioning, and auditing tools make creating a custom plugin from most any source easy. Users will find the automatic error reporting, central repository and on-line community hub great for storing and sharing plugins and protocols. Icy is even developing a cloud-computing framework to address the scalability issues of high-content screening. As of this writing there are 207 plug-ins 50 scripts and 14 protocols available for download, including those for microscope control, particle tracking, three dimensional segmentation, and even spot detection using wavelets.

Published in Nature Methods (Nat Methods 9(7):690-6 (2012)). Icy can be downloaded at http://icy.bioimageanalysis.org/ Strength: Open-source. Centralized repository of 205 plugins, 50 scripts and 14 protocols


Rate and comment plugins 5D Search and install features directly from Icy Graphical programming with protocols Write scripts in javascript or python Automatic bug reports Native ImageJ integration 100% compatible Native Micro-Manager integration Share your plugins and protocols online Can run headless Intuitive user interface Online management of plugins Connect Icy to Matlab Interactive widgets Build your graphical interface with EzPlug Use the power of your graphic card with OpenCL Loaded with 20 up-to date libs Weaknesses No tutorial for plugins writing..yet See here: http://icy.bioimageanalysis.org/index.php?display=devDoc http://icy.bioimageanalysis.org/index.php?display=detailTag&tagId=29 and here: http://icy.bioimageanalysis.org/index.php?display=startDevWithIcy and also here: http://icy.bioimageanalysis.org/index.php?display=startDevWithIcy Image size limited to 2GigaByte per single 2D channel (means that an image of 40.000x40.000 can be handle by Icy. Still big !) Still you can have a stack of 100000x40Kx40kxUnlimited number of channel if you have RAM. Will be improved

Icy
Description

ImgLib2 is a generic, multi-dimensional data processing library allowing for processing algorithms to be defined in a data-type, dimension, and container independent manner. Due to its interface-based design, it is easy to write adapters to virtually all existing data containers. It is the basis of KNIME, ImageJ2 and a couple of Fiji plugins.

need a thumbnail
Description

Fiji is just ImageJ: a distribution of ImageJ (and ImageJ2) together with Java, Java 3D and a lot of plugins organized into a coherent menu structure. The main focus of Fiji is to assist research in life sciences. It is a free, open-source, community-driven project.

Fiji
Description

OMERO is a free, open source image management software. It is client-server based system which supports 5D images, including big images and high-content screening data. Data are stored on a server using relational database. They are accessed using 3 main clients, a desktop client, a web client and a command line tool. There are bindings from OMERO to other image analysis packages, like FLIMfit, OMERO.searcher. The data in OMERO are organized in groups. A user can be a member of one or more groups. This groups can be collaborative or private, there are 4 levels of permissions to access/edit/annotate/delete the data of other users.

The package is supported not only by community forums, but also by a dedicated team which helps users to solve their problems and deals with the bugs submitted via error submission system.

###Strengths

Open source, scalable software, Supports diverse sets of imaging applications and domains (EM,LM, HCS, DigPath) Cross-platform, Java-based application, API support for Java, Python, C++, Django, On-line Forums, Automatic QA and upload of software errors Multi-dimensional images, Web access, Free Demo-server accounts

Limitations

Enterprise-scale software, so complex install, requires expertise, Actively developing API, Python scripts and functions still developing

Omero
Description

‘’’Squassh’’’ is a tool for 2D and 3D segmentation and quantification of subcellular shapes in fluorescence microscopy images. It provides globally optimal detection and segmentation of objects with constant internal intensity distribution, followed by object-based colocalization analysis. The segmentation computed by Region Competition can optionally correct for the PSF of the microscope, hence providing optimally deconvolved segmentations. Part of the mosaic suite

Description

quote:

This plugin allows to apply a free affine transformation to a 2D image in an interactive way.

has function
Description

The purpose of this plugin is to register—in other words, to align or to match—two images, one of them being called the source image and the other the target image.

has topic
has function