Object tracking

Synonyms
Tracking
Description

Open source deep learning based framework for multi-animal pose tracking. It can track animal and any number of animals and has a labeling/training GUI for learning and proofreading.

has topic
has function
Description

Algorithm and software created to extract animal trajectories from videos of a collection of animals up to 100 individuals. Idtrackerai uses two convolutional networks: one for animal identification and another to detect when animals touch or cross each other.

has topic
has function
Description

OrganoID is an image analysis platform that automatically recognizes, labels, and tracks single organoids, pixel-by-pixel, in brightfield and phase-contrast microscopy experiments. The platform was trained on images of pancreatic cancer organoids and validated on separate images of pancreatic, lung, colon, and adenoid cystic carcinoma organoids.

need a thumbnail

MIA

Description

ModularImageAnalysis (MIA) is an ImageJ plugin which provides a modular framework for assembling image and object analysis workflows. Detected objects can be transformed, filtered, measured and related. Analysis workflows are batch-enabled by default, allowing easy processing of high-content datasets.

MIA is designed for “out-of-the-box” compatibility with spatially-calibrated 5D images, yielding measurements in both pixel and physical units.  Functionality can be extended both internally, via integration with SciJava’s scripting interface, and externally, with Java modules that extend the MIA framework. Both have full access to all objects and images in the analysis workspace.

Workflows are, by default, compatible with batch processing multiple files within a single folder. Thanks to Bio-Formats, MIA has native support for multi-series image formats such as Leica .lif and Nikon .nd2.

Workflows can be automated from initial image loading through processing, object detection, measurement extraction, visualisation, and data exporting. MIA includes near 200 modules integrated with key ImageJ plugins such as Bio-Formats, TrackMate and Weka Trainable Segmentation.

Module(s) can be turned on/off dynamically in response to factors such as availability of images and objects, user inputs and measurement-based filters. Switches can also be added to “processing view” for easy workflow control.

MIA is developed in the Wolfson Bioimaging Facility at the University of Bristol.

Description

LOBSTER (Little Objects Segmentation and Tracking Environment), an environment designed to help scientists design and customize image analysis workflows to accurately characterize biological objects from a broad range of fluorescence microscopy images, including large images, i.e. terabytes of data, exceeding workstation main memory.

  • 75 workflows available 
  • no programming, with GUI
  • matlab based 
Description

Cell tracking using MU-Lux-CZ algorithm. Dockerized Workflow for BIAFLOWS implemented by Martin Maska (Masaryk University).

has topic
has function
need a thumbnail
Description

Nuclei tracking in 2D time-lapse with Octave tracker (adapted from Matlab LOBSTER version).

has function
need a thumbnail
Description

Object tracking. For each time-frame, an image mask is obtained from median filtering (user defined radius), thresholding (user defined level) and hole filling. Convex objects are split apart by distance map watershed from regional intensity maxima (user defined noise tolerance), eroded (user defined radius) and analyzed as 3D particles (assuming some overlap between objects from a frame to the next frame). Finally, division events are analyzed and accounted for to relabel objects.

has function
need a thumbnail
Description

Fiji plugin for detecting, tracking and quantifying filopodia

EB1 tracking with Matlab

Submitted by Perrine on Mon, 04/08/2019 - 11:05

This module follow EB1 tracking with IJ. In this session, we will visualize the tracking results and also cover typical analysis protocols for the quantitative analysis of movement. Two dynamic numerical features could be extracted from tracking results: speed and direction. Estimation of movement speed from multiple trajectories is a popular indicator of movement, and we will quickly go over the method for estimating the average speed of EB1 movement along microtubule. Movement direction is another quantitative feature, but is rarely explored.

EB1 tracking with IJ

Submitted by Perrine on Mon, 04/08/2019 - 11:00

We take an example image data of microtubule binding protein EB1, and will study how to automatically track those signals and how to analyze the tracking results. We use ImageJ for measuring the temporal changes in signal positions, and will feed the tracking results for analyzing their dynamics using Matlab in the following session EB1 tracking with Matlab.

Description

Manual tracking using Trackmate plugin (comes with FIji, so no installation required if you are using Fiji). 

has function
Description

This method was originally designed to track objects (not necessarily spots) already identified in 2D 
frames and has been applied previously to particle tracking and analysis in high-speed atomic force microscopy image series.


need a thumbnail
Description
HyphaTrackerWorkflow
HyphaTracker Workflow

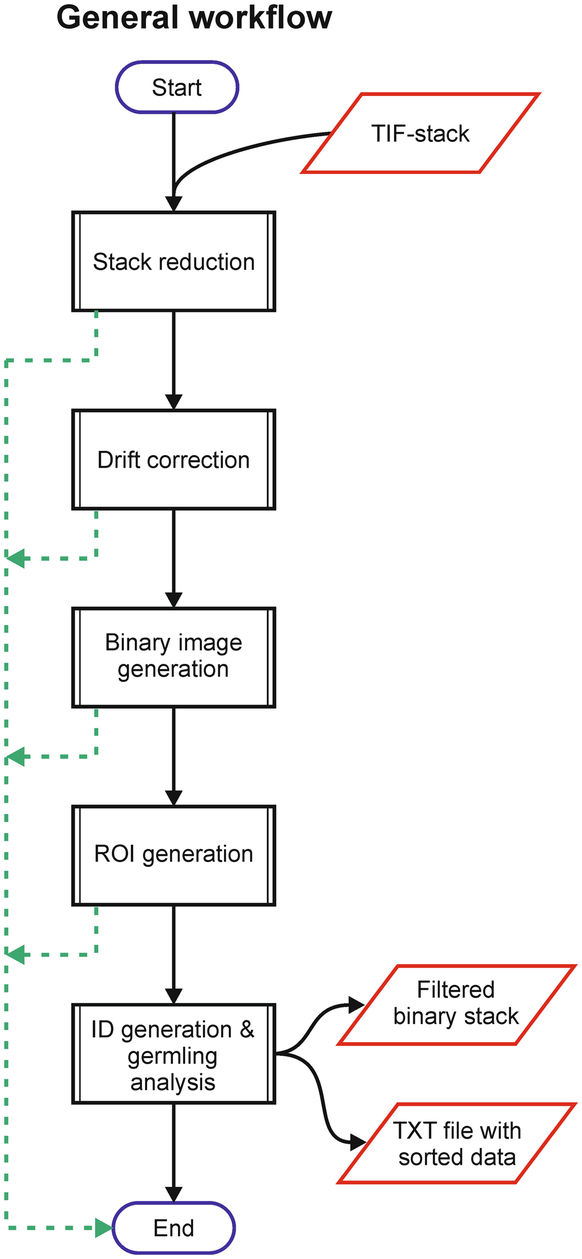
HyphaTracker propose a workflow for time-resolved analysis of conidia germination. Each part of this workflow can also be used independnatly , as a toolbox. It has been tested on bright-field microscopic images of conidial germination. Its purpose is mainly to identify the germlings and to remove crossing hyphae, and measure the dynamics of their growth.

hyphatracker
Description

MaMuT is an end user plugin that combines the BigDataViewer and TrackMate to provide an application that allow browsing, annotating and curating annotations for large image data.

Description

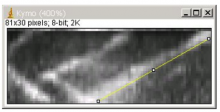
Kymograph generation under ImageJ:

one simple solution, plot a line (ROI line) on the first frame, where you want to generate the kymograph.

Use

Image  / Stacks  / Reslice

It will generate a new image were Y dimension is the time, and X the position on the line you have drawn.

need a thumbnail
Description

  FlyLimbTracker is  a method that uses active contours to semi-automatically track body and leg segments from video image sequences of unmarked, freely behaving Drosophila flies. This approach can be used to measure leg segment motions during a variety of locomotor and grooming behaviors.

For now the plugin have to be downlaoded directly from the EPFL website (see link), not from the search bar as usual in ICY.


Drosophila track legs
Description

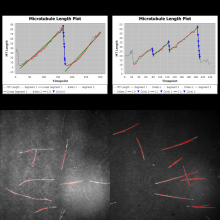
MTrack is a tool, which detects, tracks, and measures the behavior of fluorescently labeled microtubules imaged by TIRF (total internal reflection fluorescence) microscopy. In such an in vitro reconstitution approach, stabilized, non-dynamic microtubule seeds serve as nucleation points for dynamically growing microtubules.

MTrack is a bi-modular tool. The first module detects and tracks the growing microtubule ends and creates trajectories. The second module uses these trajectories to fit models of dynamic behavior (polymerization and depolymerization velocities, catastrophe and rescue frequencies). It also computes statistics such as length and lifetime distributions when analyzing more than one movie (batch mode).

has topic
Track Filament shaped objects and analyze tracks using Ransac fits.
Description

Summary

QuimP is software for tracking cellular shape changes and dynamic distributions of fluorescent reporters at the cell membrane. QuimP's unique selling point is the possibility to aggregate data from many cells in form of spatio-temporal maps of dynamic events, independently of cell size and shape. QuimP has been successfully applied to address a wide range of problems related to cell movement in many different cell types. 

Introduction

In transmembrane signalling the cell membrane plays a fundamental role in localising intracellular signalling components to specific sites of action, for example to reorganise the actomyosin cortex during cell polarisation and locomotion. The localisation of different components can be directly or indirectly visualised using fluorescence microscopy, for high-throughput screening commonly in 2D. A quantitative understanding demands segmentation and tracking of whole cells and fluorescence signals associated with the moving cell boundary, for example those associated with actin polymerisation at the cell front of locomoting cells. As regards segmentation, a wide range of methods can be used (threshold based, region growing, active contours or level sets) to obtain closed cell contours, which then are used to sample fluorescence adjacent to the cell edge in a straightforward manner. The most critical step however is cell edge tracking, which links points on contours at time t to corresponding points at t+1. Optical flow methods have been employed, but usually fail to meet the requirement that total fluorescence must not change. QuimP uses a method (ECMM, electrostatic contour migration method (Tyson et al., 2010) which has been shown to outperform traditional level set methods. ECMM minimises the sum of path lengths connecting all pairs of points, equivalent to minimising the energy required for cell deformation. The original segmentation based on an active contour method and outline tracking algorithms have been described in (Dormann et al., 2002; Tyson et al., 2010; Tyson et al., 2014).

Screenshot
Description

This is an ImageJ plugin to analyze bacterial cells. It provides a user-friendly interface and a powerful suite of detection, analysis and data presentation tools. It works with individual phase or fluorescence images as well as stacks, hyperstacks, and folders of any of these types. Even large image sets are analyzed rapidly generating raw tabular data that can either be saved or copied as is, or have additional statistical analysis performed and graphically represented directly from within MicrobeJ, making it an all-in-one image analysis solution.

need a thumbnail
Description

Manual Tracking GUI. Many shortcut keys, and after being experienced, manual tracking can efficiently done. Post-editing capability to delete segments, merge and splitting tracks is quite useful.

has function
Description

Quote: *SpotFinderZ (from now on simply SpotFinder) detects round, usually diffraction-limited spots inside bacterial cells outlined with MicrobeTracker and places them into the meshes structure produced by MicrobeTracker. The program is written in MATLAB and saves the data in the MicrobeTracker format by appending additional fields.*

has function
need a thumbnail
Description

The workflow consists of firstly identifying spot (which can be also gravity center of cells identified by another method), and then secondly compute trajectories by linking these spots by global optimisation with a cost function. This method is part of the methods evaluated in Chanouard et al (2014) as "method 9" and is described in detail in its supplementary PDF (page 65).

Dependencies

Following plugins are required.

  1. JAR to be placed under IJ plugin directory
  2. A pdf file with instructions and output description is also available in the zip .
  3. MTrackJ : Used for visualization of tracks. Preinstalled in Fiji.
  4. Imagescience.jar: This library is used by MTrackJ. Use update site to install this plugin.
  5. jama.jar. Preinstalled in Fiji.

##Advantages:

  • support blinking (with a parameters allowing it or not)
  • fast,
  • can be used in batch, some analysis results provided.
  • No dynamic model.
  • The tracking part is not dependent of ImageJ.

Pitfalls:

  • does not support division
  • the optimization algorithm used is a simulated annealing, so results can be slightly different between two runs.
  • No Dynamic model (so less good results but can be used for a first study of the kind of movements)

##The sample data

The parameters used for this example data Beads, were

  1. detection: 150
  2. the max distance in pixels: 20
  3. max allowed disappearance in frame: 1
Description

A collection for tracking microtubule dynamics, written in Python.

has function
Description

This Matlab code demonstrates an edge-based active contour model as an application of the Distance Regularized Level Set Evolution (DRLSE) formulation.

initialisation
Description

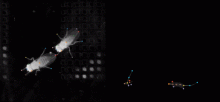
idTracker is a videotracking software that keeps the correct identity of each individual during the whole video. It works for many animal species including mice, insects (Drosophila, ants) and fish (zebrafish, medaka, stickleback). idTracker distinguishes animals even when humans cannot, such as for size-matched siblings, and reidentifies animals after they temporarily disappear from view or across different videos. It is robust, easy to use and general. Technique details and analyses of several applications are described in Pérez-Escudero et al (2014).

Video protocol: https://www.youtube.com/watch?v=oC9tp5TKAyw

Example image: Example video of 5 zebrafish

has function
Description

The website implements a set of computer vision algorithms designed to automatically process time-lapse images of fluorescently labeled focal adhesion proteins in motile cells.

The methods associated with the processing have been published in PLOS One and Cell. The publication describes a quantitative analysis of focal adhesion dynamics that have been imaged using TIRF. All image processing steps are well explained or referenced.

To better understand the dynamic regulation of focal adhesions, we have developed an analysis system for the automated detection, tracking, and data extraction of these structures in living cells. This analysis system was used to quantify the dynamics of fluorescently tagged Paxillin and FAK in NIH 3T3 fibroblasts followed via Total Internal Reflection Fluorescence Microscopy (TIRF). High content time series included the size, shape, intensity, and position of every adhesion present in a living cell. These properties were followed over time, revealing adhesion lifetime and turnover rates, and segregation of properties into distinct zones.


has function
Description

u-Track is a client-side OMERO MATLAB application implementing the sophisticated multiple-particle tracking algorithm of Jaqaman et al. . It works on data previously imported into an OMERO server, and produces results in the form of MATLAB data structures as well as providing functionality to visualise these results.

has function
Description

This simple KNIME workflow solution tracks 2D objects/cells in time series. After a few intensity based preprocessing steps, objects/cells are segmented first, then it uses Fiji TrackMate LAP method for the tracking task.

Documentation starts from p23 of the linked PDF. 

Example Image: mitocheck_small.tif (2.9M)

has function
Description

The Fiji distribution of ImageJ comes with several manual tracking tools, two of which are particularly useful:

* _Plugins->Tracking->Manual Tracking_

* _Plugins->Tracking->Manual tracking with TrackMate_ (TrackMate is an advanced automatic tracking tool, with the option for manual editing of tracks)

The _Manual Tracking_ plugin is quick to use, intuitive and produces easy-to-understand output. TrackMate has the advantage that automatic detection and linkage can be combined with manual input.

Update sites

MtrackJ (see the component page here) can be installed via Fiji update sites. It has many shortcut keys enabled so for manually tracking many data, it will become quite efficient as you get used to the short-cut key operation.

Pre-processing

Pre-processing steps before manual tracking might include:

* denoising and/or deconvolution

* flicker and photobleaching correction, e.g. using Fiji's _Image->Adjust->Bleach Correction_

* flat-field correction, and/or bandpass (ImageJ's _Process->FFT->Bandpass filter_) according to the size of the features of interest

has function
Description

This workflow is used to track multiple (appear/disappear, dividing and merging) objects in presumably big 2D+t or 3D+t datasets. It is best suitable for roundish objects or spots. Tracking is done through segmentation, which can be obtained from ilastik pixel classification, or imported from other tools. Users should provide a few object level labels, and the software predicts results on the rest of the image or new images with similar image characteristics. As a result, all objects get assigned random IDs at the first frame of the image sequence and all descendants in the same track (also children objects such as daughter cells) inherit this ID.

need a thumbnail
Description

Tracking of focal adhesions includes a number of challenges:

  1. Detection of focal adhesion regions in areas of highly variable background
  2. Separation of "clumped" adhesions in different objects.
  3. Dynamics: Focal adhesions dynamically, grow, shrink, change their shape, they can fuse with neighboring adhesions or one adhesion can be split into multiple children.

Würflinger et al (2011) describe how to detect focal adhesion objects and how to track them over time. Interestingly, tracking results are fed back to segmentation to improve separation of clumped adhesions.

The authors implemented the workflow in Matlab, but do not provide a ready-to-use script.

Description

In the commercial image analysis software "Volocity", automated measurement protocols can be constructed by dragging, dropping and configuring a sequence of individual "tasks".

By combining the "Find Objects" task with a subsequent "Track" task, 3D objects can be identified and followed over time. The initial "Find Objects" segmentation can be refined, e.g. using "Separate Touching Objects"; and tracking results in the form of "Measurement Items" can be viewed in tabular form, as a graph, etc.

Description

Generation of Kymographs using 2D+t images. In the generated kymographs, objects can be tracked and the results are visualized.

has function
Description

Microtubule end tracking in live cell fluorescent images of Drosophila oocyte involves overcoming the following challenges, which can be tackled by a series of preprocessing steps and tracking described in Parton et al (2011)

  • illumination flicker & photobleaching: suppress by normalising intensities, e.g. using Image->Adjust->Bleach Correction in Fiji/ImageJ
  • uneven illumination: Fourier bandpass filtering (e.g. Process->FFT->Bandpass Filter) preserves features within a selected size range
  • high background / poor contrast: foreground filter, e.g. Temporal Median filter
  • tracking: e.g. TrackMate in Fiji/ImageJ (segmentation using DoG detector)
has function
Description

This macro and plugins suite for ImageJ (and Fiji) serves to measure the velocity of moving structures and visualize them, from image time series (2D over time).

The module can be installed in ImageJ as a Macro Menu and each function/component can be called separately. The full workflow consists in calling some, or all, the functions sequentially in order to get from the image preparation (e.g. filtering and visualization of tracks) to the production of the kymographs (time vs. distance plot) and their analysis (retrieving the velocities).

Here is the full workflow sequence:

  • Load image sequence
  • Crop and time-filter the image sequence ("Walking average" plugin)
  • Generate tracks by z-projection ("Stack difference" plugin)
  • Select tracks and restore them in the original stack.
  • execute plugin "multiple kymograph"
  • Analyse: select edges of moving tracks graphically and quantify movement in a table.

input: 8-bit, 16-bit stacks, 2D in time. Calibrated is better for meaningful velocity measurements.

ouput: the kymograph image, the velocity measurements tables.

Requires ImageJ version: 1.33.n minimum.

Example of applications:

  • velocity of moving objects/ structures with sharp edges, incl. the velocity of microtubules (and their plus ends),
  • the velocity of vesicles or particles along a 2D path
  • the velocity of migration of the edge of a cell or a multicellular group
  • retraction velocity of contractile bundles (e.g. actin fibers) or multicellular tissues after mechanical disruption (e.g. laser surgery)
Description

The workflow contains a Matlab package (plusTipTracker) for segmentation and tracking of microtubule tips, based on fluorescence time-lapse movies from microtubule tip markers such as EB-GFP. The tracking model accounts for the specific movement characteristics of microtubules Moreover, scripts for secondary analysis of detected microtubule paths are provided.

plusTipTracker is part of u-track 2.0 package. The workflow is described in the reference. 

has topic
has function
Description

The Huygens Software Suite consists of different image processing packages with functionalities that include deconvolution, interactive analysis, and volume visualization of 2D-3D multi-channel and time series images from fluorescence microscopes such as widefield, confocal, multi-photon, spinning disk, Array Detector, STED, and Light Sheet

Description

ilastik is a simple, user-friendly tool for interactive image classification, segmentation and analysis. It is built as a modular software framework, which currently has workflows for automated (supervised) pixel- and object-level classification, automated and semi-automated object tracking, semi-automated segmentation and object counting without detection. Most analysis operations are performed lazily, which enables targeted interactive processing of data subvolumes, followed by complete volume analysis in offline batch mode. Using it requires no experience in image processing.

ilastik (the image learning, analysis, and segmentation toolkit) provides non-experts with a menu of pre-built image analysis workflows. ilastik handles data of up to five dimensions (time, 3D space, and spectral dimension). Its workflows provide an interactive experience to give the user immediate feedback on the quality of the results yielded by her chosen parameters and/or labelings.

The most commonly used workflow is pixel classification, which requires very little parameter tuning and instead offers a machine learning technique for segmenting an image based on local image features computed for each pixel.

Other workflows include:

Object classification: Similar to pixel classification, but classifies previously segmented objects by object characteristics in a subsequent step

Autocontext: This workflow improves the pixel classification workflow by running it in multiple stages and showing each pixel the results of the previous stage.

Carving: Semi-automated segmentation of 3D objects (e.g. neurons) based on user-provided seeds

Manual Tracking: Semi-automated cell tracking of 2D+time or 3D+time images based on manual annotations

Automated tracking: Fully-automated cell tracking of 2D+time or 3D+time images with some parameter tuning

Density Counting: Learned cell population counting based on interactively provided user annotation

Strengths: interactive, simple interface (for non-experts), few parameters, larger-than-RAM data, multi-dimensional data (time, 3D space, channel), headless operation, batch mode, parallelized computation, open source

Weaknesses: Pre-built workflows (not reconfigurable), no plugin system, visualization sometimes buggy, must import 3D data to HDF5, tracking requires an external CPLEX installation

Supported Formats: hdf5, tiff, jpeg, png, bmp, pnm, gif, hdr, exr, sif

Description

Imaris is a software for data visualization, analysis, segmentation and interpretation of 3D and 4D microscopy images. It performs interactive volume rendering that lets users freely navigate even very large datasets (hundreds of GB). It performs both manual and automated detection and tracking of biological “objects” such as cells, nuclei, vesicles, neurons, and many more. ImarisSpots for example is a tool to detect “spherical objects” and track them in time series. Besides the automated detection it gives the user the ability to manually delete and place new spots in 3D space. ImarisCell is a tool to detect nuclei, cell boundaries and vesicles and track these through time. ImarisFilament is a module that lets users trace neurons and detect spines. For any detected object Imaris computes a large set of statistics values such as volume, surface area, maximum intensity of first channel, number of vesicles per cell etc. These values can be exported to Excel and statistics software packages. The measurements can also be analyzed directly within ImarisVantage which is a statistics tool that provides the link back to the 3D objects and the original image data. Strengths: - good visualization - user friendly interface - reads most microscopy file formats - image analysis workflows are very easy to apply - interactive editing of objects to correct errors during automatic detection - large data visualization (hundreds of GB)

has topic
null
Description

Semi-automated cell tracking of 2D+time or 3D+time images based on manual annotations

has function
need a thumbnail
Description

Fully-automated cell tracking of 2D+time or 3D+time images with some parameter tuning

has function
need a thumbnail
Description

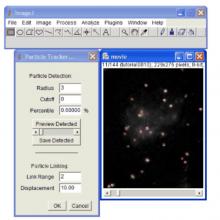
Easy-to-use, computationally efficient, two- and three-dimensional, feature point-tracking tool for the automated detection and analysis of particle trajectories as recorded by video imaging in cell biology. 


The tracking process requires no apriori mathematical modelling of the motion, it is self-initialising, it discriminates spurious detections, and it can handle temporary occlusion as well as particle appearance and disappearance from the image region. 


The plugin is well suited for video imaging in cell biology relying on low-intensity fluorescence microscopy. It allows the user to visualize and analyze the detected particles and found trajectories in various ways:

  • Preview and save detected particles for separate analysis
  • Global non progressive view on all trajectories
  • Focused progressive view on individually selected trajectory
  • Focused progressive view on trajectories in an area of interest

It also allows the user to find trajectories from uploaded particles position and information text files and then to plot particles parameters vs. time - along a trajectory

Description

CellTracker software is a platform for tracking nuclear and cytoplasmic fluorescence intensities from live cell microscopy time series data.


Requires visual C++

Description

WIS-PhagoTracker is a software application for quantitative analysis of high throughput cell migration assay. The cell migration assay is based on a modified Phagokinetic tracks procedure, in which motile cells "leave their tracks" on a specialized surface. These tracks are visualized using a screening microscope.

WIS-PhagoTracker enables morphometric analysis of such tracks. It uses multiscale segmentation algorithm for fine detection of tracks and cells boundaries.

Following the segmentation step, it quantifies various morphometric parameters for each track, such as track area, perimeter, major and minor axis and solidity. All these measures are calculated for each track in each well of a well plate and saved for further statistical analysis WIS-PhagoTracker supports all the analysis phases starting from preprocessing, finding tracks of selected wells or a whole plate, through viewing the results and manually rejecting tracks to statistical analysis of the results. It also supports batch processing of several plates, and analysis of single image files. A user interface enables the user to modify the relevant parameters of the process, according to specific image's requirements.

Results are exported into Excel readable files.

Description

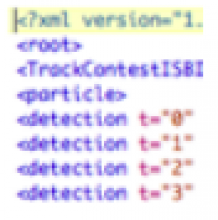
TrackProcessor for the TrackManager plugin that allows importing/exporting tracks. Input and output files are in the .xml format used for the ISBI'2012 Particle Tracking Challenge. Tracks are loaded/exported in/from the TrackManager plugin

has function
Description

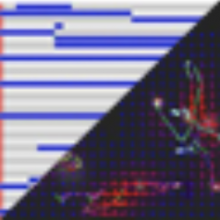
The track manager enables the use of DSP-like trackProcessors. This can affect the display of tracks, selection in time or by ROIs, and also compute some views like the overlaid and animated local flow graph, polar graph.

has function
Description

Track Processor to color tracks in the Track Manager

Description

This display the Instant Speed of tracks for the Icy Track Manager.

Description

The purpose of this plugin is to create a text file with a list of files from Gatan’s 3View montage image stacks. This text file can then be used to automatically import all the images into TrakEM2, as they are, stored in the original directories.

Description

Mice Profiler tracks multiple mice from a top view video.

need a thumbnail
Description

This is an icy package that encapsulates tools to design and implement parametric active contours. The package provides fast 2D and 3D filters for image preprocessing, and a framework to create and evolve snakes defined by a set of control points.

Description

An ImageJ plugin for manually tracking objects by mouse clicking. 

This plugin is bundled with Fiji. 


has function