Image feature detection

Synonyms
Image feature extraction
Description

DeXtrusion is a machine learning based python pipeline to detect cell extrusions in epithelial tissues movies. It can also detect cell divisions and SOPs, and can easily be trained to detect other dynamic events.

DeXtrusion takes as input a movie of an epithelium and outputs the spatio-temporal location of cell extrusion events or other event as cell divisions. The movie is discretized into small overlapping rolling windows which are individually classified for event detection by a trained neural network. Results are then put together in event probability map for the whole movie or as spatio-temporal points indicating each event.

DeXtrusion probability map
Description

MATLAB app to characterize nanoparticles imaged with super-resolution microscopy. nanoFeatures will read text and csv files from the NIKON and ONI microscopes and from the ThunderSTORM Fiji plugin, then cluster the localizations and filter by size and sphericity and finally output nanoparticle features like size, aspect ratio, and number of localizations per cluster (total and for each channel).

GUI first tab to browse and input files, select input type and check extra filters if needed.
Description

Phindr3D is a comprehensive shallow-learning framework for automated quantitative phenotyping of three-dimensional (3D) high content screening image data using unsupervised data-driven voxel-based feature learning, which enables computationally facile classification, clustering and data visualization.

Please see our GitHub page and the original publication for details.

Description

This plugin computes for each image element (pixel/voxel) the eigenvalues of the Hessian, which can be used for example to discriminate locally between plate-like, line-like, and blob-like image structures

need a thumbnail
Description

Wavelet Toolbox™ provides apps and functions for the time-frequency analysis of signals and multiscale analysis of images.

need a thumbnail
Description

Dragonfly is a software platform for the intuitive inspection of multi-scale multi-modality image data. Its user-friendly experience translates into powerful quantitative findings with high-impact visuals, driven by nuanced easy-to-learn controls.

For segmentation: It provides an engine fior machine Learning, Watershed and superpixel methods, support histological data .

It offers a 3D viewer, and python scripting capacities .

It is free for reserach use, but not for commercial usage.

DragonFly
Description

ImageJ/FIJI plugin generating contour lines with equal spacing on top of an image (using overlay).

Description

"The Microscope Image Analysis Toolbox MiToBo is an extension for the widely used image processing application ImageJ and its new release ImageJ 2.0.
MiToBo ships with a set of operators ready to be used as plugins in ImageJ. They focus on the analysis of biomedical images acquired by various types of microscopes."

Description

The software FishInspector provides automatic feature detections in images of zebrafish embryos (body size, eye size, pigmentation). It is Matlab-based and provided as a Windows executable (no matlab installation needed).

The recent version requires images of a lateral position. It is important that the position is precise since deviation may confound with feature annotations. Images from any source can be used. However, depending on the image properties parameters may have to be adjusted. Furthermore, images obtained with normal microscope and not using an automated position system with embryos in glass capillaries require conversion using a KNIME workflow (the workflow is available as well). As a result of the analysis the software provides JSON files that contain the coordinates of the features. Coordinates are provided for eye, fish contour, notochord , otoliths, yolk sac, pericard and swimbladder. Furthermore, pigment cells in the notochord area are detected. Additional features can be manually annotated. It is the aim of the software to provide the coordinates, which may then be analysed subsequently to identify and quantify changes in the morphology of zebrafish embryos.

FishInspector Logo
Description

Maxima finding algorithm implemented in Python recreated from implementation in Fiji(ImageJ)

This is a re-implementation of the java plugin written by Michael Schmid and Wayne Rasband for ImageJ. The original java code source can be found in: https://imagej.nih.gov/ij/developer/source/ij/plugin/filter/MaximumFinder.java.html 

This implementation remains faithful to the original implementation but is not 100% optimised. The java version is faster but this could be alleviated by compiling c code for parts of the code. This script is simply to provide the functionality of the ImageJ find maxima algorithm to individuals writing pure python script.

The algorithm works as follows:

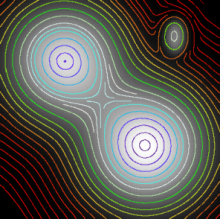
The first stage in the maxima finding algorithm is to find the local maxima. This involves processing the image with a 3x3 neighbourhood maximum filter. Once filtered this image is compared back to the original, where the pixels are the same value represents the locations of the local maxima. Typically there are far too many local maxima to be meaningful so the goal is then to merge and prune this maxima using some kind of measure of quality. In the case of algorithm a single parameter is used, the noise tolerance (Prominence). If a maxima is close to another then the maxima will be merged or removed based on the below criteria.

Starting with the brightest maxima and working down the intensities:

  • Expand out (‘flood fill’) from each maxima location. Neighbouring pixels within a noise tolerance (notl) of the maxima are scanned until the region within tolerance is exhausted.
    • If the pixels are equal to the maxima, mark this as equal.
    • If a greater maxima is met, ignore the active maxima.
    • If the pixels are less than maxima, but greater than maxima minus the noise tolerance, mark as listed.
    • Mark all ‘listed’ pixels 'processed' if they are included within a valid peak region, otherwise reset them.
    • From the regions containing a peak, calculate the best pixel to be considered as maxima based on minimum distance calculation with all those maxima considered equal.
       

For a video detailing how this algorithm works please see:

https://youtu.be/f9vXOMKOlaY

Or for examples of it being used in practise, please see:

https://youtu.be/9wvPsEzRWzI


find maxima comparison.

CEM

Description

Computer-assisted Evaluation of Myelin formation (CEM) is a collection designed to automate myelin quantification. It requires use input to choose the best threshold values. The myelin is calculated as an overlap between neuronal signal and oligodendrocyte signal. Results are given as pixel counts and percents.

CEM runs as an imageJ plugin with an optional Matlab extension to remove cell bodies. More details are published at Kerman et al. 2015 Development. Supplemental Material includes a detailed user manual and the download link.

Myelin
Description

MaMuT is an end user plugin that combines the BigDataViewer and TrackMate to provide an application that allow browsing, annotating and curating annotations for large image data.

Description

"An open source machine learning framework for everyone "

TensorFlow™ is an open source software library for high performance numerical computation. Its flexible architecture allows easy deployment of computation across a variety of platforms (CPUs, GPUs, TPUs), and from desktops to clusters of servers to mobile and edge devices. Originally developed by researchers and engineers from the Google Brain team within Google’s AI organization, it comes with strong support for machine learning and deep learning and the flexible numerical computation core is used across many other scientific domains.

has topic
TensorFlow
Description

The MIPAV (Medical Image Processing, Analysis, and Visualization) application enables quantitative analysis and visualization of medical images of numerous modalities such as PET, MRI, CT, or microscopy. Using MIPAV's standard user-interface and analysis tools, researchers at remote sites (via the internet) can easily share research data and analyses, thereby enhancing their ability to research, diagnose, monitor, and treat medical disorders.

Description

This plugin filters a 3D image stack (or 2D image) to produce a score for how "tube-like" each point in the image is. This is useful as a preprocessing step for tracing neurons or blood vessels, for example. For 3D image stacks, the plugin uses the eigenvalues of the Hessian matrix to calculate this measure of "tubeness", using a metrics mentioned in Sato et al 1997 ¹: if the larger two eigenvalues (λ₂ and λ₃) are both negative then value is √(λ₂λ₃), otherwise the value is 0. For 2D images, if the large eigenvalue is negative, we return its absolute value and otherwise return 0.

This plugin is now bundled as part of Fiji.

Description

WND-CHARM is a multi-purpose image classifier that can be applied to a wide variety of image classification tasks without modifications or fine-tuning, and yet provides classification accuracy comparable to state-of-the-art task-specific image classifiers. WND-CHARM can extract up to ~3,000 generic image descriptors (features) including polynomial decompositions, high contrast features, pixel statistics, and textures. These features are derived from the raw image, transforms of the image, and compound transforms of the image (transforms of transforms). The features are filtered and weighted depending on their effectiveness in discriminating between a set of predefined image classes (the training set). These features are then used to classify test images based on their similarity to the training classes. This classifier was tested on a wide variety of imaging problems including biological and medical image classification using several imaging modalities, face recognition, and other pattern recognition tasks. WND-CHARM is an acronym that stands for "Weighted Neighbor Distance using Compound Hierarchy of Algorithms Representing Morphology."

Generated features
Description

This is a Matlab implementation of Local Phase Quantization (LPQ) texture descriptors that is robust to image blurring due to the use of phase information. Theoretical background could be found here: http://www.ee.oulu.fi/research/mvmp/mvg/files/pdf/ICISP08.pdf

need a thumbnail
Description

This is a software toolbox that extends the original BSIF code allowing the utilization of a GPU in Matlab to compute the features. It contains: -Matlab function to calculate BSIF in CPU -Matlab function extension to calculate BSIF in GPU -Pre-learnt filters -Usage instructions

need a thumbnail
Description

Matlab implementation (2014) of Local Binary Pattern. Used for texture image analysis with insensitivity to local average value. Good explanation here: http://www.ee.oulu.fi/research/imag/mvg/files/pdf/ICCV2009_tutorial.pdf

need a thumbnail
Description

This package contains some MatLab tools for multi-scale image processing. Briefly, the tools include: - Recursive multi-scale image decompositions (pyramids), including Laplacian pyramids, QMFs, Wavelets, and steerable pyramids. These operate on 1D or 2D signals of arbitrary dimension. Data structures are compatible with the MatLab wavelet toolbox. - Fast 2D convolution routines, with subsampling and boundary-handling. - Fast point-operations, histograms, histogram-matching. - Fast synthetic image generation: sine gratings, zone plates, fractals, etc. - Display routines for images and pyramids. These include several auto-scaling options, rounding to integer zoom factors to avoid resampling artifacts, and useful labeling (dimensions and gray-range).

need a thumbnail
Description

SLDC is an open-source Python workflow. SLDC stands for Segment Locate Dispatch Classify. This framework aims at facilitating the development of algorithms for detecting objects in multi-gigapixel images. Particularly, it provides algorithm developers with a structure to define problem-dependent components of their processing workflow (i.e. segmentation and classification) in a concise way. Every other concern such as parallelization and large image handling are encapsulated by the framework. It also features a powerful and customizable logging system and some components to apply several workflows one after another on a same image. SLDC can work on local images or interact with Cytomine

Example image:

Toy image data

has topic
Description

An object detection function in ImageJ. [Analyze > Analyze Particles...]. It could simply be used for counting number of cells, but could also do more complex stuffs. ## Jython Snippet Here is a snippet of how to use Particle Analysis in Jython script.

has topic
need a thumbnail
Description

The MorphoLeaf application allows you to extract the contour of multiple leaf images and identify their biologically-relevant landmarks. These landmarks are then used to quantify morphological parameters of individual leaves and to reconstruct average leaf shapes. MorphoLeaf is developed by the Modeling and Digital Imaging and the Transcription Factors and Architecture teams of the Institut Jean-Pierre Bourgin, INRA Versailles, France, and the Biophyscis and Development group at RDP, Lyon.

Description


In this workflow, you can use MorphoLibJ to generate accurate morphometric measurements

  • First the fibers are segmented by mathematical morphology:
    • for example by using MorphoLibJ:
      • Create a marker image by creating a rough mask with extended regional maxima (similar to Find Max), such that you have one max per fiber
      • Use the marker controlled watershed (in MorpholLibJ/ Segmentation/ marker controlled watershed) : indicate the original grayscale image as the input, Marker will be your maxima image, select None for mask
      • it will create a label mask of your fibers
  •  In MorphoLibJ /analyze/ select Region Morphometry: this will compute different shape factors which are more robust than the ones implemented by default in ImageJ
  • Export the result table created to a csv file
  • Then for example in Matlab or R, you can apply a PCA analysis (Principal component analysis) followed by a k-means with the number of class (clusters) (different fibers type) you want to separate.
  • You can then add this class as a new feature to your csv file.
  • From this you can sort your labelled fibers into these clusters for a visual feedback or further spatial analysis
has topic
hemp analysis
Description

This plugin applies the Hough Transform for Circles to an 8-Bit image, shows the resulting Hough Space in a new window and marks the centers of the found circles.

need a thumbnail
Description

## Algorithm See .

need a thumbnail
Description

A convenient tool for detecting lines! After the detection, detected lines are overlaid to the image. The plugin also stores these lines as ROIs, which could then easily be analyzed as vector information. Instead, the list of coordinates of all detected lines are placed in "contour" table. This could be used for redrawing or converting them as arrays. ## Algorithm See 2615.

need a thumbnail
Description

An often used Laplacian filter for enhancing signals at object boundaries and dots. It works with XY, XYZ, XYZ-T, XYZ-T-Ch1, XYZT-C1-C2 images. Distributed as a part of ImageJ plugin FeatureJ, and included in Fiji. The second URL above is the link to its Javadoc. (imagescience.feature.Laplacian). A primer for using this class in Jython script is in CMCI Jython/Fiji cookbook: FeatureJ.

need a thumbnail
Description

This plugin will return on a full 256-grey level image (limitation in this version) or on a ROI several texture features such as described in Haralick publication. Can be run in batch mode.

need a thumbnail
Description

This workflow classifies, or segments, the pixels of an image given user annotations. It is especially suited if the objects of interests are visually (brightness, color, texture) distinct from their surrounding. Users can iteratively select pixel features and provide pixel annotations through a live visualization of selected feature values and current prediction responses. Upon users' satisfaction, the workflow then predicts the remaining unprocessed image(s) regions or new images (as batch processing). Users can export (as images of various formats): selected features, annotations, predicted classification probability, simple segmentation, etc. This workflow is often served as one of the first step options for other workflows offered by ilastik, such as object classification, automatic tracking.

Description

In the commercial image analysis software "Volocity", automated measurement protocols can be constructed by dragging, dropping and configuring a sequence of individual "tasks".

By combining the "Find Objects" task with a subsequent "Track" task, 3D objects can be identified and followed over time. The initial "Find Objects" segmentation can be refined, e.g. using "Separate Touching Objects"; and tracking results in the form of "Measurement Items" can be viewed in tabular form, as a graph, etc.

Description

Autofocus hyperstack macro:

Select the in focus frame from each slice of a hyperstack and create a new stack of just the in focus frames. Based on algorithm F-11 "Normalized Variance".

Original macro by Andy Weller.

need a thumbnail
Description

An ImageJ plugin for selecting a plane in focus among multiple slices image stack. The algorithm uses normalized variance. A short tutorial is available in the plugin web page (above).

need a thumbnail
Description

Computes signed curvature along a line.

has topic
need a thumbnail
Description

This ImageJ plugin creates high resolution PSF images by averaging many bead im- ages as well as exploiting the assumption that the point spread function is rotationally symmetric with respect to the axial axis (z-direction).

Description

Automatic detection of the variance (i.e. standard deviation, power) of the noise that affects a sequence, assuming that it is a white additive Gaussian noise.

Description

This is a set of Matlab routines for computing generalized Daubechies wavelet filters.

need a thumbnail