plugin

Description

ADAPT is capable of rapid, automated analysis of migration and membrane protrusions, together with associated
fluorescently labeled proteins, across multiple cells. ADAPT can detect and morphologically profile filopodia.

ADAPT (Automated Detection and Analysis of ProTrusions) is a plug-in developed for the ImageJ/Fiji platform to automatically detect and analyse cell migration and morphodynamics. The program provides whole-cell analysis of multiple cells, while also returning data on individual membrane protrusion events. The plug-in accepts as input one or two image stacks and outputs a variety of data. ADAPT may also be run in batch mode.


has function
ADAPT logo
Description

The ImageJFX Project aims to create a new user interface for the software ImageJ in order to ease scientific image analysis. While keeping the core components of ImageJ, ImageJFX brings scientists closer to their goal by making the interface clearer for beginners and more practical for advanced users.

ImageJFX screen Capture
Description

SIMcheck is an ImageJ plugin suite for assessing the quality and reliability of Structured Illumination Microscopy (SIM) data. The quality of the raw data, the quality of the reconstruction and the calibration of the microscope can be tested. 

has function
Simcheck screenschot
Description

This module is for learning classification models from ground-truth data (supervised learning). It downloads from Cytomine-Core annotation images and coordinate of annotated objects from project(s) and build a annotation classification model which is saved locally.  

It is used by Cytomine DataMining applications: classification_validation, classification_model_builder, classification_prediction, segmentation_model_builder and segmentation_prediction. But it can be run without Cytomine on local data (using dir_ls and dir_ts arguments).

has topic
need a thumbnail
Description

A resident function in ImageJ, located in the menu as [Process > Binary > Voronoi].

Quote from the ImageJ reference page:

Splits the image by lines of points having equal distance to the borders of the two nearest particles. Thus, the Voronoi cell of each particle includes all points that are nearer to this particle than any other particle. When particles are single points, this process is a Voronoi tessellation (also known as Dirichlet tessellation). The output type (Overwrite, 8-bit, 16-bit or 32-bit) of this command can be set in the [Process > Binary > Options...] dialog box. In the output, the value inside the Voronoi cells is zero; the pixel values of the dividing lines between the cells are equal to the distance between the two nearest particles. This is similar to a medial axis transform of the background, but there are no lines in inner holes of particles.


Description

An object detection function in ImageJ. [Analyze > Analyze Particles...]. It could simply be used for counting number of cells, but could also do more complex stuffs. ## Jython Snippet Here is a snippet of how to use Particle Analysis in Jython script.

has topic
need a thumbnail
Description

WaveTracer is a plugin for Metamorph. It represents a functional method for real-time reconstruction with automatic feedback control, without compromising the localization accuracy. It relies on a wavelet segmentation algorithm, together with a mix of CPU/GPU implementation.

has function
need a thumbnail
Description

This plugin allows : Calculating co-localization between objects in 3D Measuring 3D distances between nearest object, co-localized or not Getting some 3D measurements about each objects The plugin can be used with labelled images, but it also integrates tools for the segmentation of the objects. Programming language: JAVA Processes: Denoise filter Segmentation of the objects Object based co-localization and distance analysis Counting and measurements on objects

Description

Image-processing algorithms developed at the MOSAIC Group for fluorescence microscopy. Tools included:

  • 2D/3D single-particle tracking tool which can be used to track bright spots in 2D/3D movies over time.
  • Optimal filament segmentation of 2D images. 
  • Curvature filters for image filtering, denoising, and restoration. 
  • Image naturalization for image enhancement based on gradient statistics of natural-scence images. 
  • Tool for automatically send and distribute jobs on clusters and get back the results.
  • Multi-region image segmentation of 2D and 3D images without needing to know the number of regions beforehand. 
  • Squassh for globally optimal segmentation of piecewise constant regions in 2D and 3D images and for object-based co-localization analysis. 
  • Tool for inferring spatial interactions between patterns of objects in images or between coordinates read from a file.
  • Tool for robust, histogram-based background subtraction well suited to correct for inhomogeneous illumination artifacts.
  • A tool to estimate the Point-Spread Function of the microscopy out of 2D fluorescence images.
  • A tool to measure the 3D Point-Spread Function of a confocal microscope from an image stack.
  • Addition of synthetic Poisson-distributed noise to an image in order to simulate shot noise of various signal-to-noise ratios. 
  • Convolution of an image with a Bessel function in order to simulate imaging with a microscope. 
  • A utility to detect bright spots in images and estimate their center. 
  • A utility to create manual segmentations to be used as ground truth to test and benchmark automatic segmentation algorithms.
  • A tool for replacing one color in an image with another color.
has topic
Description

The MorphoLeaf application allows you to extract the contour of multiple leaf images and identify their biologically-relevant landmarks. These landmarks are then used to quantify morphological parameters of individual leaves and to reconstruct average leaf shapes. MorphoLeaf is developed by the Modeling and Digital Imaging and the Transcription Factors and Architecture teams of the Institut Jean-Pierre Bourgin, INRA Versailles, France, and the Biophyscis and Development group at RDP, Lyon.

Description

ThunderSTORM is an open-source, interactive, and modular plug-in for ImageJ designed for automated processing, analysis, and visualization of data acquired by single molecule localization microscopy methods such as PALM and STORM. Our philosophy in developing ThunderSTORM has been to offer an extensive collection of processing and post-processing methods so that users can easily adapt the process of analysis to their data.

need a thumbnail
Description

This is an ImageJ plugin to analyze bacterial cells. It provides a user-friendly interface and a powerful suite of detection, analysis and data presentation tools. It works with individual phase or fluorescence images as well as stacks, hyperstacks, and folders of any of these types. Even large image sets are analyzed rapidly generating raw tabular data that can either be saved or copied as is, or have additional statistical analysis performed and graphically represented directly from within MicrobeJ, making it an all-in-one image analysis solution.

need a thumbnail
Description

This ImageJ plugin aligns the slices of a stack just like the stackreg plugin on which it is built. It allows to save the transformations and to apply them to another stack. It furthermore allows to register two stacks.

need a thumbnail
Description


In this workflow, you can use MorphoLibJ to generate accurate morphometric measurements

  • First the fibers are segmented by mathematical morphology:
    • for example by using MorphoLibJ:
      • Create a marker image by creating a rough mask with extended regional maxima (similar to Find Max), such that you have one max per fiber
      • Use the marker controlled watershed (in MorpholLibJ/ Segmentation/ marker controlled watershed) : indicate the original grayscale image as the input, Marker will be your maxima image, select None for mask
      • it will create a label mask of your fibers
  •  In MorphoLibJ /analyze/ select Region Morphometry: this will compute different shape factors which are more robust than the ones implemented by default in ImageJ
  • Export the result table created to a csv file
  • Then for example in Matlab or R, you can apply a PCA analysis (Principal component analysis) followed by a k-means with the number of class (clusters) (different fibers type) you want to separate.
  • You can then add this class as a new feature to your csv file.
  • From this you can sort your labelled fibers into these clusters for a visual feedback or further spatial analysis
has topic
hemp analysis
Description

It is a tool to visualize and annotate volume image data of electron microscopy. Users can annotate objects (e.g. neurons) and skeleton structures. It provides the ability to overlaying the image data with user annotations, representing the spatial structure and the connectivity of labeled objects, and displaying a three dimensional model of it. It can be extended by plugins written in python. A similar, web-based implementation is being developed at webknossos.info. Example datasets are also available.

Annotation in Knossos
Description

MorphoLibJ is a library of plugin for ImageJ with functionalities for image processing such as filtering, reconstructing, segmenting, etc... Tools are based on Mathematical morphology with more rigorous mathematical approach than in the standard tools of ImageJ in particular for surface (or perimeter) measurements which are usually based on voxel counting.  

http://imagej.net/MorphoLibJ#Measurements

Among the features:

Morphological operations :  Dilation, Erosion, Opening,  Closing , Top hat (white and black), Morphological gradient (aka Beucher Gradient), Morphological Laplacian, Morphological reconstruction, Maxima/Minima , Extended Maxima/Minima -Watershed (classic or controlled) -Image overlay -Image labelling -Geodesic diameter -Region Adjacency Graph -Granulometry curves, morphological image analysis.


several steps of morphological segmentation of plant tissue using MorphoLibJ.
Description

Calculate the Fourier ring correlation (FRC). The FRC can be used as a resolution criterion for super resolution microscopy. The Plugin can display a plot of the FRC curve, along with the LOESS smoothed version of the curve. Finally it displays the threshold method used and the intersection of the FRC with the threshold, providing the FIRE number. It can be used on two open images or on pairs of images in batch mode. 2654 2655

need a thumbnail
Description

to be completed

has function
need a thumbnail
Description

This plugin applies the Hough Transform for Circles to an 8-Bit image, shows the resulting Hough Space in a new window and marks the centers of the found circles.

need a thumbnail
Description

ABSnake can segment complex structures in 2D images as well as 3D or temporal images. It uses a new active contour model based on a geometrical approach for correctly following invaginated structures.

need a thumbnail
Description

MosaicIA is a tool to analyze the spatial distribution of objects in images. It estimates from an observed particle or object distribution what hypothetical interaction between the objects is most likely to have created this distribution.

need a thumbnail
Description

ImageJ native "Skeletonize" implementation. - works only with 8-bit binary image. A faster implementation is available as a plugin Skeletonize3D written by Ignacio Arganda-Carreras. Pros of this plugin is summarized here.

need a thumbnail
Description

Evaluates the orientation of fiber orientation pattern and plots the results in the image. It calculates gradient in x and y direction. - then calculates the eigenvector of nematic tensor, which is the orientation of the pattern.

Description

## Short Summary Quote from the plugin page: >LineageTracker offers an ImageJ based framework which is easily extendible and has the capability to track cell lineages while being specifically designed to handle large cell displacements between frames. The methods are designed for fluorescent cells and have been used to analyse Schizosaccharomyces pombe, C2C12 mouse stem cells or migrating RPE cells. This tool also allows flexible cell segmentation and extendable in all aspects. The webpage is detailed with usage from ImageJ macro. Rather than being simply a component, the plugin is indeed a framework with set of components. ## Misc info A tip from the plugin author in ImageJ mailing list (08.Sep.2015): > We have an additional script to export only a selected range of frames. I can send you that if you think LineageTracker is something for you. To be on the safe side I would try it with an older version of ImageJ. We have experienced some problems, mostly related to Java. Java 8 seems to fix most of it. ## References 2630: Application example. 2631: Plugin Paper.

has function
need a thumbnail
Description

The GDSC Single Molecule Light Microscopy (SMLM) plugins is a package of tools for single molecule localisation analysis. - Fitting Plugins: get point cloud from super resolution image. - Results Plugins: organize results. - Analysis plugins - Model plugins

need a thumbnail
Description

## Algorithm See .

need a thumbnail
Description

A convenient tool for detecting lines! After the detection, detected lines are overlaid to the image. The plugin also stores these lines as ROIs, which could then easily be analyzed as vector information. Instead, the list of coordinates of all detected lines are placed in "contour" table. This could be used for redrawing or converting them as arrays. ## Algorithm See 2615.

need a thumbnail
Description

A more modern approach for denoising / smoothening before segmentation, works like Gaussian blurring but preserves edges and boundaries. Listed in Fiji update sites. ## Algorithm Algorithm description is in [this page](http://www.ipol.im/pub/art/2011/bcm_nlm/) 2612. ## Example usage Localization of Membrane bound protein in Arabidopsis meristem was analyzed using the non-local-mean filter for refining its position 2613. ## impression It's effect is somewhere between Gaussian blurring and anistropic diffusion.

has function
need a thumbnail
Description

Adiposoft is an automated Open Source software for the analysis of adipose tissue cellularity in histological sections.

Example data can be found on the plugin description page in ImageJ wiki (download link). There is also a link to a MATLAB version of the workflow.

has topic
Description

A Java Package for Geometrical Image Transformation, works up to 5D.

  • Affine
  • Crop
  • Embed
  • Matrix
  • Mirror
  • Rotate
  • Scale
  • Translate
  • Turn
Description

Manual Tracking GUI. Many shortcut keys, and after being experienced, manual tracking can efficiently done. Post-editing capability to delete segments, merge and splitting tracks is quite useful.

has function
Description

An often used Laplacian filter for enhancing signals at object boundaries and dots. It works with XY, XYZ, XYZ-T, XYZ-T-Ch1, XYZT-C1-C2 images. Distributed as a part of ImageJ plugin FeatureJ, and included in Fiji. The second URL above is the link to its Javadoc. (imagescience.feature.Laplacian). A primer for using this class in Jython script is in CMCI Jython/Fiji cookbook: FeatureJ.

need a thumbnail
Description

The FindFoci plugins allow the identification of peak intensity regions within 2D and 3D images. The algorithm is highly configurable and parameters can be optimised using reference images and then applied to multiple images using the batch mode. Details of the benefits of training an algorithm on multiple images can be found in the FindFoci paper: 2591

has function
need a thumbnail
Description

The Fourier transform of an image produces a representation in frequency space: i.e. separated according to spatial frequency (effectively scale). The 2D amplitude map of the different spatial frequencies is symmetrical, and is commonly displayed with low spatial frequencies (large features) in the centre, highest spatial frequencies (small features) at the edges. Fourier filtering involves suppressing or enhancing features in the Fourier domain before carrying out an inverse Fourier transform to obtain a filtered real-space image. ImageJ's _Process > FFT > Bandpass Filter_ implements two common Fourier-filtering functions: 1. filtering for specific sizes of feature in an image by selecting minimum and maximum feature sizes (selecting a radial band of frequencies in Fourier space); 2. filtering out repetitive horizontal or vertical stripes by cutting out a zero-frequency stripe in the orthogonal direction in frequency space. The example image above shows the effect of filtering for 2 feature size ranges: 0-8 pixels, and 8-256 pixels; where the former appears "flattened" or washed-out, and the latter very blurred. The small images displayed to the lower-right of each filtered image correspond to the mask applied to the Fourier transform. Such filtering can be useful prior to global thresholding, for noise suppression, etc.

ImageJ bandpass screenshot
Description

Implementation of some image correlation spectroscopy tools

need a thumbnail
Description

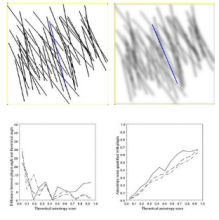
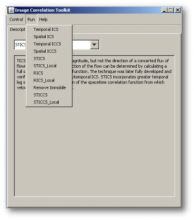
Fluorescence spectroscopy by image correlation is a technique that allows analysing and characterizing the different molecular dynamics from a sequence of fluorescence images. Many image correlation techniques have been developed for different applications but in particular to study the mechanisms of cell adhesion during migration. These techniques can be used with most imaging modalities: e.g. fluorescence widefield, confocal microscopy, TIRFM. They allow to obtain information such as the density in molecules, diffusion coefficients, the presence of several populations, or the direction and speed of a movement corresponding to active transport when spatial and temporal correlations are taken into account (STICS: Spatio-Temporal Image Correlation Spectroscopy).

This plugin is based on ICS_tools plugin by Fitz Elliott, available here.

Some bugs have been removed, ROI does not need to be squared, fitting is weighted in order to give more weight to the smaller lags (temporal or spatial)

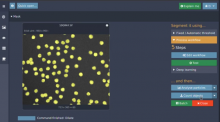
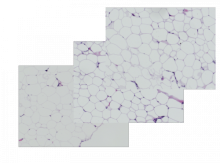
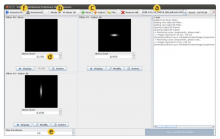
Exemple of use on sample data [fluorescent beads](http://biii.info/node/2577 "Beads") - Select an ROI, start by ICS to get the right PSF size - Then run TICS and select diffusion, or diffusion plus flow model. Remove the first line (autocorrelation) which corresponds to the noise autocorrelation before fitting.

interface
Description

The workflow consists of firstly identifying spot (which can be also gravity center of cells identified by another method), and then secondly compute trajectories by linking these spots by global optimisation with a cost function. This method is part of the methods evaluated in Chanouard et al (2014) as "method 9" and is described in detail in its supplementary PDF (page 65).

Dependencies

Following plugins are required.

  1. JAR to be placed under IJ plugin directory
  2. A pdf file with instructions and output description is also available in the zip .
  3. MTrackJ : Used for visualization of tracks. Preinstalled in Fiji.
  4. Imagescience.jar: This library is used by MTrackJ. Use update site to install this plugin.
  5. jama.jar. Preinstalled in Fiji.

##Advantages:

  • support blinking (with a parameters allowing it or not)
  • fast,
  • can be used in batch, some analysis results provided.
  • No dynamic model.
  • The tracking part is not dependent of ImageJ.

Pitfalls:

  • does not support division
  • the optimization algorithm used is a simulated annealing, so results can be slightly different between two runs.
  • No Dynamic model (so less good results but can be used for a first study of the kind of movements)

##The sample data

The parameters used for this example data Beads, were

  1. detection: 150
  2. the max distance in pixels: 20
  3. max allowed disappearance in frame: 1
Description

The root tools help to efficiently measure the following characteristics of plant roots: the angle of the opening of the whole root the depth to which it goes down the number of roots at multiple depths (for example 30cm, 35cm, ...) the diameters of the roots at multiple depths (for example 30cm, 35cm, ...)

Root tools
Description

HDF5 is a data format for storing extremely large and complex data collections. This Fiji/ImageJ HDF5 plugin saves and loads 2D - 5D datasets with flexible options.

In Fiji, the plugin is downloadable via update site "HDF5".

Description

Rigid registration of time series in 3D. A video tutorial is available (be careful of sounds, the video automatically starts!): [Sample Drift Correction Following 4D Confocal Time-lapse Imaging](http://www.jove.com/video/51086/sample-drift-correction-following-4d-co…)

has function
Description

ImageJ plugin to analyze changes in vessel diameters, described in Fernández er al (2014). More specifically the paper describes the measurement of isolated retinal arterioles (ca 50 micrometer diameter) but can be used for diameter measurements of similar vessel structures.

Description

Variational algorithms to remove stationary noise. Application to microscopy imaging. This plugin allows to denoise images degraded with stationary noise. Stationary noise can be seen as a generalization of the standard white noise. Typical applications of this plugin are:

- Standard white noise denoising using a total variation and fidelity term minimization. Even though total variation denoising is not the state of the art (regarding SNR improvement), it may be very valuable for further tasks such as image seg- mentation).

- Destriping (the problem that motivated us to develop these ideas). 

- Deconvolution (even though most users won't be able to use this feature).

- Cartoon + texture decomposition which might be useful to compress images, analyse textures or simplify segmentation like tasks.

has topic
has function
Description

A Jython script using the plugin : Register Virtual Stack Slices It takes a sequence of image slices stored in a folder, and delivers a list of registered image slices (with enlarged canvas). One of the images in the sequence can be selected by the user as reference and it will remain intact. The plugin can perform 6 types of image registration techniques: - Translation - Rigid (translation + rotation) - Similarity (translation + rotation + isotropic scaling) - Affine - Elastic (via bUnwarpJ with cubic B-splines) - Moving least squares All models are aided by automatically extracted SIFT features.

has function
need a thumbnail
Description

This plugin will return on a full 256-grey level image (limitation in this version) or on a ROI several texture features such as described in Haralick publication. Can be run in batch mode.

need a thumbnail
Description

Quantification of HER2 immunohistochemistry.

ImmunoMembrane is an ImageJ plugin for assessing HER2 immunohistochemistry, described in [bib]2472[/bib]. It is important to read the URL documentation and original paper to understand how to use the plugin appropriately.

There is web service available. Users can upload image data to process them and get cell membrane to be segmented: Web ImmunoMembrane

Note also that the pixel size is not read automatically from the image, but rather the source image scale should be entered into the dialog box - and the image rescaled accordingly prior to analysis. This scale value is the inverse of the value normally found for pixel width and pixel height under Image -> Properties... (i.e. pixel width & height are given in microns per pixel; the dialog box asks for pixels per micron).

has topic
Description

For each ROI, provides the ratio of pixels over a given threshold over the total number of pixels in the ROI.

has topic
Description

This method allows to compute a threshold that preserves the moments of an image. In ImageJ/Fiji, you can access it in Image->Ajust->Threshold and choose Moments in the list. In Aphelion, the tool is in Segmentation->Threshold->AphImgMomentThreshold The original paper is 2449

need a thumbnail
Description

Analyzing Ca2+ sparks

ImageJ plugin to detect and measure Ca2+ sparks in linescan images, described in Picht et. al. (2007). The algorithm is based on that described by Cheng et al. (1999). Care should be taken to ensure that detections belong to 'true' events, as without any additional background subtraction steps the algorithm is not appropriate for images in which the baseline fluorescence varies substantially.

Description

This tool allows for extraction of image series from Olympus Slide Scanners. These VSI files usually contain several images that are too big to load into memory (>50k x 50k pixels). It was written and tested on Fiji and is available from a Fiji Update Site: http://fiji.sc/List_of_update_sites

has function
VSI screenshot