Particle tracking

Description


Relate is a correlative software package optimised to work with EM, EDS, EBSD, & AFM data and images.  It provides the tools you need to correlate data from different microscopes, visualise multi-layered data in 2D and 3D, and conduct correlative analyses.

  • Combining data from different imaging modalities (e.g. AFM, EDS & EBSD)

  • Interactive display of multi-layer correlated data

  • Analytical tools for metadata interrogation

  • Documented workflows and processes

Correlate

  • Import data from AZtec using the H5oina file format
  • Import AFM data
  • Correlate both sets of data using intuitive image overlays and image matching tools
  • Produce combined multimodal datasets

Visualise

  • 2D display of multi-layered data
  • 3D visualisation of topography combined with AFM material properties, EM images, and EDS & EBSD map overlays
  • Customisation of colour palettes, data overlays, image rendering options, and document display
  • Export images and animations

Analyse

  • Generate profile (cross section) views of multimodal data
  • Measure and quantify data across multiple layers
  • Analyse areas via data thresholding using amount of x-ray counts, phase maps, height, or other material properties.
  • Select an extensive range of measurement parameters
  • Export analytical data to text or CSV files
Relate analysis workflow example
Description

Track non-dividing particles in 2D time-lapse image.

has topic
has function
need a thumbnail
Description

Particle tracking in 2D time-lapse based on linking closest regional intensity minima (user defined noise tolerance) detected from Laplacian of Gaussian filtered images (user defined radius). A maximum linking distance is set (user defined).

has function
need a thumbnail
Description

This plugin ships automated methods for extracting trajectories of multiples objects in a sequence of 2D or 3D images. Up to version 2 it was known as the ‘Probabilistic particle tracker’ plugin.

need a thumbnail

Analysis of Microtubule Orientation: Tracking with ImageJ, Directionality Analysis with Matlab

Submitted by Perrine on Mon, 04/08/2019 - 14:02

We take an example image data of microtubule binding protein EB1, and will study how to automatically track those signals and how to analyze the tracking results. We use ImageJ for measuring the temporal changes in signal positions, and will feed the tracking results for analyzing their dynamics using Matlab in the following session.

EB1 tracking with Matlab

Submitted by Perrine on Mon, 04/08/2019 - 11:05

This module follow EB1 tracking with IJ. In this session, we will visualize the tracking results and also cover typical analysis protocols for the quantitative analysis of movement. Two dynamic numerical features could be extracted from tracking results: speed and direction. Estimation of movement speed from multiple trajectories is a popular indicator of movement, and we will quickly go over the method for estimating the average speed of EB1 movement along microtubule. Movement direction is another quantitative feature, but is rarely explored.

EB1 tracking with IJ

Submitted by Perrine on Mon, 04/08/2019 - 11:00

We take an example image data of microtubule binding protein EB1, and will study how to automatically track those signals and how to analyze the tracking results. We use ImageJ for measuring the temporal changes in signal positions, and will feed the tracking results for analyzing their dynamics using Matlab in the following session EB1 tracking with Matlab.

Description

"PTA2 is an ImageJ1.x plugins that enable automatic particle tracking"

This plugin is developed specifically for single-molecule imaging, so it's good at tracking spots with noisy background. 

has function
Description

SIMPLETRACKER a simple particle tracking algorithm that can deal with gaps.

Tracking , or particle linking, consist in re-building the trajectories of one or several particles as they move along time. Their position is reported at each frame, but their identity is yet unknown: we do not know what particle in one frame corresponding to a particle in the previous frame. Tracking algorithms aim at providing a solution for this problem. 

simpletracker.m is - as the name says - a simple implementation of a tracking algorithm, that can deal with gaps. A gap happens when one particle that was detected in one frame is not detected in the subsequent one. If not dealt with, this generates a track break, or a gap, in the frame where the particle disappear, and a false new track in the frame where it re-appear. 

need a thumbnail
Description

This method was originally designed to track objects (not necessarily spots) already identified in 2D 
frames and has been applied previously to particle tracking and analysis in high-speed atomic force microscopy image series.


need a thumbnail
Description

Image-processing algorithms developed at the MOSAIC Group for fluorescence microscopy. Tools included:

  • 2D/3D single-particle tracking tool which can be used to track bright spots in 2D/3D movies over time.
  • Optimal filament segmentation of 2D images. 
  • Curvature filters for image filtering, denoising, and restoration. 
  • Image naturalization for image enhancement based on gradient statistics of natural-scence images. 
  • Tool for automatically send and distribute jobs on clusters and get back the results.
  • Multi-region image segmentation of 2D and 3D images without needing to know the number of regions beforehand. 
  • Squassh for globally optimal segmentation of piecewise constant regions in 2D and 3D images and for object-based co-localization analysis. 
  • Tool for inferring spatial interactions between patterns of objects in images or between coordinates read from a file.
  • Tool for robust, histogram-based background subtraction well suited to correct for inhomogeneous illumination artifacts.
  • A tool to estimate the Point-Spread Function of the microscopy out of 2D fluorescence images.
  • A tool to measure the 3D Point-Spread Function of a confocal microscope from an image stack.
  • Addition of synthetic Poisson-distributed noise to an image in order to simulate shot noise of various signal-to-noise ratios. 
  • Convolution of an image with a Bessel function in order to simulate imaging with a microscope. 
  • A utility to detect bright spots in images and estimate their center. 
  • A utility to create manual segmentations to be used as ground truth to test and benchmark automatic segmentation algorithms.
  • A tool for replacing one color in an image with another color.
has topic
Description

MosaicIA is a tool to analyze the spatial distribution of objects in images. It estimates from an observed particle or object distribution what hypothetical interaction between the objects is most likely to have created this distribution.

need a thumbnail
Description

Implementation of some image correlation spectroscopy tools

need a thumbnail
Description

The workflow consists of firstly identifying spot (which can be also gravity center of cells identified by another method), and then secondly compute trajectories by linking these spots by global optimisation with a cost function. This method is part of the methods evaluated in Chanouard et al (2014) as "method 9" and is described in detail in its supplementary PDF (page 65).

Dependencies

Following plugins are required.

  1. JAR to be placed under IJ plugin directory
  2. A pdf file with instructions and output description is also available in the zip .
  3. MTrackJ : Used for visualization of tracks. Preinstalled in Fiji.
  4. Imagescience.jar: This library is used by MTrackJ. Use update site to install this plugin.
  5. jama.jar. Preinstalled in Fiji.

##Advantages:

  • support blinking (with a parameters allowing it or not)
  • fast,
  • can be used in batch, some analysis results provided.
  • No dynamic model.
  • The tracking part is not dependent of ImageJ.

Pitfalls:

  • does not support division
  • the optimization algorithm used is a simulated annealing, so results can be slightly different between two runs.
  • No Dynamic model (so less good results but can be used for a first study of the kind of movements)

##The sample data

The parameters used for this example data Beads, were

  1. detection: 150
  2. the max distance in pixels: 20
  3. max allowed disappearance in frame: 1
Description

The quantification is explained in detail in chapter 8 "Cell Polarity - Focal Adhesion and Actin Dynamics in Migrating Cells" in "Bioimage Data Analysis Book" downloadable from here.

For codes and sample images, download the zipped archive (linked under "Download").

has function
Description

u-track is a multiple-particle tracking Matlab software that is designed to (1) track dense particle fields, (2) close gaps in particle trajectories resulting from detection failure, and (3) capture particle merging and splitting events resulting from occlusion or genuine aggregation and dissociation events. Its core is based on formulating correspondence problems as linear assignment problems and searching for a globally optimal solution.

Data can be read using bio-format and interfaced with OMero data base.

It comes as a standalone software, but can be used as a library, which is according to the authors the most widely used version of it.

  • Version 2.2 adds parallel processing functionality for multi-movie datasets when using the GUI.
  • Version 2.1 enables the analysis of movies stored on an OMERO server
  • Version 2.0 includes two new tracking applications: microtubule plus-end tracking (previously distributed as plusTipTracker) and nuclei tracking
  • A third optional processing step has been added to the analysis workflow, track analysis, with two methods: motion analysis and microtubule plus-end classification

For more information, please see Jaqaman et al., Nature Methods 5, pp. 695-702 (2008). Besides basic particle tracking, the software supports the features described in Applegate et al. J. Struct. Biol. 176(2):168-84. 2011 for tracking microtubule plus end markers; and in Ng et al. J. Cell Biol. 199(3):545-63. 2012 for tracking fluorescently-labeled cell nuclei.


Description

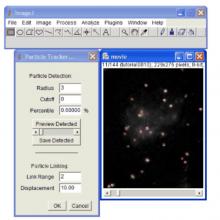
Easy-to-use, computationally efficient, two- and three-dimensional, feature point-tracking tool for the automated detection and analysis of particle trajectories as recorded by video imaging in cell biology. 


The tracking process requires no apriori mathematical modelling of the motion, it is self-initialising, it discriminates spurious detections, and it can handle temporary occlusion as well as particle appearance and disappearance from the image region. 


The plugin is well suited for video imaging in cell biology relying on low-intensity fluorescence microscopy. It allows the user to visualize and analyze the detected particles and found trajectories in various ways:

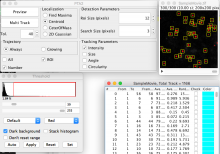
  • Preview and save detected particles for separate analysis
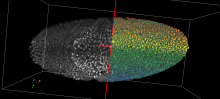
  • Global non progressive view on all trajectories
  • Focused progressive view on individually selected trajectory
  • Focused progressive view on trajectories in an area of interest

It also allows the user to find trajectories from uploaded particles position and information text files and then to plot particles parameters vs. time - along a trajectory

Description

A set of classes and functions which can be used by plugins performing spot detection and spot tracking.

need a thumbnail
Description

TrackMate provides the tools to perform single particle tracking (SPT). SPT is an image analysis challenge where the goal is to segment and follow over time some labeled, spot-like structures. Each spot is segmented in multiple frames and its trajectory is reconstructed by assigning it an identity over these frames, in the shape of a track. These tracks can then be either visualized or yield further analysis results such as velocity, total displacement, diffusion characteristics, division events, etc...