Automated

Description

MTrack is a tool, which detects, tracks, and measures the behavior of fluorescently labeled microtubules imaged by TIRF (total internal reflection fluorescence) microscopy. In such an in vitro reconstitution approach, stabilized, non-dynamic microtubule seeds serve as nucleation points for dynamically growing microtubules.

MTrack is a bi-modular tool. The first module detects and tracks the growing microtubule ends and creates trajectories. The second module uses these trajectories to fit models of dynamic behavior (polymerization and depolymerization velocities, catastrophe and rescue frequencies). It also computes statistics such as length and lifetime distributions when analyzing more than one movie (batch mode).

has topic
Track Filament shaped objects and analyze tracks using Ransac fits.
Description

"The plugin analyzes fluorescence microscopy images of neurites and nuclei of dissociated cultured neurons. Given user-defined thresholds, the plugin counts neuronal nuclei, and traces and measures neurite length."[...]" NeuriteTracer is a fast simple-to-use ImageJ plugin for the analysis of outgrowth in two-dimensional fluorescence microscopy images of neuronal cultures. The plugin performed well on images from three different types of neurons with distinct morphologies."

This plugin requires parameter setting: Threshold levels and scale (see more details on the related publication)

Description

The BigStitcher is a software package that allows simple and efficient alignment of multi-tile and multi-angle image datasets, for example acquired by lightsheet, widefield or confocal microscopes. The software supports images of almost arbitrary size ranging from very small images up to volumes in the range of many terabytes, which are for example produced when acquiring cleared tissue samples with lightsheet microscopy.

Description

We have developed a novel approach, named DF-Tracing, to tackle this challenge. This method first extracts the neurite signal (foreground) from a noisy image by using anisotropic filtering and automated thresholding. Then, DF-Tracing executes a coupled distance-field (DF) algorithm on the extracted foreground neurite signal and reconstructs the neuron morphology automatically. Two distance-transform based “force” fields are used: one for “pressure”, which is the distance transform field of foreground pixels (voxels) to the background, and another for “thrust”, which is the distance transform field of the foreground pixels to an automatically determined seed point. The coupling of these two force fields can“push” a “rolling ball” quickly along the skeleton of a neuron, reconstructing the 3D cell morphology.

Simple Tracing - DT-fields
Description

The wound healing tool measures the area of a wound in a time series of images of cellular tissue. The tool will measure the area of the wound, i.e. the area that does not contain tissue, in each image. The segmentation is based on the fact that the image is more homogeneous in the region of the wound as in the region of the tissue. Via the options, one of two methods to detect the empty area, can be selected. The first uses edge detection, the second a variance filter. Holes in the detected tissue are filled using morphological operations.

Measure area of the wound
Description

The skin tools measure the thickness of the epidermis and the interdigitation index.

The input images are masks that represent the epidermis and that have been created from images of stained histological sections. The mask must touch the left and right border of the image. The dermal-epidermal border must be on the lower site of the image. The interdigitation index can be measured for one or more segments per image. As a measure of the thickness of the epidermis the lengths of a number of random line segments are measured. The line segments start at the lower border, are perpendicular to the lower border and end at the opposite border of the mask.

See installation Instructions on the website.

has topic
Measure thickness from a mask
Description

nctuTW is a "high-throughput computer method of reconstructing the neuronal structure of the fruit fly brain. The design philosophy of the proposed method differs from those of previous methods. We propose first to compute the 2D skeletons of a neuron in each slice of the image stack. The 3D neuronal structure is then constructed from the 2D skeletons. Biologists tend to use confocal microscopes for optimal images in a slice for human visualization; and images in two consecutive slices contain overlapped information. Consequently, a spherical object becomes oval in the image stack; that is, neurons in the image stack do not reflect the true shape of the neuron. This is the main reason we chose not to work directly on the 3D volume.

The proposed method comprises two steps. The first is the image processing step, which involves computing a set of voxels that is a superset of the 3D centerlines of the neuron. The shortest path graph algorithm then computes the centerlines. The proposed method was applied to process more than 16 000 neurons. By using a large amount of reconstructions, this study also demonstrated a result derived from the reconstructed data using the clustering technique." (Extracted from reference publication)

Illustrative image shows gold standard (top) and method results (bottom). 

nctuTW_results_example
Description

Part of ATLAS software

Comment / Instructions: 

You can upload your image at the Mobyle@SERPICO portal and download the result. The workflow is only available online, i.e. no download possible.

Description

A complete, cross-platform solution to record, convert and stream audio and video.

An ImageJ plugin is available for using FFMPEG in ImageJ. Add its update sites (see the listing here)

For handling video files in ImageJ/Fiji, see also here.

has function
Description

This plugin filters a 3D image stack (or 2D image) to produce a score for how "tube-like" each point in the image is. This is useful as a preprocessing step for tracing neurons or blood vessels, for example. For 3D image stacks, the plugin uses the eigenvalues of the Hessian matrix to calculate this measure of "tubeness", using a metrics mentioned in Sato et al 1997 ¹: if the larger two eigenvalues (λ₂ and λ₃) are both negative then value is √(λ₂λ₃), otherwise the value is 0. For 2D images, if the large eigenvalue is negative, we return its absolute value and otherwise return 0.

This plugin is now bundled as part of Fiji.

Description

The Adipocytes Tools help to analyze fat cells in images from histological section. This is a rather general cell segmentation approach. It can be adapted to different situations via the parameters. This means that you have to find the right parameters for your application.

Sample Image: [0178_x5_3.tif](http://dev.mri.cnrs.fr/attachments/190/0178_x5_3.tif)

has topic
has function
Description

This plugin is used to infer the preferred orientation of structures present in the input image. It computes a histogram indicating the amount of structures in a given direction. Images with completely isotropic content are expected to give a flat histogram, whereas images in which there is a preferred orientation are expected to give a histogram with a peak at that orientation. On top of the histogram, the plugin tries to generate statistics on the highest peak found.

The plugin offers the possibility to generate an orientation map, where the image is colored according to its local directionality, or location orientation. 

The plugin is part of Fiji, can be launched through the menu: Analyze > Directionality

orientation histogram
Description

ORION: Online Reconstruction and functional Imaging Of Neurons: segmentation and tracing of neurons for reconstruction.

A project to develop tools that explore single neuron function via sophisticated image analysis. ORION software bridges advanced optical imaging and compartmental modeling of neuronal function by rapidly, accurately, and robustly generating, from structural image data, a cylindrical morphology model suitable for simulating neuronal function. The goal of this project is to develop a computational and experimental framework to allow real-time mapping of functional imaging data (e.g., spatio-temporal patterns of dendritic voltages or intracellularions) to neuronal structure, during the very limited duration of an acute experiment.

ORION_example_result
Description

Measures wound-healing assay videos, 

 For each video, the velocity and the order parameter are analyzed in time and space to extract quantitative parameters characterizing the cell motility phenotype. The different conditions (videos) can then be classified according to these parameters.

AveMAP
Description

The invention comprises a software tool, NeuronMetrics, which functions as a set of modules that run in the open-source program ImageJ. NeuronMetrics features a novel method for estimating neural “branch number” (a measure of the axonal complexity) from two-dimensional images. In addition, the tool features a novel method for modeling neural structure in large “gaps” that result from image artifacts.


has topic
need a thumbnail
Description

Computes image Hessian
Based on the algorithm described in the paper below. 

Splines: A Perfect Fit for Signal and Image Processing
M. Unser
IEEE Signal Processing Magazine, vol. 16, no. 6, pp. 22-38, November 1999.
 DOI: 10.1109/79.799930
 http://ieeexplore.ieee.org/document/799930/

has function
need a thumbnail
Description

Computes image Laplacian


Based on the algorithm described in the paper below. 

Splines: A Perfect Fit for Signal and Image Processing
M. Unser
IEEE Signal Processing Magazine, vol. 16, no. 6, pp. 22-38, November 1999.
 DOI: 10.1109/79.799930
 http://ieeexplore.ieee.org/document/799930/

has function
need a thumbnail
Description

Computes image gradient


Based on the algorithm below. 

Splines: A Perfect Fit for Signal and Image Processing
M. Unser
IEEE Signal Processing Magazine, vol. 16, no. 6, pp. 22-38, November 1999.
 DOI: 10.1109/79.799930
 http://ieeexplore.ieee.org/document/799930/

has topic
has function
need a thumbnail
Description

Neural Circuit Tracer (NCTracer) is open source software for automated and manual tracing of neurites from light microscopy stacks of images. NCTracer has more than one workflow available for neuron tracing. 


"The Neural Circuit Tracer is open source software built using Java (Sun Microsystems) and Matlab (MathWorks, Inc., Natick MA). It is based on the core of ImageJ (http://rsbweb.nih.gov/ij) and the graphic user interface has been developed by using Java Swings. The software combines anumber of functionalities of ImageJ with several newly developed functions for automated and manual tracing of neurites. The Neural Circuit Tracer is designed in a way
that will allow the users to add any plug-ins developed for ImageJ. More importantly, functions written in MatLab and converted into Java with Matlab JA toolbox can also be added to the Neural Circuit Tracer." 

Example of output from Neural Circuit Tracer
Description

AnaMorf is a plug-in developed for the ImageJ platform (rsb.info.nih.gov/ij) to analyse the microscopic morphology of filamentous microbes. The program returns average data on a population of mycelial elements, using the descriptors projected area, circularity, total hyphal length, number of hyphal tips, hyphal growth unit, lacunarity and fractal dimension. The plug-in accepts as input a user-specified directory of images, analysing each and outputing tabulated results.

has function
AnaMorph
Description

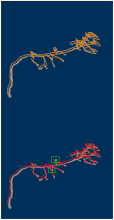
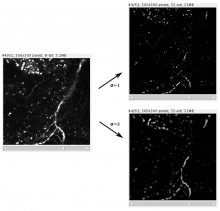
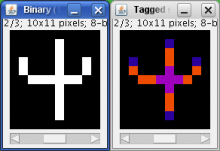
This plugin tags all pixel/voxels in a skeleton image and then counts all its junctions, triple and quadruple points and branches, and measures their average and maximum length.

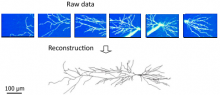
Tags are shown in a new window displaying every tag in a different color. You can find it under [Plugins>Skeleton>Analyze Skeleton (2D/3D)]. See Skeletonize3D for an example of how to produce skeleton images.

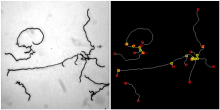
The voxels are classified into three different categories depending on their 26 neighbors: - End-point voxels: if they have less than 2 neighbors. - Junction voxels: if they have more than 2 neighbors. - Slab voxels: if they have exactly 2 neighbors.

End-point voxels are displayed in blue, slab voxels in orange and junction voxels in purple.

Notice here that, following this notation, the number of junction voxels can be different from the number of actual junctions since some junction voxels can be neighbors of each other.


Output data type: table result, image of the skeleton


Description

MorphoGraphX is a free Linux application for the visualization and analysis of 3D biological datasets. Developed by researchers, it is primarily used for the analysis and quantification of 3D live-imaged confocal data sets.

The main research interests adressed by MorphoGraphX are:

  • Shape extraction
  • Growth analysis
  • Signal quantification
  • Protein localization
has function
MorphoGraphX user interface