

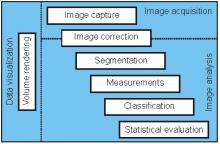
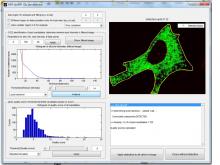
Working with objects: measurements in 2D and 3D
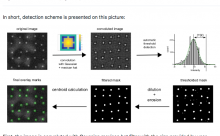
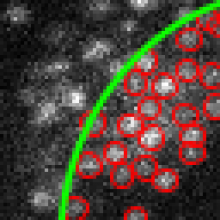
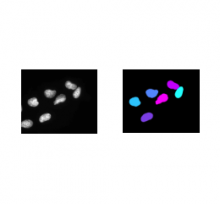
ImageJ, GUI training for beginners, Count and Measure 2D nuclei,Count number of foci on 3D image , compare 2D, 2.5D, 3D results (simple workflows)
ImageJ, GUI training for beginners, Count and Measure 2D nuclei,Count number of foci on 3D image , compare 2D, 2.5D, 3D results (simple workflows)
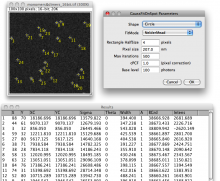
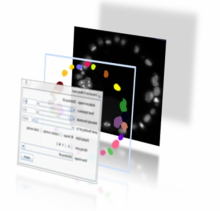
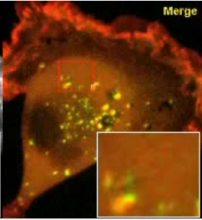
Imaris, Visualization, spots segmentation, surfaces segmentation, colocalization, spots tracking, Batch, plotting graphs with Vantage.
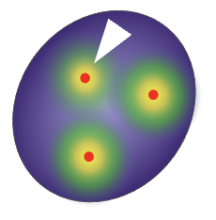
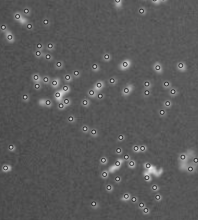
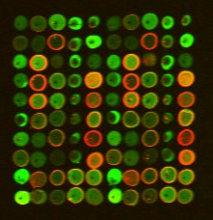
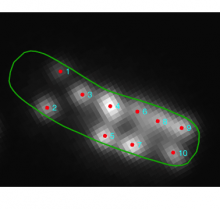
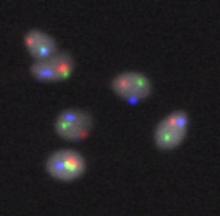
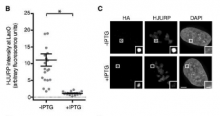
CellProfiler, Counting PLA dots, track swelling organoids
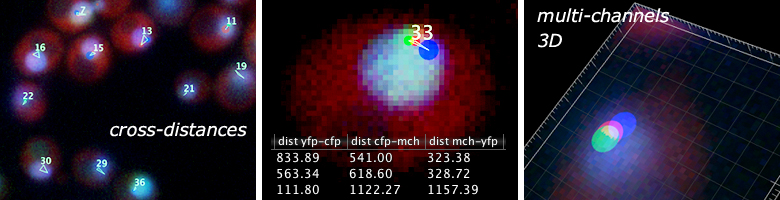
Imaris scripting using Matlab (ImarisXT API trining). Slides, protocols, some scripts. Hands-on


