Interactive segmentation

Synonyms
Manual segmentation
Description

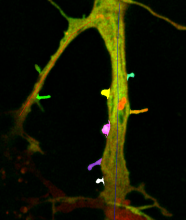
Spine Analyzer allows to semi-automatically segment dendritic spines in 3D+t images and to measure their volumes and the intensities of the signal within in different channels over time.

Neurites with segmented dendritic spines
Description

The authors present an ImageJ-based, semi-automated phagocytosis workflow to rapidly quantitate three distinct stages during the early engulfment of opsonized beads.

Description

SMLM is a mature but still growing field, which still lacks efficient and user-friendly analysis and visualization software platform adapted for both users and developers. We here introduce PoCA, a powerful open-source software platform dedicated to the visualization and analysis of 2D and 3D point-cloud data. PoCA allows manipulating large datasets, and integrates a plugin architecture, a native batch analysis engine and a Python code interpreter, facilitating both the analysis of data and the integration of new methods.

Visualization, segmentation and exploration of 3D SMLM data
Description

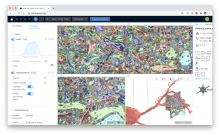
webKnossos is an open-source data sharing and annotation platform for tera-scale 2D and 3D image datasets.

The core features of webKnossos are:

  • fast 3D data streaming
  • share links to specific locations in the data
  • uniquely fast skeleton annotation (flight mode) and
  • efficient volume annotation
  • mesh rendering
  • collaboration and sharing tools

webKnossos facilitates image analysis workflows on multi-terabyte datasets, including visualization of raw and multi-modal microscopy data, distributed training data generation and proof-reading of automatic segmentation.

As a scientific resource, webknossos.org serves as a database for published image datasets including their annotations.


Description

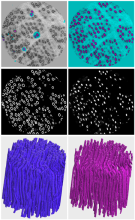
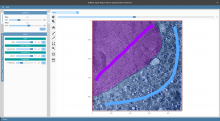
This tool allows the user to define structures of interest by interactively marking a subset of pixels. Thanks to the real-time feedback, the user can place new markings strategically, depending on the current outcome.

Description

Dragonfly is a software platform for the intuitive inspection of multi-scale multi-modality image data. Its user-friendly experience translates into powerful quantitative findings with high-impact visuals, driven by nuanced easy-to-learn controls.

For segmentation: It provides an engine fior machine Learning, Watershed and superpixel methods, support histological data .

It offers a 3D viewer, and python scripting capacities .

It is free for reserach use, but not for commercial usage.

DragonFly
Description

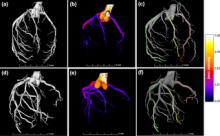
This workflow describes a semi-automatic image segmentation procedure for 3D reconstructions of the coronary arterial tree, after which how different morphometric features are automatically extracted, including vessel lumen diameter of the three main coronaries.

Description

There are many methods in bio-imaging that can be parametrized. This gives more flexibility
to the user as long as tools provide easy support for tuning parameters. On the other hand, the
datasets of interest constantly grow which creates the need to process them in bulk. Again,
this requires proper tool support, if biologist is going to be able to organize such bulk
processing in an ad-hoc manner without the help of a programmer. Finally, new image
analysis algorithms are being constantly created and updated. Yet, lots of work is necessary to
extend a prototype implementation into product for the users. Therefore, there is a growing
need for software with a graphical user interface (GUI) that makes the process of image
analysis easier to perform and at the same time allows for high throughput analysis of raw
data using batch processing and novel algorithms. Main program in this area are written in
Java, but Python grow in bioinformatics and will be nice to allow easy wrap algorithm written
in this language.
Here we present PartSeg, a comprehensive software package implementing several image
processing algorithms that can be used for analysis of microscopic 3D images. Its user
interface has been crafted to speed up workflow of processing datasets in bulk and to allow
for easy modification of algorithm’s parameters. In PartSeg we also include the first public
implementation of Multi-scale Opening algorithm descibed in [1]. PartSeg allows for
segmentation in 3D based on finding connected components. The segmentation results can be
corrected manually to adjust for high noise in the data. Then, it is possible to calculate some
standard statistics like volume, mass, diameter and their user-defined combinations for the
results of the segmentation. Finally, it is possible to superimpose segmented structures using
weighted PCA method. Conclusions: PartSeg is a comprehensive and flexible software
dedicated to help biologists in processing, segmentation, visualization and the analysis of the
large microscopic 3D image data. PartSeg provides well established algorithms in an easy-touse,
intuitive, user-friendly toolbox without sacrificing their power and flexibility.


Examples include Chromosome territory analysis.

PartSeg
Description

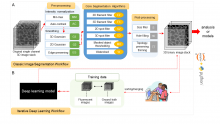
The Allen Cell Structure Segmenter is a Python-based open source toolkit developed at the Allen Institute for Cell Science for 3D segmentation of intracellular structures in fluorescence microscope images.

It consists of two complementary elements:

  1. Classic image segmentation workflows for 20 distinct intracellular structure localization patterns. A visual “lookup table” is outlining the modular algorithmic steps for each segmentation workflow. This provides an intuitive guide for selection or construction of new segmentation workflows for a user’s particular segmentation task. 
  2. Human-in-the-loop iterative deep learning segmentation workflow trained on ground truth manually curated data from the images segmented with the segmentation workflow. Importantly, this module was not released yet.


The Allen Cell Structure Segmenter Overview
Description

The interactive Watershed Fiji plugin provides an interactive way to explore local maxima and threshold values while a resulting label map is updated on the fly.

After the user has found a reliable parameter configuration, it is possible to apply the same parameters to other images in a headless mode, for example via ImageJ macro scripting.

Description

Orbit Image Analysis is a free open source software with the focus to quantify big images like whole slide scans.

It can connect to image servers, e.g. Omero.
Analysis can be done on your local computer or via scaleout functionality in a distrubuted computing environment like a Spark cluster.

Sophisticated image analysis algorithms incl. tissue quantification using machine learning, object segmentation and classification are build in. In addition a versatile API allows you to enhance Orbit and to run your own scripts.

Orbit
Description

  FlyLimbTracker is  a method that uses active contours to semi-automatically track body and leg segments from video image sequences of unmarked, freely behaving Drosophila flies. This approach can be used to measure leg segment motions during a variety of locomotor and grooming behaviors.

For now the plugin have to be downlaoded directly from the EPFL website (see link), not from the search bar as usual in ICY.


Drosophila track legs
Description

SuRVoS: Super-Region Volume Segmentation workbench

A volume is first partitioned into Super-Regions (superpixels or supervoxels) and then interactively segmented by the user providing training annotations. SuRVoS can then learn from and extend the annotations to the whole volume.

User interface of SuRVoS showing example annotation on soft x-ray tomography data
Description

Summary

QuimP is software for tracking cellular shape changes and dynamic distributions of fluorescent reporters at the cell membrane. QuimP's unique selling point is the possibility to aggregate data from many cells in form of spatio-temporal maps of dynamic events, independently of cell size and shape. QuimP has been successfully applied to address a wide range of problems related to cell movement in many different cell types. 

Introduction

In transmembrane signalling the cell membrane plays a fundamental role in localising intracellular signalling components to specific sites of action, for example to reorganise the actomyosin cortex during cell polarisation and locomotion. The localisation of different components can be directly or indirectly visualised using fluorescence microscopy, for high-throughput screening commonly in 2D. A quantitative understanding demands segmentation and tracking of whole cells and fluorescence signals associated with the moving cell boundary, for example those associated with actin polymerisation at the cell front of locomoting cells. As regards segmentation, a wide range of methods can be used (threshold based, region growing, active contours or level sets) to obtain closed cell contours, which then are used to sample fluorescence adjacent to the cell edge in a straightforward manner. The most critical step however is cell edge tracking, which links points on contours at time t to corresponding points at t+1. Optical flow methods have been employed, but usually fail to meet the requirement that total fluorescence must not change. QuimP uses a method (ECMM, electrostatic contour migration method (Tyson et al., 2010) which has been shown to outperform traditional level set methods. ECMM minimises the sum of path lengths connecting all pairs of points, equivalent to minimising the energy required for cell deformation. The original segmentation based on an active contour method and outline tracking algorithms have been described in (Dormann et al., 2002; Tyson et al., 2010; Tyson et al., 2014).

Screenshot
Description

QuPath is open source software for Quantitative Pathology. QuPath has been developed as a research tool at Queen's University Belfast.

QuPath
Description

TurtleSeg is an interactive 3D image segmentation tool. TurtleSeg has an automated system, Spotlight, for automatically directing the user towards the next steps. Typically, a user loads a 3D image and then manually contour a sparse number of slices, the full 3D segmentation can then be built automatically.

need a thumbnail
Description

MosaicIA is a tool to analyze the spatial distribution of objects in images. It estimates from an observed particle or object distribution what hypothetical interaction between the objects is most likely to have created this distribution.

need a thumbnail
Description

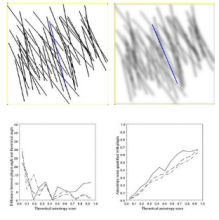
Evaluates the orientation of fiber orientation pattern and plots the results in the image. It calculates gradient in x and y direction. - then calculates the eigenvector of nematic tensor, which is the orientation of the pattern.

Description

ITK-SNAP is a software application used to segment structures in 3D medical images. It can also be used as a 3D annotation tool for deep learning. It is based on ITK, VTK libraries.

Description

**Collaborative Annotation Toolkit for Massive Amounts of Image Data** CATMAID is a Collaborative Annotation Toolkit for Massive Amounts of Image Data. It is designed to navigate, share and collaboratively annotate massive image data sets of biological specimens. The interface is inspired by GoogleMaps, with which it shares basic navigation concepts, enhanced to allow the exploration of 3D biological image data acquired by optical or physical sectioning microscopy techniques. The interface enables seamless sharing of regions of interest through bookmarks and synchronized navigation through multiple registered data sets. With massive biological image data sets it is unrealistic to create a sustainable centralized repository. A unique feature of CATMAID is its partially decentralized architecture where the presented image data can reside on any Internet accessible server and yet can be easily cross-referenced in the central database. In this way no image data are duplicated and the data producers retain full control over their images. CATMAID is intended to serve as data sharing platform for biologists using high-resolution imaging techniques to probe large specimens. Any high-throughput, high-content imaging project such as gene expression pattern screens would benefit from the interface for data sharing and annotation.

CATMAID
Description

Semi-automated segmentation of 3D objects (e.g. neurons) based on user-provided seeds.

need a thumbnail
Description

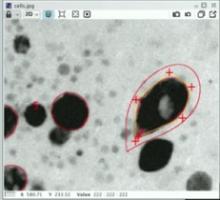
This plug-in implements fast active contours for image segmentation. Their representation in terms of spline curves allows for a natural and intuitive manipulation of the active contour through control points.

Based on Delgado-Gonzalo et al. "Snakes on a Plane: A Perfect Snap for Bioimage Analysis"