Image visualisation

Visualisation vs Plotting vs Image generation. Should these be merged? Which of these should be the top concept, and which sub-concepts, and which narrow synonyms?

Synonyms
Rendering
Lookup table
Description

ParaView is an open-source, multi-platform data analysis and visualization application. ParaView users can quickly build visualizations to analyze their data using qualitative and quantitative techniques. The data exploration can be done interactively in 3D or programmatically using ParaView’s batch processing capabilities.

ParaView was developed to analyze extremely large datasets using distributed memory computing resources. It can be run on supercomputers to analyze datasets of petascale size as well as on laptops for smaller data, has become an integral tool in many national laboratories, universities and industry, and has won several awards related to high performance computation.

paraviewbloodcells
Description

Blender is the free and open source 3D creation suite. It supports the entirety of the 3D pipeline—modeling, rigging, animation, simulation, rendering, compositing and motion tracking, even video editing and game creation.

Description

NeuroMorph is a toolset designed to import, analyze, and visualize mesh models in Blender. It has been developed specifically for the morphological analysis of 3D objects derived from serial electron microscopy images of brain tissue, but much of its functionality can be applied to any 3D mesh. These mesh objects can be generated by any 3D image segmentation software, such as ilastik or Fiji

Description

SimpleITK provides a simplified interface to ITK in a variety of languages. A user can either download pre-built binaries, if they are available for the desired platform and language, or SimpleITK can be built from the source code. Currently, Python binaries are available on Microsoft Windows, GNU Linux and Mac OS X. C# and Java binaries are available for Windows. We are also working towards supporting R packaging.

need a thumbnail
Description

CaPTk is a software platform for analysis of radiographic cancer images, currently focusing on brain, breast, and lung cancer. CaPTk integrates advanced, validated tools performing various aspects of medical image analysis, that have been developed in the context of active clinical research studies and collaborations toward addressing real clinical needs. With emphasis given in its use as a very lightweight and efficient viewer, and with no prerequisites for substantial computational background, CaPTk aims to facilitate the swift translation of advanced computational algorithms into routine clinical quantification, analysis, decision making, and reporting workflow. Its long-term goal is providing widely used technology that leverages the value of advanced imaging analytics in cancer prediction, diagnosis and prognosis, as well as in better understanding the biological mechanisms of cancer development.

CaPTk
Description

This ParaViewWeb Docker container is used by the Galaxy Project.  Paraview is an VTK based visualization server, for 3D.

ParaViewWeb in Galaxy
Description

MaMuT is an end user plugin that combines the BigDataViewer and TrackMate to provide an application that allow browsing, annotating and curating annotations for large image data.

Description

Drishti (from Sanskrit  word for "vision" or "insight") is a multi-platform, open-source volume-exploration and presentation tool. Written for visualizing tomography data, electron-microscopy data and the like.

Drishti
Description

The MIPAV (Medical Image Processing, Analysis, and Visualization) application enables quantitative analysis and visualization of medical images of numerous modalities such as PET, MRI, CT, or microscopy. Using MIPAV's standard user-interface and analysis tools, researchers at remote sites (via the internet) can easily share research data and analyses, thereby enhancing their ability to research, diagnose, monitor, and treat medical disorders.

Description

The BigDataViewer is a re-slicing browser for terabyte-sized multi-view image sequences. BigDataViewer was developed with multi-view light-sheet microscopy data in mind and integrates well with Fiji's SPIMage processing pipeline.

Description

BioImageXD is a free open source software package for analyzing, processing and visualizing multi-dimensional microscopy images. It's a collaborative project, designed and developed by microscopists, cell biologists and software engineers from the Universities of Jyväskylä and Turku in Finland, Max Planck Institute CBG in Dresden, Germany and collaborators worldwide. BioImageXD was published in the July 2012 issue of Nature Methods.

Screen capture of BioImageXD
Description

Advanced Cell Classifier is a data analyzer program to evaluate cell-based high-content screens and tissue section images developed at the Biological Research Centre, Szeged and FIMM, Helsinki (formerly at ETH Zurich). The basic aim is to provide a very accurate analysis with minimal user interaction using advanced machine learning methods.

Advanced Cell Classifier
Description

ASAP is an open source platform for visualizing, annotating and automatically analyzing whole-slide histopathology images. It consists of several key-components (slide input/output, image processing, viewer) which can be used seperately. It is built on top of several well-developed open source packages like OpenSlide, Qt and OpenCV but also tries to extend them in several meaningful ways.

need a thumbnail
Description

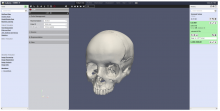
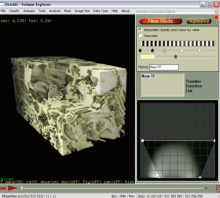
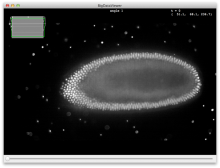
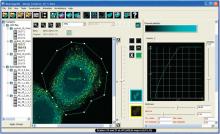
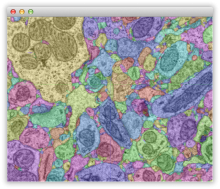
arivis Vision4D is a modular software for working with multi-channel 2D, 3D and 4D images of almost unlimited size independent of available RAM. Many imaging systems, such as high speed confocal, Light Sheet/ SPIM and 2 Photon systems, can produce a huge amount of multi-channel data, which arivis Vision4D handles without constraints. Terabyte ready arivis Vision4D main functionality: Easy import of most image formats from microsopes as well as biological formats High performance interactive 3D / 4D rendering on standard PCs and laptops with 3D Graphics Support Intuitive tools for stitching and alignment to create large multi-dimensional image stacks Immediate 2D, 3D and 4D visualization, annotation and analysis regardless of image size Creation, import, and export of 4D Iso-surfaces Powerful Analysis Pipeline for 3D /4D image analysis (cell segmentation, tracking, annotation, quantitative measurement and statistics, etc) Semi-automatic/manual segmentation and tracking with interactive Track Editor Easy design and export of 3D / 4D High Resolution Movies Seamless integration of custom workflows via Matlab API and Python scripting Data sharing for collaboration A user friendly software, easy to learn and use for any life scientist

need a thumbnail
Description

It is a tool to visualize and annotate volume image data of electron microscopy. Users can annotate objects (e.g. neurons) and skeleton structures. It provides the ability to overlaying the image data with user annotations, representing the spatial structure and the connectivity of labeled objects, and displaying a three dimensional model of it. It can be extended by plugins written in python. A similar, web-based implementation is being developed at webknossos.info. Example datasets are also available.

Annotation in Knossos
Description

A menu item in ImageJ that allows you to inspect a 3D stack with orthogonal views (XY, XZ, YZ planes). Slicing plane could be interactively moved by dragging crosses. Pedro Almada wrote a plugin to save the current orthogonal views as montage. ## ImageJ Macro Usages [Save orthogonal views | OrthoSaver](http://uic.igc.gulbenkian.pt/macros/OrthoSaver.ijm) >ImageJ's orthogonal viewer for 3D stacks doesn't let you easily save the current orthogonal view. This macro, once installed, lets users create a montage with the currently open orthogonal views and selection guides. To use it, open an image z-stack and open the orthogonal viewer. With the mouse, choose which are the sections of interest to you and without moving the mouse, press F2. You'll get a montage of the currently selected orthogonal view.

has function
need a thumbnail
Description

The Huygens Software Suite consists of different image processing packages with functionalities that include deconvolution, interactive analysis, and volume visualization of 2D-3D multi-channel and time series images from fluorescence microscopes such as widefield, confocal, multi-photon, spinning disk, Array Detector, STED, and Light Sheet

Description

**Collaborative Annotation Toolkit for Massive Amounts of Image Data** CATMAID is a Collaborative Annotation Toolkit for Massive Amounts of Image Data. It is designed to navigate, share and collaboratively annotate massive image data sets of biological specimens. The interface is inspired by GoogleMaps, with which it shares basic navigation concepts, enhanced to allow the exploration of 3D biological image data acquired by optical or physical sectioning microscopy techniques. The interface enables seamless sharing of regions of interest through bookmarks and synchronized navigation through multiple registered data sets. With massive biological image data sets it is unrealistic to create a sustainable centralized repository. A unique feature of CATMAID is its partially decentralized architecture where the presented image data can reside on any Internet accessible server and yet can be easily cross-referenced in the central database. In this way no image data are duplicated and the data producers retain full control over their images. CATMAID is intended to serve as data sharing platform for biologists using high-resolution imaging techniques to probe large specimens. Any high-throughput, high-content imaging project such as gene expression pattern screens would benefit from the interface for data sharing and annotation.

CATMAID
Description

View your multi-channel data as a montage with one image per channel plus a merged, color channel (useful to create figures for communication). 

This viewer plugin will split all N channels of the active sequence into a montage of N+1 images, with one image for each channel, plus an additionnal color (merge) rendering.

Description

Browse files in directories with thumbnails view

has function