nuclei

Description

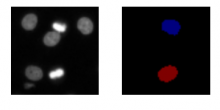
This workflow processes images of cells with discernible nuclei and outputs a binary mask containing where nuclei are detected.

need a thumbnail
Description

This one example workflow from the Cell Profiler(CP)  Examples . CP is commonly used to count cells or other objects as well as percent-positives, by measuring the per-cell staining intensity. This pipeline shows how to do both of these tasks, and demonstrates how various modules may be used to accomplish the same result. 

In a few words, it used the IdentifyPrimaryObject module of CellProfiler to detect nuclei from a channel (e.g DAPI), then again the same module on another channel to detect another probe (e.g some particular histone)  .

Then objects (nuclei) are related to the second object (Histone), to create a parent child-relation ship: where nuclei can have histone has child. Nuclei are then filtered according to the property of having histone (positive) or not having histone (negtiveobject) related to them.  If needed, nuclei can be expanded in order to include touching object rather than object inside only.

The percentage of positive nuclei vs total number of nuclei can then be computed using the CalculateMath Module.


Positivepercentcell
Description

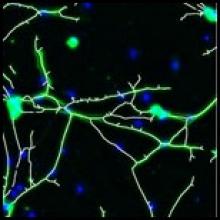
"The plugin analyzes fluorescence microscopy images of neurites and nuclei of dissociated cultured neurons. Given user-defined thresholds, the plugin counts neuronal nuclei, and traces and measures neurite length."[...]" NeuriteTracer is a fast simple-to-use ImageJ plugin for the analysis of outgrowth in two-dimensional fluorescence microscopy images of neuronal cultures. The plugin performed well on images from three different types of neurons with distinct morphologies."

This plugin requires parameter setting: Threshold levels and scale (see more details on the related publication)

Description

EBImage provides general purpose functionality for image processing and analysis. In the context of (high-throughput) microscopy-based cellular assays, EBImage offers tools to segment cells and extract quantitative cellular descriptors. This allows the automation of such tasks using the R programming language and facilitates the use of other tools in the R environment for signal processing, statistical modeling, machine learning and visualization with image data.

EBImage is available through the Bioconductor software project (www.bioconductor.org). Strengths Lightweight Suitable for automated, scripted analyses All functions are documented with examples Modular links to R and Bioconductor software, notably imageHTS and cellHTS2 Community support via the Bioconductor mailing list Reproducible (image) analysis using the Sweave report-writing system

EBImage