Image analysis

Synonyms
General image analysis
Description

EBImage provides general purpose functionality for image processing and analysis. In the context of (high-throughput) microscopy-based cellular assays, EBImage offers tools to segment cells and extract quantitative cellular descriptors. This allows the automation of such tasks using the R programming language and facilitates the use of other tools in the R environment for signal processing, statistical modeling, machine learning and visualization with image data.

EBImage is available through the Bioconductor software project (www.bioconductor.org). Strengths Lightweight Suitable for automated, scripted analyses All functions are documented with examples Modular links to R and Bioconductor software, notably imageHTS and cellHTS2 Community support via the Bioconductor mailing list Reproducible (image) analysis using the Sweave report-writing system

EBImage
Description

Measures wound-healing assay videos, 

 For each video, the velocity and the order parameter are analyzed in time and space to extract quantitative parameters characterizing the cell motility phenotype. The different conditions (videos) can then be classified according to these parameters.

AveMAP
Description

WND-CHARM is a multi-purpose image classifier that can be applied to a wide variety of image classification tasks without modifications or fine-tuning, and yet provides classification accuracy comparable to state-of-the-art task-specific image classifiers. WND-CHARM can extract up to ~3,000 generic image descriptors (features) including polynomial decompositions, high contrast features, pixel statistics, and textures. These features are derived from the raw image, transforms of the image, and compound transforms of the image (transforms of transforms). The features are filtered and weighted depending on their effectiveness in discriminating between a set of predefined image classes (the training set). These features are then used to classify test images based on their similarity to the training classes. This classifier was tested on a wide variety of imaging problems including biological and medical image classification using several imaging modalities, face recognition, and other pattern recognition tasks. WND-CHARM is an acronym that stands for "Weighted Neighbor Distance using Compound Hierarchy of Algorithms Representing Morphology."

Generated features
Description

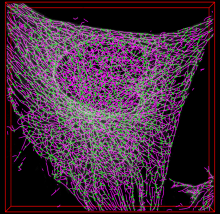
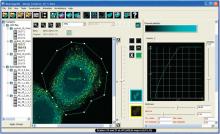
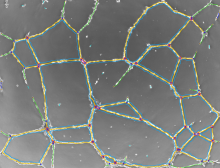
SOAX is an open source software tool to extract the centerlines, junctions and filament lengths of biopolymer networks in 2D and 3D images. It facilitates quantitative, reproducible and objective analysis of the image data. The underlying method of SOAX uses multiple Stretching Open Active Contours (SOACs) that are automatically initialized at image intensity ridges and then stretch along the centerlines of filaments in the network. SOACs can merge, stop at junctions, and reconfigure with others to allow smooth crossing at junctions of filaments.

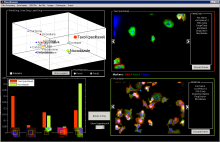
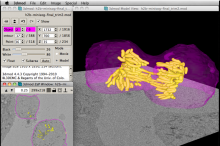
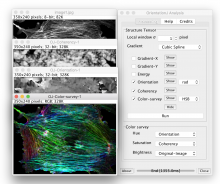
SOAX provides 3D visualization for exploring image data and visually checking results against the image. Quantitative analysis functions based on extracted networks are also implemented in SOAX, including spatial distribution, orientation, and curvature of filamentous structures. SOAX also provides interactive manual editing to further improve the extraction results, which can be saved in a file for archiving or further analysis. Useful for microtubules or actin filaments.

Observation: Depending on the operating system, the installation may or may not require Boost C++, ITK and VTK libraries. Windows has a standalone executable application without the need of those. 

snapshot microtubules soax
Description

BioImageXD is a free open source software package for analyzing, processing and visualizing multi-dimensional microscopy images. It's a collaborative project, designed and developed by microscopists, cell biologists and software engineers from the Universities of Jyväskylä and Turku in Finland, Max Planck Institute CBG in Dresden, Germany and collaborators worldwide. BioImageXD was published in the July 2012 issue of Nature Methods.

Screen capture of BioImageXD
Description

Advanced Cell Classifier is a data analyzer program to evaluate cell-based high-content screens and tissue section images developed at the Biological Research Centre, Szeged and FIMM, Helsinki (formerly at ETH Zurich). The basic aim is to provide a very accurate analysis with minimal user interaction using advanced machine learning methods.

Advanced Cell Classifier
Description

The ImageJFX Project aims to create a new user interface for the software ImageJ in order to ease scientific image analysis. While keeping the core components of ImageJ, ImageJFX brings scientists closer to their goal by making the interface clearer for beginners and more practical for advanced users.

ImageJFX screen Capture
Description

SIMcheck is an ImageJ plugin suite for assessing the quality and reliability of Structured Illumination Microscopy (SIM) data. The quality of the raw data, the quality of the reconstruction and the calibration of the microscope can be tested. 

has function
Simcheck screenschot
Description

The jicbioimage Python package makes it easy to explore microscopy data in a programmatic fashion (python).

Exploring images via coding means that the exploratory work becomes recorded and reproducible.

Furthermore, it makes it easier to convert the exploratory work into (semi) automated analysis work flows.

Features:

  • Built in functionality for working with microscopy data
  • Automatic generation of audit trails
  • Python integration Works with Python 2.7, 3.3 and 3.4
Description

arivis Vision4D is a modular software for working with multi-channel 2D, 3D and 4D images of almost unlimited size independent of available RAM. Many imaging systems, such as high speed confocal, Light Sheet/ SPIM and 2 Photon systems, can produce a huge amount of multi-channel data, which arivis Vision4D handles without constraints. Terabyte ready arivis Vision4D main functionality: Easy import of most image formats from microsopes as well as biological formats High performance interactive 3D / 4D rendering on standard PCs and laptops with 3D Graphics Support Intuitive tools for stitching and alignment to create large multi-dimensional image stacks Immediate 2D, 3D and 4D visualization, annotation and analysis regardless of image size Creation, import, and export of 4D Iso-surfaces Powerful Analysis Pipeline for 3D /4D image analysis (cell segmentation, tracking, annotation, quantitative measurement and statistics, etc) Semi-automatic/manual segmentation and tracking with interactive Track Editor Easy design and export of 3D / 4D High Resolution Movies Seamless integration of custom workflows via Matlab API and Python scripting Data sharing for collaboration A user friendly software, easy to learn and use for any life scientist

need a thumbnail
Description

ThunderSTORM is an open-source, interactive, and modular plug-in for ImageJ designed for automated processing, analysis, and visualization of data acquired by single molecule localization microscopy methods such as PALM and STORM. Our philosophy in developing ThunderSTORM has been to offer an extensive collection of processing and post-processing methods so that users can easily adapt the process of analysis to their data.

need a thumbnail
Description

Calculate the Fourier ring correlation (FRC). The FRC can be used as a resolution criterion for super resolution microscopy. The Plugin can display a plot of the FRC curve, along with the LOESS smoothed version of the curve. Finally it displays the threshold method used and the intersection of the FRC with the threshold, providing the FIRE number. It can be used on two open images or on pairs of images in batch mode. 2654 2655

need a thumbnail
Description

Quote:

The "Angiogenesis Analyzer" allows analysis of cellular networks. Typically, it can detect and analyze the pseudo vascular organization of endothelial cells cultured in gel medium

...a simple tool to quantify the ETFA (Endothelial Tube Formation Assay) experiment images by extracting characteristic information of the network.

The outputs are network feature parameters.

Sample images

http://image.bio.methods.free.fr/ij/ijmacro/Angiogenesis/HUVEC-Pseudo-Phase-Contrast.tif.zip

http://image.bio.methods.free.fr/ij/ijmacro/Angiogenesis/HUVEC-Fluo.tif.zip

Source code

https://imagej.nih.gov/ij/macros/toolsets/Angiogenesis%20Analyzer.txt

has topic
has function
Description

## About TANGO software is an open-source software for Analysis of Nuclear Genome Organization. It is composed of an ImageJ plugin for batch processing and analysis, and a R package for statistical analysis. Reference: 2528 ## Some key features - Image import uses bioimage formats. - Construction of workflow in GUI by choosing filters / segmentation strategy for - Prefiltering - Segmentation - Postfiltering - Isolated nuclei could individually be inspected, deleted from list and subjected for detailed analysis. - Uses MCIB3D library as backend. - Basic usage is to segment nucleus, crop them to single nucleus objects, segment substructures within objects and measure their properties. - Optionally R can be connected to do detailed analysis of results. - Uses MongoDB to manage huge data set.

need a thumbnail
Description

Implementation of some image correlation spectroscopy tools

need a thumbnail
Description

An easy to use, image analysis software package that enables rapid exploration and interpretation of microscopy data.

PhenoBrowser
Description

A commercial image analysis software. It's interface allows to easily perform measurements and image analysis. Your actions can be recorded and a macro (in a basic script language) can then be created. Almost no knowledge in programming is needed. You can also use python. A SDK is also available to develop stand alone applications in c++. Additional modules allow to use specific operations (3D operators... Examples of available categories of operators : filtering, edge detection, mathematical morphology, segmentation, Frequency operations, mathematical/logical operations, measurements...

need a thumbnail
Description

IMOD is a set of image processing, modeling and display programs used for tomographic reconstruction and for 3D reconstruction of EM serial sections and optical sections. The package contains tools for assembling and aligning data within multiple types and sizes of image stacks, viewing 3-D data from any orientation, and modeling and display of the image files.

Included are two programs with graphical interface: 3dmod, for displaying and segmenting 2D images and 3D volumes; etomo, for reconstructing tomographic volumes from tilt series of images.

Processing can be distributed on multiple cores and executed in batch mode.

iMod

ITK

Description

ITK is an open-source, cross-platform system that provides developers with an extensive suite of software tools for image analysis.

Developed through extreme programming methodologies, ITK employs leading-edge algorithms for registering and segmenting multidimensional data. It is widely used and contributed in the medical imaging field.

Strengths

Highly optimized C++, well commented Consistently updated (new) algorithms many tools and softwares are built upon it connected with VTK Insight Journal (open code and sample data) Extensive list of examples & tutorials

Limitations

yet detached from the bioimage analysis world hard to use for end users without development skills

itk
Description

not available anymore in version 3.0 and up?

has function
need a thumbnail
Description

Plugins for 3D Image processing and Analyisis in ImageJ. Previously (?) known as 3D ImageJ Suite.

need a thumbnail
Description

This segmentation method performs a N-class thresholding based on a K-Means classification of the image histogram, then extracts objects in a bottom-up manner using user-defined minimum and maximum object sizes. Very useful to detect clustered objects in fluorescence microscopy.

need a thumbnail
Description

Plots an intensity profile of a given ROI.

Can plot mean over T or/and Z too.

has topic
has function
need a thumbnail
Description

The SSIM is an index measuring the structural similarity between two images. It is valued between -1 and 1. When two images are nearly identical, their SSIM is close to 1.

need a thumbnail
Description

The aim of this plugin is to characterise the orientation and isotropy properties of a region of interest (ROI) in an image, based on the evaluation of the gradient structure tensor in a local neighborhood. 

has topic
Description

When opening the Pannoramic Viewer you see all of your virtual slides in thumbnail view. Selecting one (or up to 10 at a time) the slide gets under the virtual objective of the virtual microscope. Here you can move and change the magnification of the slide quickly and easily using the mouse. Emphasizing 'quickly' is important considering the fact that the size of an average virtual slide can easily be more than 1 GB.


Main characteristics:

  • Seamless zooming and moving of the virtual slide
  • Bookmarking (annotating) on the spot, i.e. defining the specific part of the sample by drawing; finding and reading of previously made bookmarks
  • Easy and precise measurements
  • Real-time changing of brightness, contrast and color bias
  • Fluorescent slide handling, separate channel view & pseudo-colorization
  • Slide uploading and downloading for teleconsultation
  • Synchronized viewing (moving and zooming) of multiple slides for comparison purposes
  • Publication quality image capture of displayed areas (.JPG, .BMP, .TIFF)
  • TIFF, MIRAX slide and Meta-XML export for Carl Zeiss AxioVision™ compatibility
  • Scanmap export for rescanning existing digital slides
  • Easily expandable functionality via the software modules
Description

A fork of PIL python package, with small collection of image import/export and image processing modules. See [Reference Documentation](http://pillow.readthedocs.org/en/latest/reference/index.html) for more details. Though this package mostly works in any platform, some of them are limited to Windows. This package is a part of [pythonxy](https://code.google.com/p/pythonxy/).

need a thumbnail
Description

DensitoQuant is a simple and fast, yet effective tool for IHC measurements. It measures the density of immunostain on the digital slides by distributing pixels to negative and 3 grades of positive classes by their RGB values. DensitoQuant is especially suitable for quick TMA evaluation. Analyzing a whole digital slide takes only a couple of minutes.

Description

This plugin provides some useful functions to work with complex-valued sequences.

It provides the base operation to deal with complex-valued sequences, such as real-part, imaginary-part, modulus and argument extraction, and conversion between Cartesian and polar representation.

has function
need a thumbnail
Description

A toolbox to chain image analysis processes.

has function
need a thumbnail