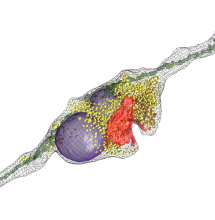
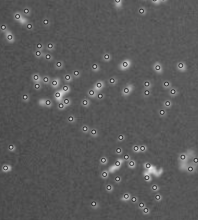
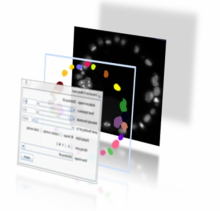
plugin

Description

SIMPLETRACKER a simple particle tracking algorithm that can deal with gaps.

Tracking , or particle linking, consist in re-building the trajectories of one or several particles as they move along time. Their position is reported at each frame, but their identity is yet unknown: we do not know what particle in one frame corresponding to a particle in the previous frame. Tracking algorithms aim at providing a solution for this problem. 

simpletracker.m is - as the name says - a simple implementation of a tracking algorithm, that can deal with gaps. A gap happens when one particle that was detected in one frame is not detected in the subsequent one. If not dealt with, this generates a track break, or a gap, in the frame where the particle disappear, and a false new track in the frame where it re-appear. 

need a thumbnail
Description

Mean square displacement (MSD) analysis is a technique commonly used in colloidal studies and biophysics to determine what is the mode of displacement of particles followed over time. In particular, it can help determine whether the particle is:

  • freely diffusing;
  • transported;
  • bound and limited in its movement.

On top of this, it can also derive an estimate of the parameters of the movement, such as the diffusion coefficient.

@msdanalyzer is a MATLAB per-value class that helps performing this kind of analysis. The user provides several trajectories he measured, and the class can derive meaningful quantities for the determination of the movement modality, assuming that all particles follow the same movement model and sample the same environment.

has function
Examples of tracks to perform MSD analysis.
Description

R wrapper around the OMERO Java Gateway, to enable access to OMERO via R using rJava

has function
need a thumbnail
Description

ScientiFig is a free tool to help you create, format or reformat scientific figures. It comes either as a stand alonesoftware, either as a Fiji/IJ plugin.

has topic
has function
scientifig
Description

This one example workflow from the Cell Profiler(CP)  Examples . CP is commonly used to count cells or other objects as well as percent-positives, by measuring the per-cell staining intensity. This pipeline shows how to do both of these tasks, and demonstrates how various modules may be used to accomplish the same result. 

In a few words, it used the IdentifyPrimaryObject module of CellProfiler to detect nuclei from a channel (e.g DAPI), then again the same module on another channel to detect another probe (e.g some particular histone)  .

Then objects (nuclei) are related to the second object (Histone), to create a parent child-relation ship: where nuclei can have histone has child. Nuclei are then filtered according to the property of having histone (positive) or not having histone (negtiveobject) related to them.  If needed, nuclei can be expanded in order to include touching object rather than object inside only.

The percentage of positive nuclei vs total number of nuclei can then be computed using the CalculateMath Module.

Positivepercentcell
Description

This workflow can be ran with data from 3D-SIM showing the centrosomes in order to compare the distribution of diameters of rings (or toroids) of different proteins from the centrioles or the peri centriolar material. It aims to reproduce the results of the Nature Cell Biology Paper Subdiffraction imaging of centrosomes reveals higher-order organizational features of pericentriolar material  from the same data set but with a different analysis method.

It is slightly different from the methods described in the paper itself, where the method was to work on a maximum intensity projection of a 3D-SIM stack, and then to fit circle to the centrioles to estimate the diameters of the toroids.

In this workflow, the images are read from the IDR , then process by thresholding (Maximum entropy auto thresholding with Image J), and processed by Analyze Particles  with different measurement sets, including the bouding box. Then the analysis of diameters and the statistical test are performed using R. All the code and data sets are available, and in the case of this paper have shown a layered organisation of the proteins.

Combined view from Figure 1 Lawo et al.
Description

A collection of components for super resolution image data:

  • Detect Molecules
  • Reconstruct Image
  • Results table
  • Drift correction
  • Chromatic correction
Description

This component can be used to find moving foreground features, which can be a powerful way to suppress false background detections in subsequent tracking steps.

set time window, and standard deviations above background for foreground time window should be more than 2x larger than time taken for a feature to traverse a pixel (NB. total window is 2x half-width +1) moving foreground identified by intensity increase relative to background average (i.e. median) for a pixel over a given time window "soft" segmentation, yielding foreground probability related to excess intensity (in standard deviations) over background level crude Anscombe transform applied to data to stabilize the variance

need a thumbnail
Description

This is a plugin bundled with native ImageJ.

See IJ reference for more details > Link

need a thumbnail