Description
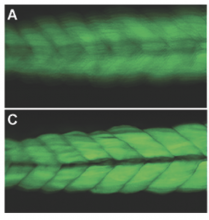
Variational algorithms to remove stationary noise. Application to microscopy imaging. This plugin allows to denoise images degraded with stationary noise. Stationary noise can be seen as a generalization of the standard white noise. Typical applications of this plugin are:
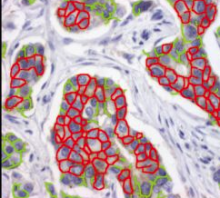
- Standard white noise denoising using a total variation and fidelity term minimization. Even though total variation denoising is not the state of the art (regarding SNR improvement), it may be very valuable for further tasks such as image seg- mentation).
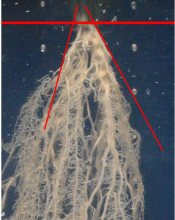
- Destriping (the problem that motivated us to develop these ideas).
- Deconvolution (even though most users won't be able to use this feature).
- Cartoon + texture decomposition which might be useful to compress images, analyse textures or simplify segmentation like tasks.