Image registration

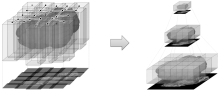
Image registration is the process of transforming different sets of data into one coordinate system. Registration is necessary in order to be able to compare or integrate the data obtained from different sensors/imaging modalities, at different times, from different view points, etc. . Registration can be based on correspondence established between the landmarks or feature points. Alternatively, some similarity/distance metric is established between the image intensity maps to navigate the registration process.

Synonyms
Image alignment
Description

Working version of a simple GUI frontend for CMTK image registration tools in Fiji

need a thumbnail
Description

The MIPAV (Medical Image Processing, Analysis, and Visualization) application enables quantitative analysis and visualization of medical images of numerous modalities such as PET, MRI, CT, or microscopy. Using MIPAV's standard user-interface and analysis tools, researchers at remote sites (via the internet) can easily share research data and analyses, thereby enhancing their ability to research, diagnose, monitor, and treat medical disorders.

Description

ANTs computes high-dimensional mappings to capture the statistics of brain structure and function.

Image Registration

Diffeomorphisms: SyN, Independent Evaluation: Klein, Murphy, Template Construction (2004)(2010), Similarity Metrics, Multivariate registration, Multiple modality analysis and statistical bias

Image Segmentation

Atropos Multivar-EM Segmentation (link), Multi-atlas methods (link) and JLF, Bias Correction (link), DiReCT cortical thickness (link), DiReCT in chimpanzees


Advanced Normalization Tools
Description

A software toolkit for computational morphometry of biomedical images, CMTK comprises a set of command line tools and a back-end general-purpose library for processing and I/O.

The command line tools primarily provide the following functionality: registration (affine and nonrigid; single and multi-channel; pairwise and groupwise), image correction (MR bias field estimation; interleaved image artifact correction; EPI unwarping), processing (filters; combination of segmentations via voting and STAPLE; shape-based averaging), statistics (t-tests; general linear model).

null
Description

TeraStitcher is a free tool that enables the stitching of Teravoxel-sized tiled microscopy images even on workstations with relatively limited resources of memory (<8 GB) and processing power. It exploits the knowledge of approximate tile positions and uses ad-hoc strategies and algorithms designed for such very large datasets. The produced images can be saved into a multiresolution representation to be efficiently visualized (e.g. Vaa3D-TeraFly) and processed.

Description

SliceMap

Whole brain tissue slices are commonly used in neurobiological research for analyzing pathological features in an anatomically defined manner. However, since many pathologies are expressed in specific regions of the brain, it is necessary to have an annotation of the regions in the brain slices. Such an annotation can be done by manual delineation, as done most often, or by an automated region annotation tool.

SliceMap is a FIJI/ImageJ plugin for automated brain region annotation of fluorescent brain slices. The plugin uses a reference library of pre-annotated brain slices (the brain region templates) to annotate brain regions of unknown samples. To perform the region annotation, SliceMap registers the reference slices to the sample slice (using elastic registration plugin BUnwarpJ) and uses the resulting image transformations to morph the template regions towards the anatomical brain regions of the sample. The resulting brain regions are saved as FIJI/ImageJ ROI’s (Regions Of Interest) as a single zip-file for each sample slice.

More information can also be found in "SliceMap: an algorithm for automated brain region annotation", Michaël Barbier, Astrid Bottelbergs, Rony Nuydens, Andreas Ebneth, Winnok H De Vos, Bioinformatics, btx658, https://doi.org/10.1093/bioinformatics/btx658

Example: SliceMaps brain region segmentation
Description

The Multiview Reconstruction software package enables users to register, fuse, deconvolve and view multiview microscopy images. The software is designed for lightsheet fluorescence microscopy (LSFM), but is applicable to any form of three or higher dimensional imaging modalities like confocal timeseries or multicolor stacks. 

need a thumbnail
Description

The BigDataViewer is a re-slicing browser for terabyte-sized multi-view image sequences. BigDataViewer was developed with multi-view light-sheet microscopy data in mind and integrates well with Fiji's SPIMage processing pipeline.

Description

Bigwarp is a tool for manual, interactive, landmark-based deformable image alignment. It uses the BigDataViewer for visualization and navigation, and uses a Thin Plate Spline implemented in Java to build a deformation from point correspondences.

Bigwarp screenshot
Description

The BigStitcher is a software package that allows simple and efficient alignment of multi-tile and multi-angle image datasets, for example acquired by lightsheet, widefield or confocal microscopes. The software supports images of almost arbitrary size ranging from very small images up to volumes in the range of many terabytes, which are for example produced when acquiring cleared tissue samples with lightsheet microscopy.

Description

Vaa3D is a handy, fast, and versatile 3D/4D/5D Image Visualization and Analysis System for Bioimages and Surface Objects. It also provides many unique functions that you may not find in other software. It is Open Source, and supports a very simple and powerful plugin interface and thus can be extended and enhanced easily.

Vaa3D is cross-platform (Mac, Linux, and Windows). This software suite is powerful for visualizing large- or massive-scale (giga-voxels and even tera-voxels) 3D image stacks and various surface data. Vaa3D is also a container of powerful modules for 3D image analysis (cell segmentation, neuron tracing, brain registration, annotation, quantitative measurement and statistics, etc) and data management. This makes Vaa3D suitable for various bioimage informatics applications, and a nice platform to develop new 3D image analysis algorithms for high-throughput processing. In short, Vaa3D streamlines the workflow of visualization-assisted analysis.

Vaa3D can render 5D (spatial-temporal) data directly in 3D volume-rendering mode; it supports convenient and interactive local and global 3D views at different scales... it comes with a number of plugins and toolboxes. Importantly, you can now write your own plugins to take advantage of the Vaa3D platform, possibly within minutes!


Vaa3D_logo
Description

This is an example workflow of how to perform automatic registration by

- first detecting spots in both images using wavelet segmentation (with different scale according to the image scale)

- second using Ec-Clem autofinder to register both images

Click on a block to know more about a tool. Non referenced tools are non clickable.

testWorkflowtestWorkflowtestWorkflowimage map example
Workflow results
Description

quote:

Elastix cite{Klein2010} is an open source, command-line program for intensity-based registration of medical images that allows the user to quickly configure, test, and compare different registration methods. SimpleElastix is an extension of SimpleITK cite{Lowekamp2013} that allows you to configure and run Elastix entirely in Python, Java, R, Octave, Ruby, Lua, Tcl and C# on Linux, Mac and Windows. The goal is to bring robust registration algorithms to a wider audience and make it easier to use elastix, e.g. for Java-based enterprise applications or rapid Python prototyping.

Python example

import SimpleITK as sitk
resultImage = sitk.Elastix(sitk.ReadImage("fixedImage.nii"), sitk.ReadImage("movingImage.nii"))
has topic
Description

Automatic registration in 2D or 3D based on detection or binary mask. Takes images with detections already done on it.

logo autofinder
Description

This plugin allows to compute a similarity (translation/rotation/scaling and flipping) transform from pair of points. It is updating the transformed image interactively such that the user get immediate feedback. The transformation is saved and can be applied to any other stack/image. Non rigid deformation can also be applied in 2D or 3D.

3D/3D,2D/3D or 3D /2D can be handled .

3D ROI are enabled, and can be checked with the 3D vtk view (size of ROI can be changed using the ROI stroke width).

Some prealignment by rotating in 3D the volume is possible.

Transformations can be applied directly or combined through Block Protocols (search for apply transformation).

It's also provide information about the predicted Error (based on statistical prediction), either as a full color mapping, either on each points used as landmarks, and error on the discrepancy in position between points.

There are video tutorials available in the web.


logo ec-clem
Description

The Virtual Brain Explorer (ViBE-Z) is a software that automatically maps gene expression data with cellular resolution to a 3D standard larval zebrafish (Danio rerio) brain. It automatically detects 14 predefined anatomical landmarks for aligning data. It also offers a database and atlas. The ViBE-Z database, atlas and software are provided via a web interface. A data preparation step is needed in order to provide the right input data and format.

need a thumbnail
Description

The MorphoLeaf application allows you to extract the contour of multiple leaf images and identify their biologically-relevant landmarks. These landmarks are then used to quantify morphological parameters of individual leaves and to reconstruct average leaf shapes. MorphoLeaf is developed by the Modeling and Digital Imaging and the Transcription Factors and Architecture teams of the Institut Jean-Pierre Bourgin, INRA Versailles, France, and the Biophyscis and Development group at RDP, Lyon.

Description

Free-D (http://free-d.versailles.inra.fr/) is a 3D reconstruction and modeling software. It is multiplatform, free (but not open source) tool for academic research and teaching.

Here is how to proceed, using Free-D:

1. Segmentation:

* load (a collection of) individual 3d stacks

* (optional for serial sections) perform a 2D registration to align image slices

* segment/reconstruct 3D contours using snakes

* segment 3D spots

2. Construct average cell:

* normalize the contours to compute a average cell, by registering/warping 3D contours/surfaces

3. Quantification:

* project each individual cell to the average one

* build density maps to analyze (cartography)

A few notes for current software version (till 10/2016):

* input file format: tiff (not able to import bioformats)

* currently results are saved in customized format, but there is an exportor to convert this format into fiji readable one

* import already generated contours is on the software's TODO list

need a thumbnail
Description

This ImageJ plugin aligns the slices of a stack just like the stackreg plugin on which it is built. It allows to save the transformations and to apply them to another stack. It furthermore allows to register two stacks.

need a thumbnail
Description

Rigid registration of time series in 3D. A video tutorial is available (be careful of sounds, the video automatically starts!): [Sample Drift Correction Following 4D Confocal Time-lapse Imaging](http://www.jove.com/video/51086/sample-drift-correction-following-4d-co…)

has function
Description

A Jython script using the plugin : Register Virtual Stack Slices It takes a sequence of image slices stored in a folder, and delivers a list of registered image slices (with enlarged canvas). One of the images in the sequence can be selected by the user as reference and it will remain intact. The plugin can perform 6 types of image registration techniques: - Translation - Rigid (translation + rotation) - Similarity (translation + rotation + isotropic scaling) - Affine - Elastic (via bUnwarpJ with cubic B-splines) - Moving least squares All models are aided by automatically extracted SIFT features.

has function
need a thumbnail
Description

Amira is 3D visualization and analysis software for life sciences.
 

" Amira software is a powerful, multifaceted 3D platform for visualizing, manipulating, and understanding life sciences data from computed tomography, microscopy, MRI, and many other imaging modalities. 
With incredible speed and flexibility, Amira software enables advanced 3D imaging workflows for specialists in research areas ranging from molecular and cellular biology to neuroscience and bioengineering. "

has topic
Amira's interface
Description

An ImageJ macro for correcting frame drift occurred during image acquisition.

It often happens that you have an image sequence that shows problematic drifting of image frame and at the same time you have some landmarks that could be used for correcting the drift. This ImageJ macro allows you to Manually track the landmark using ImageJ Manual Tracking Plugin. Using the coordinates recorded in the Result window, each frame is shifted back so that the landmark stays in a single place.

ITK

Description

ITK is an open-source, cross-platform system that provides developers with an extensive suite of software tools for image analysis.

Developed through extreme programming methodologies, ITK employs leading-edge algorithms for registering and segmenting multidimensional data. It is widely used and contributed in the medical imaging field.

Strengths

Highly optimized C++, well commented Consistently updated (new) algorithms many tools and softwares are built upon it connected with VTK Insight Journal (open code and sample data) Extensive list of examples & tutorials

Limitations

yet detached from the bioimage analysis world hard to use for end users without development skills

itk
Description

Imaris is a software for data visualization, analysis, segmentation and interpretation of 3D and 4D microscopy images. It performs interactive volume rendering that lets users freely navigate even very large datasets (hundreds of GB). It performs both manual and automated detection and tracking of biological “objects” such as cells, nuclei, vesicles, neurons, and many more. ImarisSpots for example is a tool to detect “spherical objects” and track them in time series. Besides the automated detection it gives the user the ability to manually delete and place new spots in 3D space. ImarisCell is a tool to detect nuclei, cell boundaries and vesicles and track these through time. ImarisFilament is a module that lets users trace neurons and detect spines. For any detected object Imaris computes a large set of statistics values such as volume, surface area, maximum intensity of first channel, number of vesicles per cell etc. These values can be exported to Excel and statistics software packages. The measurements can also be analyzed directly within ImarisVantage which is a statistics tool that provides the link back to the 3D objects and the original image data. Strengths: - good visualization - user friendly interface - reads most microscopy file formats - image analysis workflows are very easy to apply - interactive editing of objects to correct errors during automatic detection - large data visualization (hundreds of GB)

has topic
null