Mathematical morphology with morphoLibJ
- Introduction to Mathematical Morphology
- Morphological filtering of greyscale images
- Segmentation, e.g. focused on Watershed
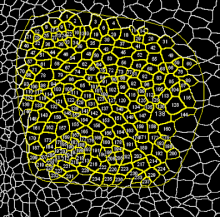
- Image quantification (analysis of regions, texture analysis)
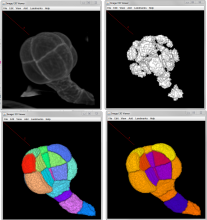
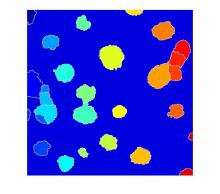
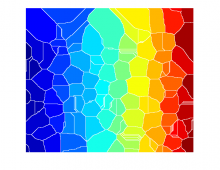
Watershed is the term that commonly refers to a mathematical morphology operation that treats a grayscale image as a topographic map and segments the image. The segmentation is performed by a succesive 'flooding' operation from minima in the image starting from different points and separates the image in different catchment basins.|Needs a comment about the relation between the Watershed and Region growing.
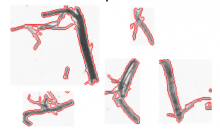
In this tutorial video, a coronary arterial tree is used as the demo example to show in detail how the semi-automatic segmentation workflow, Carving from the open-source image analysis software ilastik, can be used. Tips on how and why a preprocessing is done, as well as parameter settings are provided.