Visualisation

Re-occurs among biii.info tags (visualisation, rendering, viewer, classification, ...)

Synonyms
Plotting

Viv

Description

Viv is a JavaScript library providing utilities for rendering primary imaging data. Viv supports WebGL-based multi-channel rendering of both pyramidal and non-pyramidal images. The rendering components of Viv are provided as Deck.gl layers, facilitating image composition with existing layers and updating rendering properties within a reactive paradigm.

Rendering a pyramidal, multiplexed immunofluorescence OME-TIFF image of a human kidney using additive blending to render four image channels into a single RGB image in the client.
Description

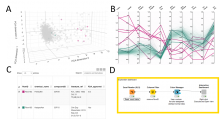
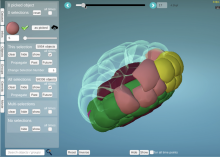
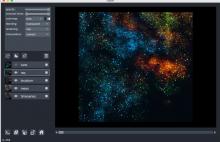
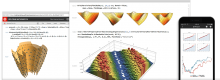
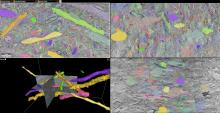
KNIME workflow to visualize a dataset described by multiple quantitative features (ex: a list of samples or cells, each described with multiple morphological features) as a 3D cloud of points (each point corresponding to one sample/cell) as well as a line plot (1 line per sample/cell).

For the 3D plot, the workflow uses Principal Component Analysis (PCA) for dimensionality reduction, ie it simplifies the information for each sample from n-features to 3 pseudo-features which are used as x,y,z-coordinates for each sample. The original features should cover similar value range, to make sure the PCA is not biased towards the large values features. One option is to normalize the values (min/max or Z-score). 

Also make sure that the resulting PCA represents a decent % of the original data variance (at least 70%). Otherwise the PCA plot will not be representative of the original data-distribution. The % is shown in the title of the PCA plot.

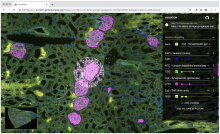
The workflow is interactive and so selecting in one panel of the figure will highlight in the other panel too.

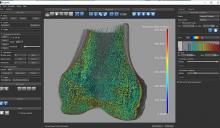
It was originally published for the visualization of phenotypic kidney features in zebrafish, but the workflow is generic by design and can be reused for any quantitative feature set. 

KNIME-Workflow
Description

MoBIE (Multimodal Big Image Data Exploration) is a framework for sharing and interactive browsing of multimodal big image data. The MoBIE Fiji viewer is based on BigDataViewer and enables browsing of MoBIE datasets. 

It is also called Platybrowser, and uses the n5 format.

Mobie
Description

The Morphonet Python API provide an easy interface to interact directly with the MorphoNet server. Very useful to upload, download your dataset and superimpose on it any quantitative and quantitative informations.

Description

MorphoNet is a novel concept of web-based morphodynamic browser to visualise and interact with complex datasets, with applications in research and teaching. 

MorphoNet offers a comprehensive palette of interactions to explore the structure, dynamics and variability of biological shapes and its connection to genetic expressions. 

By handling a broad range of natural or simulated morphological data, it fills a gap which has until now limited the quantitative understanding of morphodynamics and its genetic underpinnings by contributing to the creation of ever-growing morphological atlases.

Description

Summary

napari is a fast, interactive, multi-dimensional image viewer for Python. It’s designed for browsing, annotating, and analyzing large multi-dimensional images. It’s built on top of Qt (for the GUI), vispy (for performant GPU-based rendering), and the scientific Python stack (e.g. numpyscipy). It includes critical viewer features out-of-the-box, such as support for large multi-dimensional data, and layering and annotation. By integrating closely with the Python ecosystem, napari can be easily coupled to leading machine learning and image analysis tools (e.g. scikit-imagescikit-learnTensorFlowPyTorch), enabling more user-friendly automated analysis.

Installation

  • The installation procedure for Silicon Mac (M1 Processor, arm64 ) requires some tricks. As of Oct 2021, this procedure by Peter Sobolewski works but:
    • For installing pyqt5, use a slightly different command `brew install PyQt@5` to install PyQt5.  


Description

Wolfram Mathematica (usually termed Mathematica) is a modern technical computing system spanning most areas of technical computing — including neural networksmachine learningimage processinggeometrydata sciencevisualizations, and others. The system is used in many technical, scientific, engineering, mathematical, and computing fields.

Description

Dragonfly is a software platform for the intuitive inspection of multi-scale multi-modality image data. Its user-friendly experience translates into powerful quantitative findings with high-impact visuals, driven by nuanced easy-to-learn controls.

For segmentation: It provides an engine fior machine Learning, Watershed and superpixel methods, support histological data .

It offers a 3D viewer, and python scripting capacities .

It is free for reserach use, but not for commercial usage.

DragonFly
Description

Web based viewer developped for google for very big data: 

Neuroglancer is a WebGL-based viewer for volumetric data. It is capable of displaying arbitrary (non axis-aligned) cross-sectional views of volumetric data, as well as 3-D meshes and line-segment based models (skeletons). The segmentation has to be done before loading the dataset, it is not done Inside the viewer.

This is not an official Google product.

It has among other the nice feature of beeing able to generate url for sharing a specific view.

Note that the only supported browser for now are 

  • Chrome >= 51
  • Firefox >= 46


Neuroglancer
Description

FPBioimage is a volumetric visualization tool which runs in all modern web browsers. Try the tool yourself at our example site here.

has function