Mac

Description

Oufti (previously named MicrobeTracker) is a MATLAB application / suite of tools for analysing fluorescent spots inside microbes. MicrobeTracker can identify cell outlines and fluorescent foci, and generate plots and statistics based on positions and intensity (kymographs, histograms etc.) The MATLAB code is easy to modify and extend to add additional plots and statistics: see e.g. Lesterlin et al. (2014).

The Outfi Forum is quite active.

Description

Analyzing Ca2+ sparks

ImageJ plugin to detect and measure Ca2+ sparks in linescan images, described in Picht et. al. (2007). The algorithm is based on that described by Cheng et al. (1999). Care should be taken to ensure that detections belong to 'true' events, as without any additional background subtraction steps the algorithm is not appropriate for images in which the baseline fluorescence varies substantially.

Description

This workflow classifies objects based on object-level features (e.g. intensity based, morphology based, etc) and user annotations. It needs segmentation images besides the raw image data. Segmentation images can be obtained from ilastik pixel classification, or binary segmentation images from other tools. Within the object classification, one can prefilter objects through thresholds (on pixel probability image) or object sizes (on segmentation image). Outputs are predicted classification label images. Selected features can also be exported. Advanced users also have possibilities to add customized (object) features for classification in a simple plugin fashion through python scripts.

Description

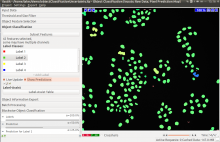
This workflow is used to track multiple (appear/disappear, dividing and merging) objects in presumably big 2D+t or 3D+t datasets. It is best suitable for roundish objects or spots. Tracking is done through segmentation, which can be obtained from ilastik pixel classification, or imported from other tools. Users should provide a few object level labels, and the software predicts results on the rest of the image or new images with similar image characteristics. As a result, all objects get assigned random IDs at the first frame of the image sequence and all descendants in the same track (also children objects such as daughter cells) inherit this ID.

need a thumbnail
Description

The Artemia Tools help to calculate the normalized redness of Artemia in color images.

See: http://dev.mri.cnrs.fr/projects/imagej-macros/wiki/Artemia_Tools

Test images: http://biii.eu/node/1139

Artemia color analysis toolset