Mac

Description

This workflow classifies, or segments, the pixels of an image given user annotations. It is especially suited if the objects of interests are visually (brightness, color, texture) distinct from their surrounding. Users can iteratively select pixel features and provide pixel annotations through a live visualization of selected feature values and current prediction responses. Upon users' satisfaction, the workflow then predicts the remaining unprocessed image(s) regions or new images (as batch processing). Users can export (as images of various formats): selected features, annotations, predicted classification probability, simple segmentation, etc. This workflow is often served as one of the first step options for other workflows offered by ilastik, such as object classification, automatic tracking.

Description

Various ways are proposed in different websites for example:

Here, a workflow template using ImageJ's build-in Find Maxima ( Process -> Find Maxima) is explained. It can be used for many 2D counting-related tasks.

For counting small, bright foci (dots), set Output type to be Point Selection. If too many points are detected, the number may be reduced using one or more of the following methods:

Apply a filter to reduce noise, e.g. Process -> Filters -> Gaussian Blur... prior to running Find Maxima Set a minimum threshold with Image -> Adjust -> Threshold... prior to running Find Maxima, then use the Above lower threshold option within the dialog box Increase the Noise tolerance value (which effectively acts as a local threshold)

The resulting point selection can be modified (points added/removed) by the Multi-Point tool.

After the points are available, final measurements can be made using Analyze -> Measure.

Description
Well maintained and documented project that includes a core tracking incl. GUI as well as Matlab toolboxes to (1) correct tracking results and (2) analyze fly behavior. >
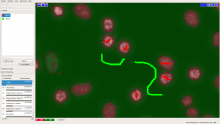
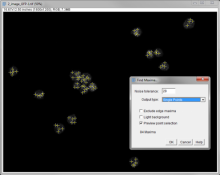
Ctrax is an open-source, freely available, machine vision program for estimating the positions and orientations of many walking flies, maintaining their individual identities over long periods of time. It was designed to allow high-throughput, quantitative analysis of behavior in freely moving flies. Our primary goal in this project is to provide quantitative behavior analysis tools to the neuroethology community, thus we've endeavored to make the system adaptable to other labs' setups. We have assessed the quality of the tracking results for our setup, and found that it can maintain fly identities indefinitely with minimal supervision, and on average for 1.5 fly-hours automatically.
need a thumbnail
Description

Requires Matlab Runtime Environment or Matlab. Source code (m-files) are downloaded. Software availability: AVeMap was developed under MATLAB (MathWorks). It is available as an executable, multiplatform program, together with source codes and documentation here, and the source code is also available as Supplementary Software. For practical reasons, this executable version, which does not require MATLAB, runs on a single processor. For users who want to customize the software and/or need the power of parallel computing, an installation of MATLAB with its 'parallel' and 'image processing' toolboxes is needed. Note that, even with the executable version, the velocity fields are stored for further analysis. The add-on AVeMap+ uses these AVeMap-computed velocity fields to generate heat map tables. It is available with the same link.

need a thumbnail
Description

The Leaf Infection Tools allow to measure the area of leaves, of two stainings in different channels and of the overlap region of the two stainings. 

See: http://dev.mri.cnrs.fr/projects/imagej-macros/wiki/Leaf_Infection_Tools

Test image: http://biii.eu/node/1143

a leaf with infection pattern