Description
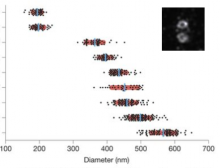
This workflow can be ran with data from 3D-SIM showing the centrosomes in order to compare the distribution of diameters of rings (or toroids) of different proteins from the centrioles or the peri centriolar material. It aims to reproduce the results of the Nature Cell Biology Paper Subdiffraction imaging of centrosomes reveals higher-order organizational features of pericentriolar material from the same data set but with a different analysis method.
It is slightly different from the methods described in the paper itself, where the method was to work on a maximum intensity projection of a 3D-SIM stack, and then to fit circle to the centrioles to estimate the diameters of the toroids.
In this workflow, the images are read from the IDR , then process by thresholding (Maximum entropy auto thresholding with Image J), and processed by Analyze Particles with different measurement sets, including the bouding box. Then the analysis of diameters and the statistical test are performed using R. All the code and data sets are available, and in the case of this paper have shown a layered organisation of the proteins.