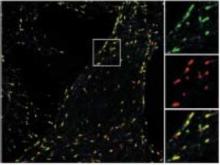
ImageJ Macros

Description


In this workflow, you can use MorphoLibJ to generate accurate morphometric measurements

  • First the fibers are segmented by mathematical morphology:
    • for example by using MorphoLibJ:
      • Create a marker image by creating a rough mask with extended regional maxima (similar to Find Max), such that you have one max per fiber
      • Use the marker controlled watershed (in MorpholLibJ/ Segmentation/ marker controlled watershed) : indicate the original grayscale image as the input, Marker will be your maxima image, select None for mask
      • it will create a label mask of your fibers
  •  In MorphoLibJ /analyze/ select Region Morphometry: this will compute different shape factors which are more robust than the ones implemented by default in ImageJ
  • Export the result table created to a csv file
  • Then for example in Matlab or R, you can apply a PCA analysis (Principal component analysis) followed by a k-means with the number of class (clusters) (different fibers type) you want to separate.
  • You can then add this class as a new feature to your csv file.
  • From this you can sort your labelled fibers into these clusters for a visual feedback or further spatial analysis
has topic
hemp analysis
Description

Quote:

The "Angiogenesis Analyzer" allows analysis of cellular networks. Typically, it can detect and analyze the pseudo vascular organization of endothelial cells cultured in gel medium

...a simple tool to quantify the ETFA (Endothelial Tube Formation Assay) experiment images by extracting characteristic information of the network.

The outputs are network feature parameters.

Sample images

http://image.bio.methods.free.fr/ij/ijmacro/Angiogenesis/HUVEC-Pseudo-Phase-Contrast.tif.zip

http://image.bio.methods.free.fr/ij/ijmacro/Angiogenesis/HUVEC-Fluo.tif.zip

Source code

https://imagej.nih.gov/ij/macros/toolsets/Angiogenesis%20Analyzer.txt

has topic
has function
Description

Evaluates the orientation of fiber orientation pattern and plots the results in the image. It calculates gradient in x and y direction. - then calculates the eigenvector of nematic tensor, which is the orientation of the pattern.

Description

The workflow consists of firstly identifying spot (which can be also gravity center of cells identified by another method), and then secondly compute trajectories by linking these spots by global optimisation with a cost function. This method is part of the methods evaluated in Chanouard et al (2014) as "method 9" and is described in detail in its supplementary PDF (page 65).

Dependencies

Following plugins are required.

  1. JAR to be placed under IJ plugin directory
  2. A pdf file with instructions and output description is also available in the zip .
  3. MTrackJ : Used for visualization of tracks. Preinstalled in Fiji.
  4. Imagescience.jar: This library is used by MTrackJ. Use update site to install this plugin.
  5. jama.jar. Preinstalled in Fiji.

##Advantages:

  • support blinking (with a parameters allowing it or not)
  • fast,
  • can be used in batch, some analysis results provided.
  • No dynamic model.
  • The tracking part is not dependent of ImageJ.

Pitfalls:

  • does not support division
  • the optimization algorithm used is a simulated annealing, so results can be slightly different between two runs.
  • No Dynamic model (so less good results but can be used for a first study of the kind of movements)

##The sample data

The parameters used for this example data Beads, were

  1. detection: 150
  2. the max distance in pixels: 20
  3. max allowed disappearance in frame: 1
Description

The root tools help to efficiently measure the following characteristics of plant roots: the angle of the opening of the whole root the depth to which it goes down the number of roots at multiple depths (for example 30cm, 35cm, ...) the diameters of the roots at multiple depths (for example 30cm, 35cm, ...)

Root tools