Java

Description

This plugin shows the color distribution within a 3D-color-space. Extensive documentation is available atwww.f4.fhtw-berlin.de/~barthel/ImageJ/ColorInspector/help.htm.

Color Inspector 3D is also available as a stand-alone program that uses ImageJ as a library. To run it, download ColorInspector3D.jar and double click on it. On Windows, Java 5.0 or later must be installed

Description

Choose the best auto thresholding technique for your data. 

has function
Description

View a single channel of a 2D image as a 3D elevation map (X,Y,Intensity).

has function
need a thumbnail
Description

This plugin takes a sequence of image slices stored in a folder, and delivers a list of registered image slices (with enlarged canvas). One of the images in the sequence can be selected by the user as reference and it will remain intact.

The plugin can perform 6 types of image registration techniques:

  • Translation
  • Rigid (translation + rotation)
  • Similarity (translation + rotation + isotropic scaling)
  • Affine
  • Elastic (via bUnwarpJ with cubic B-splines)
  • Moving least squares

All models are aided by automatically extracted SIFT features.

Source code

Installation

This plugin is bundled with the Fijij package.

has function
Description

Fill holes in a binary image.

has function
need a thumbnail
Description

Edge detection by Deriche's method.

Description

Shows how to listen active sequence / viewer events.

null
Description

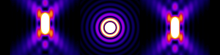
PSF Generator is a software package that allows one to generate and visualize various 3D models of a microscope PSF. The current version has more than fifteen different models.

3D diffractive models: scalar-based diffraction model Born & Wolf, scalar-based diffraction model with 3 layers Gibson & Lanni, and vectorial-based model Richards & Wolf, and Variable Refractive Index Gibson & Lanni model.

Defocussing a 2D lateral function with 1D axial function: the available lateral functions are: "Gaussian", "Lorentz", "Cardinale-Sine", "Cosine", "Circular-Pupil", "Astigmatism", "Oriented-Gaussian", "Double-Helix".

Optical Transfer Function generated in the Fourier domain: Koehler simulation, defocus simulation.

has topic
Description

This tutorial explain how to use a deviation renderer JFreeChart chart in Icy.

Description

Simple chronometer for Icy.

null
Description

This plugin is bundled with Fiji. For installation in ImageJ1, download from the link below and manually install the class file. 

Quote:

The colour deconvolution plugin (java and class files) for ImageJ and Fiji implements stain separation using Ruifrok and Johnston's method described in [1]. The code is based on a NIH Image macro kindly provided by A.C. Ruifrok.
The plugin assumes images generated by colour subtraction (i.e. light-absorbing dyes such as those used in bright field histology or ink on printed paper). However, the dyes should not be neutral grey (most histological stains are not so).
If you intend to work with this plugin, it is important to read the original paper to understand how new vectors are determined and how the procedure works.
The plugin works correctly when the background is neutral (white to grey), so background subtraction with colour correction must be applied to the images before processing.
The plugin provides a number of "built in" stain vectors some of which were determined experimentally in our lab (marked in the source with GL), but you should determine your own vectors to achieve an accurate stain separation, depending on the stains and methods you use. See the note below.
The built-in vectors are :

  • Haematoxylin and Eosin (H&E) x2
  • Haematoxylin and DAB (H DAB)
  • Feulgen Light Green
  • Giemsa
  • Fast Red, Fast Blue and DAB
  • Methyl green and DAB
  • Haematoxylin, Eosin and DAB (H&E DAB)
  • Haematoxylin and AEC (H AEC)
  • Azan-Mallory
  • Masson Trichrome
  • Alcian blue & Haematoxylin
  • Haematoxylin and Periodic Acid - Schiff (PAS)
  • RGB subtractive
  • CMY subtractive
  • User values entered by hand
  • Values interactively determined from rectangular ROIs
has function
Description

TrackMate provides the tools to perform single particle tracking (SPT). SPT is an image analysis challenge where the goal is to segment and follow over time some labeled, spot-like structures. Each spot is segmented in multiple frames and its trajectory is reconstructed by assigning it an identity over these frames, in the shape of a track. These tracks can then be either visualized or yield further analysis results such as velocity, total displacement, diffusion characteristics, division events, etc...

Description

Draws a contour plot on top of a sequence.

has function
need a thumbnail
Description

The Trainable Weka Segmentation is a Fiji plugin that combines a collection of machine learning algorithms with a set of selected image features to produce pixel-based segmentations. Weka (Waikato Environment for Knowledge Analysis) can itself be called from the plugin. It contains a collection of visualization tools and algorithms for data analysis and predictive modeling, together with graphical user interfaces for easy access to this functionality. As described on their wikipedia site, the advantages of Weka include: - freely availability under the GNU General Public License - portability, since it is fully implemented in the Java programming language and thus runs on almost any modern computing platform - a comprehensive collection of data preprocessing and modeling techniques - ease of use due to its graphical user interfaces - Weka supports several standard data mining tasks, more specifically, data preprocessing, clustering, classification, regression, visualization, and feature selection.

The main goal of this plugin is to work as a bridge between the Machine Learning and the Image Processing fields. It provides the framework to use and, more important, compare any available classifier to perform image segmentation based on pixel classification.

has topic
Description

This plugin (Icy Tool) allows the user to create and edit annotations. Annotations are blocks of text that the user can put anywhere in the sequence. Run the plugin to get the GUI with all the features. Once a note is added to a sequence, left click on it to edit this one. If you closed your GUI and you have some notes on your sequence, right click and select "edit" to display the GUI.

As of now, the annotations are saved when the sequence is closed, but you have to run the plugin at least once to be able to see all the annotations in the image.

has function
need a thumbnail
Description

The plugin performs stitching of images of a tiled scan to reconstruct the image of the whole sample.

has topic
Description

KNIME is a user-friendly graphical workbench for the entire analysis process: data access, data transformation, initial investigation, powerful predictive analytics, visualisation and reporting. Its an open integration platform and provides over 1000 modules (nodes), including those of the KNIME community and its extensive partner network. One of these extensions adds the ability for image analysis allowing to process, segment and further analyze images which can easily be used in combination with the other extensions, potentially from other fields.

Knime