Image analysis

Synonyms
General image analysis
Description

ClearMap is a toolbox for the analysis and registration of volumetric data from cleared tissues.

It was initially developed to map brain activity at cellular resolution in whole mouse brains using immediate early gene expression. It has since then been extended as a tool for the qunatification of whole mouse brain vascualtur networks at capilary resolution.

It is composed of sevral specialized modules or scripts: tubemap, cellmap, WobblyStitcher.

ClearMap has been designed to analyze O(TB) 3d datasets obtained via light sheet microscopy from iDISCO+ cleared tissue samples immunolabeled for proteins. The ClearMap tools may also be useful for data obtained with other types of microscopes, types of markers, clearing techniques, as well as other species, organs, or samples.

ClearMap SCreenshot
Description

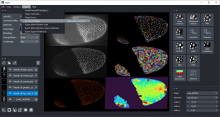
The napari-pyclesperanto-assistant is a yet experimental napari plugin for building GPU-accelerated image processing workflows targeting life-sciences and bio-image analysis. It is part of the clEsperanto project. It uses pyclesperanto and pyopencl as backend for processing images.

has function
Description

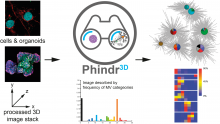
Phindr3D is a comprehensive shallow-learning framework for automated quantitative phenotyping of three-dimensional (3D) high content screening image data using unsupervised data-driven voxel-based feature learning, which enables computationally facile classification, clustering and data visualization.

Please see our GitHub page and the original publication for details.

Description

This tool allows to analyze morphological characteristics of complex roots. While for young roots the root system architecture can be analyzed automatically, this is often not possible for more developed roots. The tool is inspired by the Sholl analysis used in neuronal studies. The tool creates a binary mask and the Euclidean Distance Transform from the input image. It then allows to draw concentric circles around a base point and to extract measures on or within the circles. Instead of circles, which present the distance from the base point, horizontal lines can be used, which present the distance in the soil from the base-line. The following features are currently implemented:

  • The area of the root per distance/depth.
  • The number of border pixel per distance/depth, giving an idea of the surface in contact with the soil.
  • The maximum radius per distance/depth of a root, measured at the crossing points with the circles or lines.
  • The number of crossings of roots with the circles or lines.
  • The maximum distance to the left and the right from the vertical axis at crossing points with the circles or lines.
Concentric circles on the mask of a root, created by the Analyze Complex Roots Tool
Description

Quote:

LaRoME = Label + Region Of Interest + Measure

Label image (aka Count Masks): An image in which pixels of an object have all the same value. Each object has a unique value.

Measurement image: An image in which pixels of an object have all the same value, corresponding to a measurement (Area, Angle, Mean...)

has function