ImageJ Macros

Description

The macro segments and classifies human spermatozoids nuclei (DAPI) based on the number of FISH signals (spots) they contain. It reports the percentage of occurrences of user defined classes (combinations of spot multiplicity in the FISH channels) as well as the position (point selections) of the detected nuclei falling in these classes. The input image should be an hyperstack with 4 channels: DAPI (first channel) and three FISH channels. The images are typically obtained as a maximum intensity projection of few channels (confocal) or a single z slice acquisition (widefield).

Example image available in the linked page. 

has function
Description

This macro and plugins suite for ImageJ (and Fiji) serves to measure the velocity of moving structures and visualize them, from image time series (2D over time).

The module can be installed in ImageJ as a Macro Menu and each function/component can be called separately. The full workflow consists in calling some, or all, the functions sequentially in order to get from the image preparation (e.g. filtering and visualization of tracks) to the production of the kymographs (time vs. distance plot) and their analysis (retrieving the velocities).

Here is the full workflow sequence:

  • Load image sequence
  • Crop and time-filter the image sequence ("Walking average" plugin)
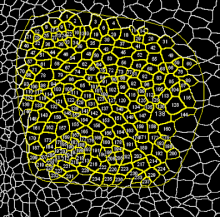
  • Generate tracks by z-projection ("Stack difference" plugin)
  • Select tracks and restore them in the original stack.
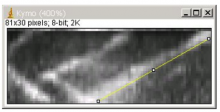
  • execute plugin "multiple kymograph"
  • Analyse: select edges of moving tracks graphically and quantify movement in a table.

input: 8-bit, 16-bit stacks, 2D in time. Calibrated is better for meaningful velocity measurements.

ouput: the kymograph image, the velocity measurements tables.

Requires ImageJ version: 1.33.n minimum.

Example of applications:

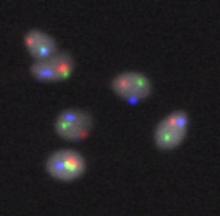
  • velocity of moving objects/ structures with sharp edges, incl. the velocity of microtubules (and their plus ends),
  • the velocity of vesicles or particles along a 2D path
  • the velocity of migration of the edge of a cell or a multicellular group
  • retraction velocity of contractile bundles (e.g. actin fibers) or multicellular tissues after mechanical disruption (e.g. laser surgery)
Description

This macro is meant to segment the cells of a multicellular tissue. It is written for images showing highly contrasted and uniformly stained cell membranes. The geometry of the cells and their organization is automatically extracted and exported to an ImageJ results table. This includes: Cell area, major, minor fitted ellipse radii + major axis orientation and number of neighbors of the cells. Manual correction of the automatic segmentation is supported (merge split cells, split merged cells).

Sample image data is available in the documentation page. 

Description

This macro was designed to measure the size of the scratch wound in a wound scratch assay. It uses an edge-detection and thresholding technique.

It will batch process all images in a directory. Images captured by time-lapse should be compiled into stacks using a tool similar to "Metamorph nd & ROI files importer (nd stack builder)" by Fabrice P. Cordelières. Images to be analyzed should be placed in one directory (Source Directory). A second directory should be created to save results files and images (Destination Directory). Setting correct Lower and Upper thresholds is important to obtain a good result. Two macros are available, one using edge detection, the second one using background subtraction.

Description

A workflow combining ImageJ macro and manually using Trainable Weka Segmentation plugin for counting clumped cells.

Description

An ImageJ macro for calculating empty surfaces on histological slices (ex: tubules in a kidney).

has topic
Description

Particle detection is based on "Analyze Particles" in ImageJ. It probably could also be used in spot detection, not limited to centromere. >This macro is described in Bodor et al. (2012). The macro recognizes centromere or kinetochore foci in Delta Vision or TIFF images and determines their centroid position. Fluorescent intensities are then measured for each centromere by placing a small box around the centroid position of the centromere. The peak intensity value within the box is corrected for local background by subtraction of the minimum pixel value. This process results in an accurate measurement of large numbers of centromere or kinetochore-specific signals. Following papers uses CRaQ (picked up, maybe more): - Fachinetti et al. (2017), Developmental Cell 40, 104–113, - Guo et al. (2017) Nature Communications volume 8, Article number: 15775 (2017) doi:10.1038/ncomms15775 - Lgosdon et. al. (2015) J Cell Biol Mar 2015, 208 (5) 521-531; DOI: 10.1083/jcb.201412011 - Bodor et al. (2014), eLife. 2014; 3: e02137

has function
Description

The Arabidopsis Seedlings Tool allows to analyze the germination and seedling growth of Arabidopsis (Arabidopsis thaliana) in liquid culture. It measures the surface of green pixels per well in images containing multiple wells. It can be run in batch mode on a series of images. It writes a spreadsheet file with the measured area per well and saves a control image showing the green surface that has been detected per well. 

See http://dev.mri.cnrs.fr/projects/imagej-macros/wiki/Arabidopsis_Seedlings_Tool

Test images can be found here.

has function
ImageJ toolbar of the arabidopsis seedlings tool
Description
has function