2D

Description

JFilament is an ImageJ plugin for segmentation and tracking of 2D and 3D filaments in fluorescenece microscopy images. The main algorithm used in Jfilament is "Stretching Open Active Contours" (SOAC). In order to use this method, the user must define seed points in the image where the SOAC method will begin.

JFilament also includes 2D "closed" active contours which can be used for tasks such as segmentation and tracking of cell boundaries.


JFilament_ImageJ_pulgin_Window
Description

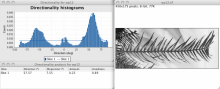
This plugin is used to infer the preferred orientation of structures present in the input image. It computes a histogram indicating the amount of structures in a given direction. Images with completely isotropic content are expected to give a flat histogram, whereas images in which there is a preferred orientation are expected to give a histogram with a peak at that orientation. On top of the histogram, the plugin tries to generate statistics on the highest peak found.

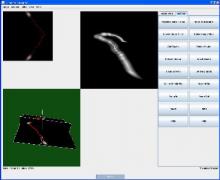
The plugin offers the possibility to generate an orientation map, where the image is colored according to its local directionality, or location orientation. 

The plugin is part of Fiji, can be launched through the menu: Analyze > Directionality

orientation histogram
Description

EBImage provides general purpose functionality for image processing and analysis. In the context of (high-throughput) microscopy-based cellular assays, EBImage offers tools to segment cells and extract quantitative cellular descriptors. This allows the automation of such tasks using the R programming language and facilitates the use of other tools in the R environment for signal processing, statistical modeling, machine learning and visualization with image data.

EBImage is available through the Bioconductor software project (www.bioconductor.org). Strengths Lightweight Suitable for automated, scripted analyses All functions are documented with examples Modular links to R and Bioconductor software, notably imageHTS and cellHTS2 Community support via the Bioconductor mailing list Reproducible (image) analysis using the Sweave report-writing system

EBImage
Description

The ultimate goal of the NET framework is to make images of networks processable by computers. Therefore we want to have a pixel based image as input, as output we want a representation of the network visible in the image that retains as much information about the original network as possible. NET achives this by first segmenting the image and then vectorizing the network and then extracting information. The information we extract is

  • First and foremost the graph of the network. We find the crossings (nodes) and connections between crossings (edges) and therefore extract information about the neighborhood relations, the topology of the network.
  • We also extract the coordinates of all nodes which enables us to embed them into space. We therefore extract information about the geometry of the network.
  • Last but not least we track the radii of the edges in the extraction process. Therefore every edge has a radius which can be identified with its conductivity.

In the following we will first provide detailed instructions on how to install NET on several platforms. Then we describe the functionality and options of each of the four scripts that make up the NET framework.

has topic
need a thumbnail