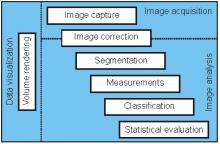
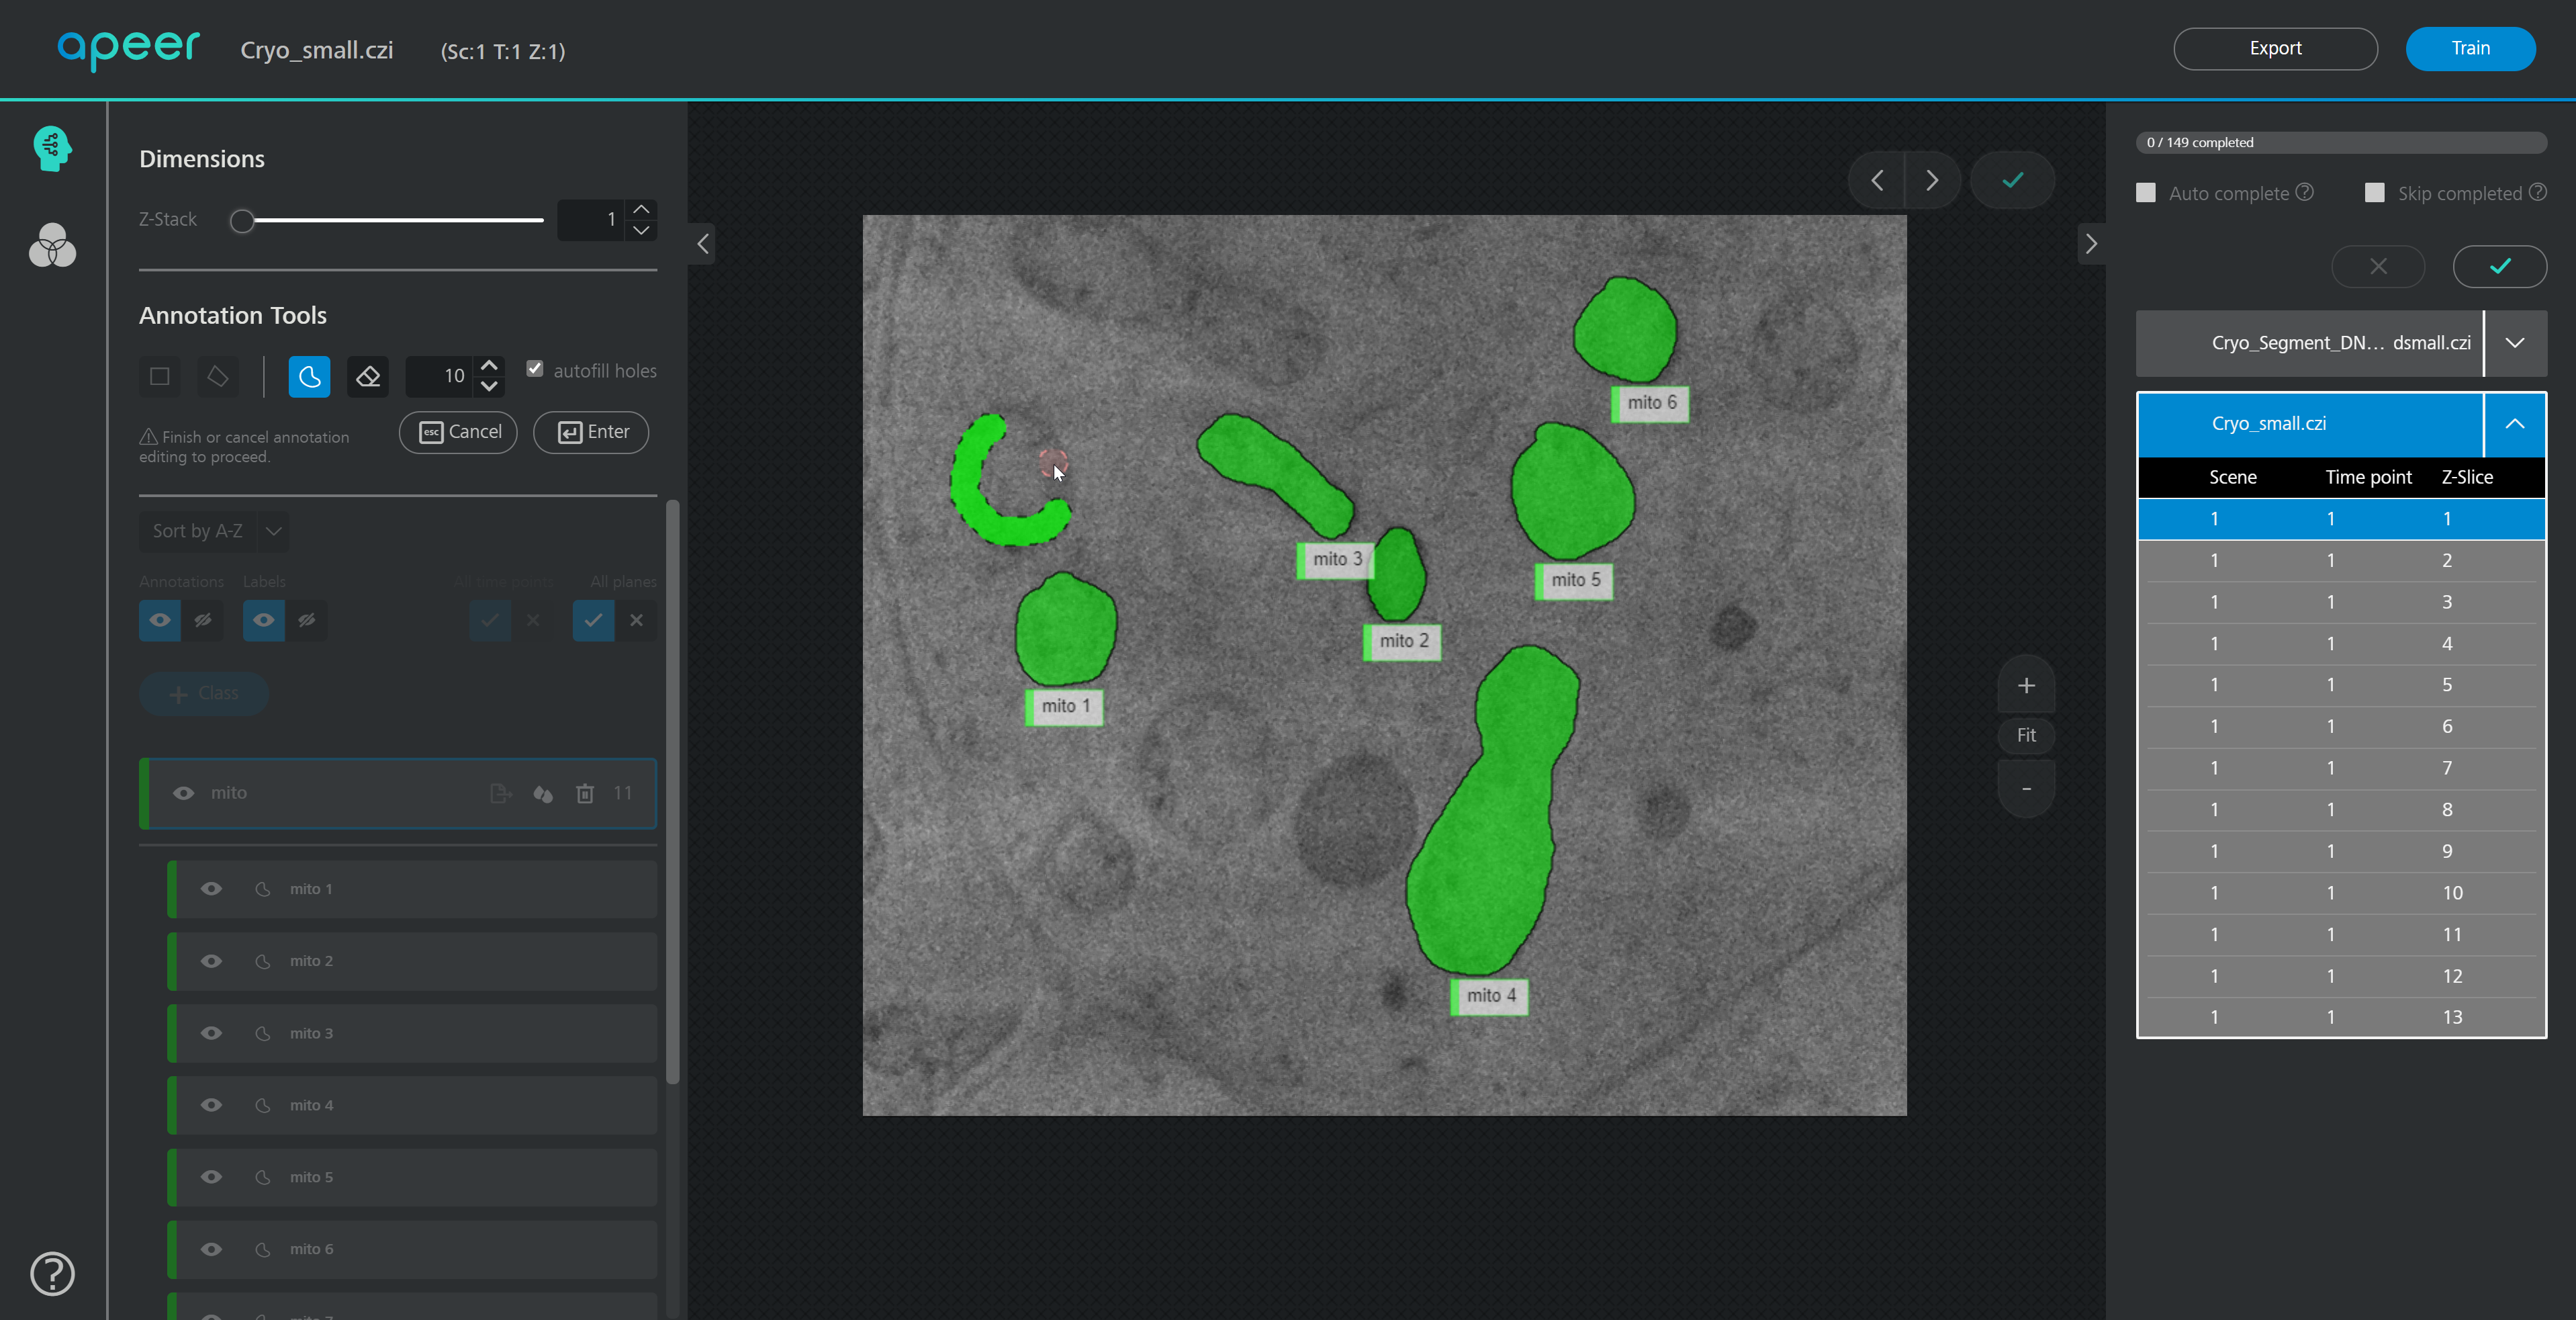
High content screening

Synonyms
HCS
Description

This notebook uses the rOMERO-gateway and EBImage to process an Image associated to the paper 'Timing of gene expression in a cell-fate decision system'.

The Image "Pos22" is taken from the dataset idr0040-aymoz-singlecell/experimentA/YDA306_AGA1y_PRM1r_Mating. It is a timelapse Image with 42 timepoints separated by 5 minutes. This Image is used to fit a model for the growth of the yeast cells. The notebook does not replicate any of the analysis of the above mentioned paper.

Its purpose is mainly to demonstrate the use of Jupyter, rOMERO-gateway and EBimage.


What it does:

  • For each time point of one movie:
    • Read the image for this time point  from the IDR
    • Threshold the images and count the cells using EBimage functions
  • Fit an exponential model to the count of cells against time to get a coefficient of grow (exponential factor)


has function
Description

This workflow can be ran with data from 3D-SIM showing the centrosomes in order to compare the distribution of diameters of rings (or toroids) of different proteins from the centrioles or the peri centriolar material. It aims to reproduce the results of the Nature Cell Biology Paper Subdiffraction imaging of centrosomes reveals higher-order organizational features of pericentriolar material  from the same data set but with a different analysis method.

It is slightly different from the methods described in the paper itself, where the method was to work on a maximum intensity projection of a 3D-SIM stack, and then to fit circle to the centrioles to estimate the diameters of the toroids.

In this workflow, the images are read from the IDR , then process by thresholding (Maximum entropy auto thresholding with Image J), and processed by Analyze Particles  with different measurement sets, including the bouding box. Then the analysis of diameters and the statistical test are performed using R. All the code and data sets are available, and in the case of this paper have shown a layered organisation of the proteins.

Combined view from Figure 1 Lawo et al.
Description

Bioconductor provides tools for the analysis and comprehension of high-throughput genomic data. Bioconductor uses the R statistical programming language, and is open source and open development. It has two releases each year, 1560 software packages, and an active user community. Bioconductor is also available as an AMI (Amazon Machine Image) and a series of Docker images.

has function

CEM

Description

Computer-assisted Evaluation of Myelin formation (CEM) is a collection designed to automate myelin quantification. It requires use input to choose the best threshold values. The myelin is calculated as an overlap between neuronal signal and oligodendrocyte signal. Results are given as pixel counts and percents.

CEM runs as an imageJ plugin with an optional Matlab extension to remove cell bodies. More details are published at Kerman et al. 2015 Development. Supplemental Material includes a detailed user manual and the download link.

Myelin
Description

EBImage provides general purpose functionality for image processing and analysis. In the context of (high-throughput) microscopy-based cellular assays, EBImage offers tools to segment cells and extract quantitative cellular descriptors. This allows the automation of such tasks using the R programming language and facilitates the use of other tools in the R environment for signal processing, statistical modeling, machine learning and visualization with image data.

EBImage is available through the Bioconductor software project (www.bioconductor.org). Strengths Lightweight Suitable for automated, scripted analyses All functions are documented with examples Modular links to R and Bioconductor software, notably imageHTS and cellHTS2 Community support via the Bioconductor mailing list Reproducible (image) analysis using the Sweave report-writing system

EBImage