Workflow

A workflow is a set of components assembled in some specific order to

  1. Measure and estimate some numerical parameters of the biological system or
  2. Visualization

for addressing a biological question. Workflows can be a combination of components from the same or different software packages using several scripts and manual steps.

Description

The Measure Rosette Area Tool allows to measure the area of the rosettes of arabidopsis plants.

See: http://dev.mri.cnrs.fr/projects/imagej-macros/wiki/Measure_Rosette_Area…

Example data: http://biii.eu/node/1146http://biii.eu/node/1145

has function
Description

[as of 20180524, the website is temporary not functioning do to web defacement - please check again later] This tutorial will exemplify basic rapidSTORM usage by showing how to convert an Andor SIF acquisition to a super-resoluted image with rapidSTORM.

Description

The website implements a set of computer vision algorithms designed to automatically process time-lapse images of fluorescently labeled focal adhesion proteins in motile cells.

The methods associated with the processing have been published in PLOS One and Cell. The publication describes a quantitative analysis of focal adhesion dynamics that have been imaged using TIRF. All image processing steps are well explained or referenced.

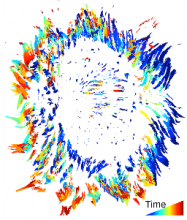
To better understand the dynamic regulation of focal adhesions, we have developed an analysis system for the automated detection, tracking, and data extraction of these structures in living cells. This analysis system was used to quantify the dynamics of fluorescently tagged Paxillin and FAK in NIH 3T3 fibroblasts followed via Total Internal Reflection Fluorescence Microscopy (TIRF). High content time series included the size, shape, intensity, and position of every adhesion present in a living cell. These properties were followed over time, revealing adhesion lifetime and turnover rates, and segregation of properties into distinct zones.


has function
Description

The workflow computes cell-based colocalisation of two stainings in 2-D images. Both pixel- and object-based readouts are provided and some pros and cons are discussed. Please read here for more information:

https://github.com/tischi/ImageAnalysisWorkflows/blob/master/CellProfil…


Input data type: 

images

Output data type: 

processed images, numbers, text file, csv files

Description

This article Baslat et al. presents a method to compute Lymphatic Vessel Density on an image of the whole slide (a workflow documented as text).

Vessels are obtained with a Maximum Entropy Thresholding applied on the excess Red channel (2 times the red values minus blue+green value). Stroma tissue is obtained with a Moment Preserving Thresholding on the blue channel.

has topic
has function