Bright field microscopy

Description

Spot detector detects and counts spots, based on wavelet transform.

- Detects spots in noisy images 2D/3D.
- Depending on objective, spots can be nuclei, nucleus or cell
- Versatile input: sequence or batch of file.
- Detects spot in specific band/channel.
- Multi band labeling: automaticaly creates ROIs from one band and count in the same or an other band.
- Filters detection by size.
- Sort detection by ROIs
- Output data in XLS Excel files: number of detection by ROIs, and each detection location and size.
- Outputs withness image with ROIs and detection painted on it.
- Outputs binary detection image.
- Displays detections
- Displays tags

logo spot detector
Description

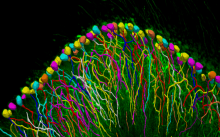
Neurolucida is a powerful tool for creating and analyzing realistic, meaningful, and quantifiable neuron reconstructions from microscope images. Perform detailed morphometric analysis of neurons, such as quantifying 1) the number of dendrites, axons, nodes, synapses, and spines, 2) the length, width, and volume of dendrites and axons, 3) the area and volume of the soma, and 4) the complexity and extension of neurons. See 10.3389/fnins.2012.00049

Neurolucida example
Description

Count bacterial colonies on agar plates and measure the occupied surfaces. The user has to provide a selection (roi) of the area that will be analyzed. He can than run the segmentation and if necessary correct the results. In a third step he can run the counting and measurement.

has function
Description

ImageJ plugin to analyze changes in vessel diameters, described in Fernández er al (2014). More specifically the paper describes the measurement of isolated retinal arterioles (ca 50 micrometer diameter) but can be used for diameter measurements of similar vessel structures.

Description

CellX is an open-source software package of workflow template for cell segmentation, intensity quantification, and cell tracking on a variety of microscopy images with distinguishable cell boundary.

Installation and step-by-step usage details are described in Mayer et al (2013). 

After users provide a few annotations of cell sizes and cell boundary profiles, it tries to match boundary profile pattern on cells thus provide segmentation and further tracking. It works the best on cells without extreme shapes and with a rather homogeneous boundary pattern. It may not work well on images with cells of sizes only a few pixels. Its output comprises control images for visual validation, text files for post-processing statistics, and MATLAB objects for advanced subsequent analysis.