intensity measurement

Description

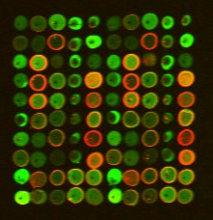
In this case study, MATLAB, the Image Processing and Signal Processing toolboxes were used to determine the green intensities from a small portion of a microarray image containing 4,800 spots. A 10x10 pattern of spots was detected by averaging rows and columns to produce horizontal and vertical profiles. Periodicity was determined automatically by autocorrelation and used to form an optimal length filter for morphological background removal. A rectangular grid of bounding boxes was defined. Each spot was individually addressed and segmented by thresholding to form a mask. The mask was used to isolate each spot from surrounding background. Individual spot intensity was determined by integrating pixel intensities. Finally, integrated intensities were tabulated and saved to a data file for subsequent statistical analysis to determine which genes matter most.

Description

This Javascript works in ImageJ to measure 3D intensity profile along cylindrical space with variable radius.

Description

For each ROI, provides the ratio of pixels over a given threshold over the total number of pixels in the ROI.

has topic
Description

Tracks a cell in a 2D video using active contours, and produces a list of ROI where intensity is measured and reported into a workbook. The cell must be first delineated with a ROI in the first image of the video.

need a thumbnail
Description

In this human cytoplasm-nucleus translocation assay, learn how to load a previously calculated illumination correction function for two separate channels, measure protein content in the nucleus and cytoplasm, and calculate the ratio as a measure of translocation. This is a clumpy cell type, so studying the settings in primary object identification may be helpful for users interested in the more advanced options that module offers. More about these images can be found at the BBBC.

need a thumbnail