Workflow

A workflow is a set of components assembled in some specific order to

  1. Measure and estimate some numerical parameters of the biological system or
  2. Visualization

for addressing a biological question. Workflows can be a combination of components from the same or different software packages using several scripts and manual steps.

Description

The workflow includes segmentation, tracking and quantifying morphological dynamics of moving cells in 3D. The authors have implemented the workflow in Matlab, but so far there is no download link provided. To apply this workflow, we recommend to contact the authors or to implement the worflow based on the detailed description in the original paper.

has function
need a thumbnail
Description

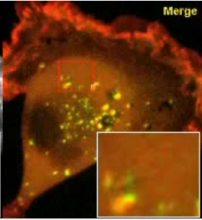
WASH, Exo84, and cortactin spot detection and codistribution analysis To detect endosomes, an automatic Otsu threshold is applied to the Gaussian-filtered MT1-MMP–positive endosome image (= 1.5 pixels for the sample image). Statistics about each endosome are then saved, for example random positioning of spots can be compared to actual positioning. For each endosome, WASH and Exo84 (or WASH and cortactin) spots are searched for in a neighboring of x pixels in their respective channel. Their number and position are saved per endosome (**see the macro in Text file S2 downloadable from here**).

From the position of WASH and Exo84 (or WASH and cortactin) spots around each endosomes, each WASH spot is paired with its closest Exo84 (or cortactin) spot neighbor, optimized over all spots around this endosome.

This allowed measuring of the distribution of distance between WASH-Exo84 (or WASH-cortactin) spots (**for the co-distribution analysis, see matlab scripts in Zip file S3 downloadable).

endosomes and spot neighbors
Description

This macro was designed to measure the size of the scratch wound in a wound scratch assay. It uses an edge-detection and thresholding technique.

It will batch process all images in a directory. Images captured by time-lapse should be compiled into stacks using a tool similar to "Metamorph nd & ROI files importer (nd stack builder)" by Fabrice P. Cordelières. Images to be analyzed should be placed in one directory (Source Directory). A second directory should be created to save results files and images (Destination Directory). Setting correct Lower and Upper thresholds is important to obtain a good result. Two macros are available, one using edge detection, the second one using background subtraction.

Description

It explains how to use ImageJ to compare the density (aka intensity) of bands on an agar gel or western blot.

Some notes can be found here: http://cellnetmcweb.bioquant.uni-heidelberg.de/image-analysis/ShortTutorials/Fiji_GelAnalyzer.pdf

Description

The workflow contains a Matlab package (plusTipTracker) for segmentation and tracking of microtubule tips, based on fluorescence time-lapse movies from microtubule tip markers such as EB-GFP. The tracking model accounts for the specific movement characteristics of microtubules Moreover, scripts for secondary analysis of detected microtubule paths are provided.

plusTipTracker is part of u-track 2.0 package. The workflow is described in the reference. 

has topic
has function