Mac

Description

In this case study, MATLAB, the Image Processing and Signal Processing toolboxes were used to determine the green intensities from a small portion of a microarray image containing 4,800 spots. A 10x10 pattern of spots was detected by averaging rows and columns to produce horizontal and vertical profiles. Periodicity was determined automatically by autocorrelation and used to form an optimal length filter for morphological background removal. A rectangular grid of bounding boxes was defined. Each spot was individually addressed and segmented by thresholding to form a mask. The mask was used to isolate each spot from surrounding background. Individual spot intensity was determined by integrating pixel intensities. Finally, integrated intensities were tabulated and saved to a data file for subsequent statistical analysis to determine which genes matter most.

Description

Rigid registration of time series in 3D. A video tutorial is available (be careful of sounds, the video automatically starts!): [Sample Drift Correction Following 4D Confocal Time-lapse Imaging](http://www.jove.com/video/51086/sample-drift-correction-following-4d-co…)

has function
Description

Quote

Perfect for the beginner, this demo illustrates simple object detection (segmentation, feature extraction), measurement, and filtering. Requires the Image Processing Toolbox (IPT) because it demonstrates some functions supplied by that toolbox, plus it uses the "coins" demo image supplied with that toolbox. If you have the IPT (you can check by typing ver on the command line), you should be able to run this demo code simply by copying and pasting this code into a new editor window, and then clicking the green "run" triangle on the toolbar. First finds all the objects, then filters results to pick out objects of certain sizes. The basic concepts of thresholding, labeling, and regionprops are demonstrated with a simple example.

It's a good tutorial for those users new to MATLAB's image processing capabilities to learn on, before they go on to more sophisticated algorithms.

has function
Description

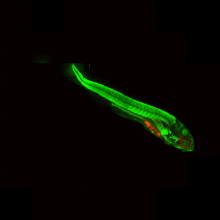
Normalize the orientation of the images of the Zebrafish embryos.

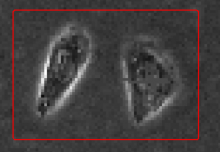
In the documentation webpage, the aim of the workflow is to normalize the orientation of the images of the Zebrafish embryos, find the point of injection of tumor cells and measure the distribution of Cy3 stained tumor foci.

ImageJ macro implementation of the Workflow described in Ghotra et al (2012). Note that currently only the angle and orientation normalization is implemented in this version.

Sample images are linked in the documentation webpage. 

has function
Description

This Matlab code demonstrates an edge-based active contour model as an application of the Distance Regularized Level Set Evolution (DRLSE) formulation.

initialisation