2D

Description

In this example, cells are grown as a tissue monolayer. Rather than identifying individual cells, this pipeline quantifies the area occupied by the tissue sample.


Download package also contains example images. 

Description

quote

This is a simple example of a DNA damage assay using single cell gel electrophoresis. Here, the measurement of interest is the length and intensity of the comet tail. Also, illumination correction is used to reduce background fluorescence prior to measurement. Also shown is a silver-stained comet example in which the percentage of DNA contained in the tail is calculated.

Example Images: Packaged together with the cellprofiler pipeline file. 

Description

The Leaf Infection Tools allow to measure the area of leaves, of two stainings in different channels and of the overlap region of the two stainings. 

See: http://dev.mri.cnrs.fr/projects/imagej-macros/wiki/Leaf_Infection_Tools

Test image: http://biii.eu/node/1143

a leaf with infection pattern
Description

Oufti (previously named MicrobeTracker) is a MATLAB application / suite of tools for analysing fluorescent spots inside microbes. MicrobeTracker can identify cell outlines and fluorescent foci, and generate plots and statistics based on positions and intensity (kymographs, histograms etc.) The MATLAB code is easy to modify and extend to add additional plots and statistics: see e.g. Lesterlin et al. (2014).

The Outfi Forum is quite active.

Description

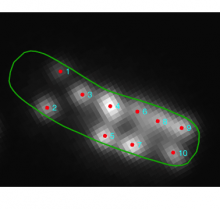
Analyzing Ca2+ sparks

ImageJ plugin to detect and measure Ca2+ sparks in linescan images, described in Picht et. al. (2007). The algorithm is based on that described by Cheng et al. (1999). Care should be taken to ensure that detections belong to 'true' events, as without any additional background subtraction steps the algorithm is not appropriate for images in which the baseline fluorescence varies substantially.