A canvas plugin using JFreeChart to show intensity profile of a specific row or column. Initially used in a 1-row image of 1D signal representation. Can also used with Micro-Manager for Icy Plugin to show 1D signal from hardware like data acquisition device as waveform. Common 2D+ sequence is also supported. Using it by select the plugin icon in the canvas type combobox of the sequence window, a JFreeChart line chart will show up. As an alternative plugin to Intensity Profile, this plugin is modified from "Intensity Profile" by fab, special thanks to him for giving me the idea to make such a plugin.
MonogenicJ performs multiresolution monogenic analyses of 2D images. It extracts wavelet-domain features that characterize the local orientation, the phase and the dominant frequency of an image patch at various levels of resolution.
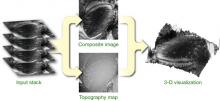
Wavelet-based method to merge a stack of micrographs taken at different focal positions (aligned along the optical axis) into a single, entirely focused composite image.