Workflow

A workflow is a set of components assembled in some specific order to

  1. Measure and estimate some numerical parameters of the biological system or
  2. Visualization

for addressing a biological question. Workflows can be a combination of components from the same or different software packages using several scripts and manual steps.

Description

Free-D (http://free-d.versailles.inra.fr/) is a 3D reconstruction and modeling software. It is multiplatform, free (but not open source) tool for academic research and teaching.

Here is how to proceed, using Free-D:

1. Segmentation:

* load (a collection of) individual 3d stacks

* (optional for serial sections) perform a 2D registration to align image slices

* segment/reconstruct 3D contours using snakes

* segment 3D spots

2. Construct average cell:

* normalize the contours to compute a average cell, by registering/warping 3D contours/surfaces

3. Quantification:

* project each individual cell to the average one

* build density maps to analyze (cartography)

A few notes for current software version (till 10/2016):

* input file format: tiff (not able to import bioformats)

* currently results are saved in customized format, but there is an exportor to convert this format into fiji readable one

* import already generated contours is on the software's TODO list

need a thumbnail
Description


In this workflow, you can use MorphoLibJ to generate accurate morphometric measurements

  • First the fibers are segmented by mathematical morphology:
    • for example by using MorphoLibJ:
      • Create a marker image by creating a rough mask with extended regional maxima (similar to Find Max), such that you have one max per fiber
      • Use the marker controlled watershed (in MorpholLibJ/ Segmentation/ marker controlled watershed) : indicate the original grayscale image as the input, Marker will be your maxima image, select None for mask
      • it will create a label mask of your fibers
  •  In MorphoLibJ /analyze/ select Region Morphometry: this will compute different shape factors which are more robust than the ones implemented by default in ImageJ
  • Export the result table created to a csv file
  • Then for example in Matlab or R, you can apply a PCA analysis (Principal component analysis) followed by a k-means with the number of class (clusters) (different fibers type) you want to separate.
  • You can then add this class as a new feature to your csv file.
  • From this you can sort your labelled fibers into these clusters for a visual feedback or further spatial analysis
has topic
hemp analysis
Description

When trying to isolate objects, one strategy might be to use regular morphological operations (opening/closing) to remove small objects that are not of interest. In case small objects are made of a large number of pixels, this operation might impair the remaining objects' contours. An alternative strategy might be to use morphological reconstruction. In short, seed is placed on the image, on objects, then conditional dilation is performed from those seeds.

Here is how to proceed, using MorphoLibJ:

  1. Open an image
  2. Use the multi-point selection tool and place seeds on objects of interest
  3. Create a new image of same size, black background
  4. Transfer the selection to the new image (Edit/Selection/Restore selection)
  5. Draw (make sure you're using white foreground) the multiple point selection
  6. Launch the Morphological reconstruction plugin: Plugins > MorphoLibJ > Morphological reconstruction
need a thumbnail
Description

Quote:

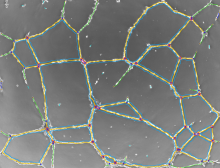
The "Angiogenesis Analyzer" allows analysis of cellular networks. Typically, it can detect and analyze the pseudo vascular organization of endothelial cells cultured in gel medium

...a simple tool to quantify the ETFA (Endothelial Tube Formation Assay) experiment images by extracting characteristic information of the network.

The outputs are network feature parameters.

Sample images

http://image.bio.methods.free.fr/ij/ijmacro/Angiogenesis/HUVEC-Pseudo-Phase-Contrast.tif.zip

http://image.bio.methods.free.fr/ij/ijmacro/Angiogenesis/HUVEC-Fluo.tif.zip

Source code

https://imagej.nih.gov/ij/macros/toolsets/Angiogenesis%20Analyzer.txt

has topic
has function
Description

This workflow will batch process a directory of images: - comets should be horizontally oriented, tails to the right. Additional preprocessing is required if the gel does not match with this orientation (Rotate images, Using ImageJ/Transform Image or TransformJ plugin for example). Then using the plugin:

  1. Uneven background correction
  2. Automatic detection of comet shapes with outliers detection
  3. Automatic detection of the heads of comets (brightest region or profile analysis)
  4. Statistical values of tails, heads and Olive moments.
  • Manual correction is available.
  • Does live analysis with Micro-Manager