Mac

Description

This protocol perform a median filter on the active sequence using the ImageJ rank filter plugin. Then, it converts the result back into Icy for display.

An example showing passing data between ICY and ImageJ using ImagePlus object. 

Description

This tool adds to ImageJ functions to build and organize montages. It comes with the ImageJ installer but can also be downloaded from the ImageJ wiki. A video tutorial is available.

has topic
has function
need a thumbnail
Description

CellX is an open-source software package of workflow template for cell segmentation, intensity quantification, and cell tracking on a variety of microscopy images with distinguishable cell boundary.

Installation and step-by-step usage details are described in Mayer et al (2013). 

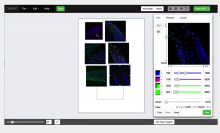
After users provide a few annotations of cell sizes and cell boundary profiles, it tries to match boundary profile pattern on cells thus provide segmentation and further tracking. It works the best on cells without extreme shapes and with a rather homogeneous boundary pattern. It may not work well on images with cells of sizes only a few pixels. Its output comprises control images for visual validation, text files for post-processing statistics, and MATLAB objects for advanced subsequent analysis.

Description

This macro recognizes wells in a picture from a multi-well plate (it works also on a picture of a single well). It is used to segment a picture to determine the number of "Colony Forming Units" in each individual well of a plate.

The steps are the following:

  1. Makes a 8-bit B&W picture, inverts it (=> borders will look white instead of black), resizes it (optional, this is to speed-up convolution thereafter) and find edges.
  2. Convolves the obtained picture with a kernel corresponding to a thick white circle of the size of the wells. The resulting image has big "blobs" or "particles" corresponding roughly to the centers of the well.
  3. The image is thresholded to remove particles not corresponding to strong hits and "Analyze particle" is run.
  4. The measured parameter is the center of mass of the particles which gives the center of the well. These are saved in an array.
  5. Circles are drawn and added to the ROI manager. The centers of the circles are the identified centers of mass of the particles and their radius is the expected radius of the wells in the original image.
has function
Description

OMERO.figure is an OMERO web application that makes generating figures from images in an OMERO image database very quick and easy. The images in the figure link back to the original data, greatly simplifying the process of adjusting the view and keeping track of original data. PDF documents are generated, which can be opened using e.g. Adobe Illustrator or Inkscape in order to produce the final finished figure.