Image registration

Image registration is the process of transforming different sets of data into one coordinate system. Registration is necessary in order to be able to compare or integrate the data obtained from different sensors/imaging modalities, at different times, from different view points, etc. . Registration can be based on correspondence established between the landmarks or feature points. Alternatively, some similarity/distance metric is established between the image intensity maps to navigate the registration process.

Synonyms
Image alignment

Description

A Jython script using the plugin : Register Virtual Stack Slices It takes a sequence of image slices stored in a folder, and delivers a list of registered image slices (with enlarged canvas). One of the images in the sequence can be selected by the user as reference and it will remain intact. The plugin can perform 6 types of image registration techniques: - Translation - Rigid (translation + rotation) - Similarity (translation + rotation + isotropic scaling) - Affine - Elastic (via bUnwarpJ with cubic B-splines) - Moving least squares All models are aided by automatically extracted SIFT features.

has function
need a thumbnail
Description

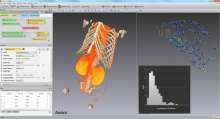
Amira is 3D visualization and analysis software for life sciences.
 

" Amira software is a powerful, multifaceted 3D platform for visualizing, manipulating, and understanding life sciences data from computed tomography, microscopy, MRI, and many other imaging modalities. 
With incredible speed and flexibility, Amira software enables advanced 3D imaging workflows for specialists in research areas ranging from molecular and cellular biology to neuroscience and bioengineering. "

has topic
Amira's interface
Description

An ImageJ macro for correcting frame drift occurred during image acquisition.

It often happens that you have an image sequence that shows problematic drifting of image frame and at the same time you have some landmarks that could be used for correcting the drift. This ImageJ macro allows you to Manually track the landmark using ImageJ Manual Tracking Plugin. Using the coordinates recorded in the Result window, each frame is shifted back so that the landmark stays in a single place.

ITK

Description

ITK is an open-source, cross-platform system that provides developers with an extensive suite of software tools for image analysis.

Developed through extreme programming methodologies, ITK employs leading-edge algorithms for registering and segmenting multidimensional data. It is widely used and contributed in the medical imaging field.

Strengths

Highly optimized C++, well commented Consistently updated (new) algorithms many tools and softwares are built upon it connected with VTK Insight Journal (open code and sample data) Extensive list of examples & tutorials

Limitations

yet detached from the bioimage analysis world hard to use for end users without development skills

itk
Description

Imaris is a software for data visualization, analysis, segmentation and interpretation of 3D and 4D microscopy images. It performs interactive volume rendering that lets users freely navigate even very large datasets (hundreds of GB). It performs both manual and automated detection and tracking of biological “objects” such as cells, nuclei, vesicles, neurons, and many more. ImarisSpots for example is a tool to detect “spherical objects” and track them in time series. Besides the automated detection it gives the user the ability to manually delete and place new spots in 3D space. ImarisCell is a tool to detect nuclei, cell boundaries and vesicles and track these through time. ImarisFilament is a module that lets users trace neurons and detect spines. For any detected object Imaris computes a large set of statistics values such as volume, surface area, maximum intensity of first channel, number of vesicles per cell etc. These values can be exported to Excel and statistics software packages. The measurements can also be analyzed directly within ImarisVantage which is a statistics tool that provides the link back to the 3D objects and the original image data. Strengths: - good visualization - user friendly interface - reads most microscopy file formats - image analysis workflows are very easy to apply - interactive editing of objects to correct errors during automatic detection - large data visualization (hundreds of GB)

has topic
null