I do not know

Description


In this workflow, you can use MorphoLibJ to generate accurate morphometric measurements

  • First the fibers are segmented by mathematical morphology:
    • for example by using MorphoLibJ:
      • Create a marker image by creating a rough mask with extended regional maxima (similar to Find Max), such that you have one max per fiber
      • Use the marker controlled watershed (in MorpholLibJ/ Segmentation/ marker controlled watershed) : indicate the original grayscale image as the input, Marker will be your maxima image, select None for mask
      • it will create a label mask of your fibers
  •  In MorphoLibJ /analyze/ select Region Morphometry: this will compute different shape factors which are more robust than the ones implemented by default in ImageJ
  • Export the result table created to a csv file
  • Then for example in Matlab or R, you can apply a PCA analysis (Principal component analysis) followed by a k-means with the number of class (clusters) (different fibers type) you want to separate.
  • You can then add this class as a new feature to your csv file.
  • From this you can sort your labelled fibers into these clusters for a visual feedback or further spatial analysis
has topic
hemp analysis
Description

This imageJ/Fiji plugin provides an analysis of the granulometry inside an image by mathematical morphology. It has sevral option for the structuring element to be used, and the size domain to be tested. The output will be both a curve of the remaining content of the image against the growing size of the structuring element, and the corresponding results table that could be then exported. It can deal with grayscale images directly, no need to segment the image first. This plugin can then be used to compare different texture based on some statistical analysis of the produced curve (for exemple comparison of the geometrical means to discriminate 2 textures). It is macro recordable as well. Programming Language: java Processes: successive erosion, dilation, closing or opening -> ANALYSIS User skills: Life Scientist, developers, analysts

has topic
granulometry
Description

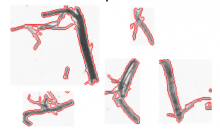
The ICP algorithm takes two point clouds as an input and return the rigid transformation (rotation matrix R and translation vector T), that best aligns the point clouds. Example: [R,T] = icp(q,p,10); Aligns the points of p to the points q with 10 iterations of the algorithm. The transformation is then applied using R*p + repmat(T,1,length(p)); The file has implemented both point to point and point to plane as well as a couple of other features such as extrapolation, weighting functions, edge point rejection, etc.

has function
need a thumbnail
Description

MosaicIA is a tool to analyze the spatial distribution of objects in images. It estimates from an observed particle or object distribution what hypothetical interaction between the objects is most likely to have created this distribution.

need a thumbnail
Description

Pandore is a standardized library of image processing operators. The current version contains image processing operators that operate on grayscale, color and multispectral, 1D, 2D and 3D images.

Link: Operator Index

has function