microarrays

Description

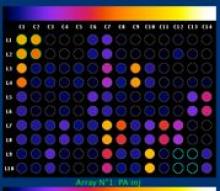
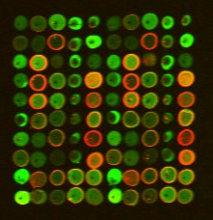
Protein array is used to analyze protein expressions by screening simultaneously several protein-molecule interactions such as protein-protein and protein-DNA interactions. In most cases, the detection of interactions leads to an image containing numerous lines of spots that will be analyzed by comparing tables of intensity values. To describe the observed different patterns of expression, users generally show histograms with the original associated images [1]. The “Protein Array Analyzer” gives a friendly way to exploit this type of analysis, thus allowing quantification, image modeling and comparative analysis of patterns.

The Protein Array Analyzer, which was programmed in ImageJ’s macro language, is an extention of the Dot Blot Analyzer, [2], [3] a graphically interfaced tool that greatly simplifying analysis of dot arrays.

Description

In this case study, MATLAB, the Image Processing and Signal Processing toolboxes were used to determine the green intensities from a small portion of a microarray image containing 4,800 spots. A 10x10 pattern of spots was detected by averaging rows and columns to produce horizontal and vertical profiles. Periodicity was determined automatically by autocorrelation and used to form an optimal length filter for morphological background removal. A rectangular grid of bounding boxes was defined. Each spot was individually addressed and segmented by thresholding to form a mask. The mask was used to isolate each spot from surrounding background. Individual spot intensity was determined by integrating pixel intensities. Finally, integrated intensities were tabulated and saved to a data file for subsequent statistical analysis to determine which genes matter most.