ROI

Description

This tutorial explain how to create an intensity profile over an ROI.

need a thumbnail
Description

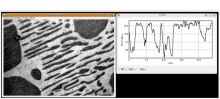
GUI tool, to view intensity profile dynamically as the position of ROI is changed by mouse-dragging a ROI. In more recent ImageJ, the native plot-profile window is equipped with "Live" mode, so this plugin function became a part of ImageJ.

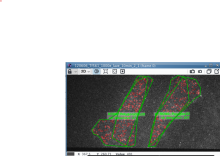
This plugin is a good scripting example using Clojure (see source code).

Description

This plugin permit to measure the signal spread of a molecule with respect to the cell area.

Description

For each ROI, computes the number of pixel over a threshold. This plugin also provides the density and outputs results as an excel file.

has topic
need a thumbnail