Frequency analysis

https://en.wikipedia.org/wiki/Fourier_analysis https://en.wikipedia.org/wiki/Wavelet|Frequency domain analysis (or spectral density estimation), is the process of decomposing a complex signal into simpler parts. Many physical processes are best described as a sum of many individual frequency components. Any process that quantifies the various amounts (e.g. amplitudes, powers, intensities, or phases), versus frequency can be called spectrum analysis. The Fourier transform of a function produces its frequency spectrum by decomposing the function into its sine and cosine components. Whereas the standard Fourier transform is only localized in frequency, wavelets are localized in both time and frequency. Wavelets are handcrafted to correlate with particular frequencies in a signal; a set of wavelets is usually used for a complete analysis.


Synonyms
Fast Fourier transform
FFT
Wavelet transform
Description

This package contains some MatLab tools for multi-scale image processing. Briefly, the tools include: - Recursive multi-scale image decompositions (pyramids), including Laplacian pyramids, QMFs, Wavelets, and steerable pyramids. These operate on 1D or 2D signals of arbitrary dimension. Data structures are compatible with the MatLab wavelet toolbox. - Fast 2D convolution routines, with subsampling and boundary-handling. - Fast point-operations, histograms, histogram-matching. - Fast synthetic image generation: sine gratings, zone plates, fractals, etc. - Display routines for images and pyramids. These include several auto-scaling options, rounding to integer zoom factors to avoid resampling artifacts, and useful labeling (dimensions and gray-range).

need a thumbnail
Description

Calculate the Fourier ring correlation (FRC). The FRC can be used as a resolution criterion for super resolution microscopy. The Plugin can display a plot of the FRC curve, along with the LOESS smoothed version of the curve. Finally it displays the threshold method used and the intersection of the FRC with the threshold, providing the FIRE number. It can be used on two open images or on pairs of images in batch mode. 2654 2655

need a thumbnail
Description

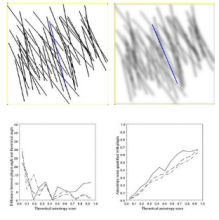
Evaluates the orientation of fiber orientation pattern and plots the results in the image. It calculates gradient in x and y direction. - then calculates the eigenvector of nematic tensor, which is the orientation of the pattern.

Description

The Fourier transform of an image produces a representation in frequency space: i.e. separated according to spatial frequency (effectively scale). The 2D amplitude map of the different spatial frequencies is symmetrical, and is commonly displayed with low spatial frequencies (large features) in the centre, highest spatial frequencies (small features) at the edges. Fourier filtering involves suppressing or enhancing features in the Fourier domain before carrying out an inverse Fourier transform to obtain a filtered real-space image. ImageJ's _Process > FFT > Bandpass Filter_ implements two common Fourier-filtering functions: 1. filtering for specific sizes of feature in an image by selecting minimum and maximum feature sizes (selecting a radial band of frequencies in Fourier space); 2. filtering out repetitive horizontal or vertical stripes by cutting out a zero-frequency stripe in the orthogonal direction in frequency space. The example image above shows the effect of filtering for 2 feature size ranges: 0-8 pixels, and 8-256 pixels; where the former appears "flattened" or washed-out, and the latter very blurred. The small images displayed to the lower-right of each filtered image correspond to the mask applied to the Fourier transform. Such filtering can be useful prior to global thresholding, for noise suppression, etc.

ImageJ bandpass screenshot
Description

Filters an image using the fast 2D FFT convolution product.

need a thumbnail