2D

Description

This macro performs measurements of average and standard deviation intensity inside wells of a protein microarray (the number of wells is limited to 250, the image should be cropped for larger arrays). The macro requires the "ImageJ plugins toolkit". To ensure compatibility with Fiji you should download the version 1.6.1The installation instructions can be found here, it only consists in un-compressing the .jar file from the previous archive to Fiji plugins folder.


sample image: link

has function
Description

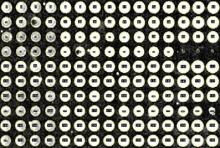
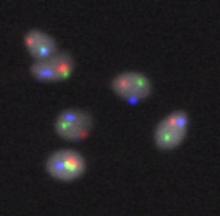
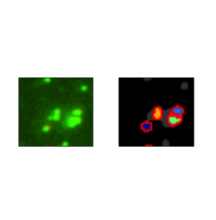
The macro segments and classifies human spermatozoids nuclei (DAPI) based on the number of FISH signals (spots) they contain. It reports the percentage of occurrences of user defined classes (combinations of spot multiplicity in the FISH channels) as well as the position (point selections) of the detected nuclei falling in these classes. The input image should be an hyperstack with 4 channels: DAPI (first channel) and three FISH channels. The images are typically obtained as a maximum intensity projection of few channels (confocal) or a single z slice acquisition (widefield).

Example image available in the linked page. 

has function
Description

Quote:

This pipeline shows how to identify smaller objects (foci) within larger objects (nuclei) and how to use the Relate module to establish a relationship between the two as well as perform per-object aggregate measurements (such as number of foci per nucleus). Sample images are included in the download package.

Description

The quantification is explained in detail in chapter 8 "Cell Polarity - Focal Adhesion and Actin Dynamics in Migrating Cells" in "Bioimage Data Analysis Book" downloadable from here.

For codes and sample images, download the zipped archive (linked under "Download").

has function
Description

Quote:

Measuring the colocalization between fluorescently labeled molecules is a widely used approach to measure the degree of spatial coincidence and potential interactions among subcellular species (e.g., proteins). This example shows how the object identification and RelateObjects modules are used to measure the degree of overlap between two fluorescent channels. Sample image is included in the download package.